Abstract
Phosphoethanolamine cytidylyltransferase (ECT) catalyzes the rate-controlling step in a major pathway for the synthesis of phosphatidylethanolamine (PtdEtn). Hepatocyte-specific deletion of the ECT gene in mice resulted in normal appearing animals without overt signs of liver injury or inflammation. The molecular species of PtdEtn in the ECT-deficient livers were significantly altered compared with controls and matched the composition of the phosphatidylserine (PtdSer) pool, illustrating the complete reliance on the PtdSer decarboxylase pathway for PtdEtn synthesis. PtdSer structure was controlled by the substrate specificity of PtdSer synthase that selectively converted phosphatidylcholine molecular species containing stearate paired with a polyunsaturated fatty acid to PtdSer. There was no evidence for fatty acid remodeling of PtdEtn. The elimination of diacylglycerol utilization by the CDP-ethanolamine pathway led to a 10-fold increase in triacylglycerols in the ECT-deficient hepatocytes that became engorged with lipid droplets. Triacylglycerol accumulation was associated with a significant elevation in the expression of the transcription factors and target genes that drive de novo lipogenesis. The absence of the ECT pathway for diacylglycerol utilization at the endoplasmic reticulum triggers increased fatty acid synthesis to support the formation of triacylglycerols leading to liver steatosis.
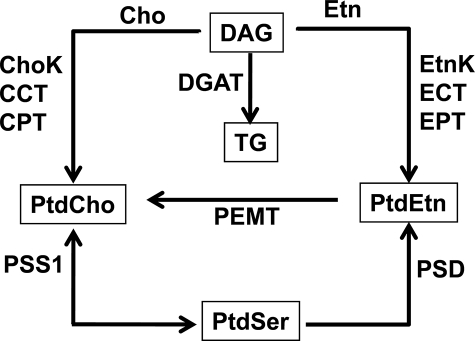
PtdEtn2 is the second most abundant phospholipid in mammals and has many important functions in cell physiology (for reviews see Refs. 1–4). The cone shape of PtdEtn is thought to underlie the importance of PtdEtn as a chaperone for membrane protein folding and its role in promoting membrane fusion. Plasmalogens constitute a major fraction of the PtdEtn molecular species in several tissues and cell lineages (3). PtdEtn headgroup turnover is associated with signal transduction events and protein kinase C activation. PtdEtn is a major reservoir for polyunsaturated fatty acids that are released following cell activation and converted to the myriad of bioactive eicosanoids that regulate cell function. The fatty acid ethanolamides arise from the acylation of the PtdEtn headgroup followed by hydrolysis of N-acyl-PtdEtn. PtdEtn is also used as a precursor for PtdCho, the major membrane phospholipid in mammals. The Pemt gene encodes the only enzyme in this pathway, and PEMT performs all three of the methylation steps (Fig. 1). The significance of PtdEtn methylation to PtdCho production is reflected by the expression of PEMT, which is highest in liver and testis (5, 6), and this pathway is critical for the survival of animals on a choline-deficient diet (7).
FIGURE 1.
Schematic overview of hepatic lipid biosynthetic pathways. There are multiple inter-related pathways for the formation of the major liver phospholipids. The diet is a principal source for Cho and Etn, as well as the fatty acids that are assembled into DAG. Fatty acids may also be derived from de novo fatty acid biosynthesis or transported to the liver from adipose tissue. The major route to PtdCho is the CDP-Cho pathway: Cho kinase (ChoK), CCT, and Cho phosphotransferase (CPT). A major route to PtdEtn is the CDP-Etn pathway: Etn kinase (EtnK), ECT, and Etn phosphotransferase (EPT). Also, PtdCho is converted to PtdEtn by base-exchange with serine to form PtdSer, followed by its conversion to PtdEtn by decarboxylation (PSD) or potentially by another base-exchange enzyme (PSS2) that exchanges Etn for serine. PtdCho is produced from PtdEtn through sequential methylation by PEMT. TG is formed by DAG acyltransferases (DGAT) from the DAG that is not devoted to the synthesis of phospholipids.
The CDP-Etn pathway is a major route to PtdEtn in hepatocytes (Fig. 1) (8–10). Etn kinase catalyzes the first step, and there are two genes that encode isoforms of this kinase (11). The ECT step in the pathway forms CDP-Etn and is the control point in the pathway (1, 11–13). There is a single ECT gene in mice (Pcyt2), which expresses two protein variants arising from differential splicing of exon 7 (14, 15). The final step is the transfer of phospho-Etn from CDP-Etn to DAG. This reaction is catalyzed by two different gene products, a dual specificity Cho/Etn phosphotransferase (16) and a recently discovered Etn-specific phosphotransferase (EPT) (17). The fact that the gene encoding ECT is induced by growth factors (18), that Etn is essential for the growth and survival of hepatocytes (19), and that the global knock-out of the ECT gene (Pcyt2) is embryonic lethal (20) all support the view that ECT, and hence the CDP-Etn pathway, is essential for the proliferation, differentiation, and survival of animal tissues (for reviews see Refs. 1, 2).
A second important pathway to PtdEtn is the PSD pathway (Fig. 1) (21). This route is initiated by the exchange of the Cho headgroup of PtdCho for Ser by PSS1 to form PtdSer. There is only a single mitochondrial PSD in mammals (2, 22), and due to the absence of Etn in most tissue culture media, the PSD pathway is clearly important for PtdEtn formation in cultured cells (2, 23, 24). PSD knock-out mice have an embryonic lethal phenotype (22). A potential third route also begins with the PSS1 exchange reaction and is completed by the PSS2 exchange activity that replaces the serine on PtdSer with Etn (data not shown). PSS2-dependent PtdSer formation is considered relevant to PtdSer synthesis (25, 26) but is not considered as a significant route to PtdEtn (2). The PSS1 and PSS2 pathways also represent mechanisms to produce either choline or ethanolamine to be used in the respective cytidine-dependent pathways (27). PSS1 (28) and PSS2 (29) null mice are viable, but the PSS1/PSS2 double knock-out mice have an embryonic lethal phenotype (28) suggesting that the two enzymes can compensate for one another for the formation of the small, but essential, amount of PtdSer.
Our approach to addressing the importance of the CDP-Etn pathway in controlling the molecular species composition of PtdEtn and its overall impact on liver lipid homeostasis was to construct a conditional knock-out mouse with an ECT-deficient liver. Although the CDP-Etn pathway was not necessary for growth and differentiation of hepatocytes, the absence of this pathway resulted in significant changes in the phospholipid molecular species composition and the accumulation of TG giving rise to hepatic steatosis.
EXPERIMENTAL PROCEDURES
Generation of the Hepatocyte-specific ECT Knock-out Mice
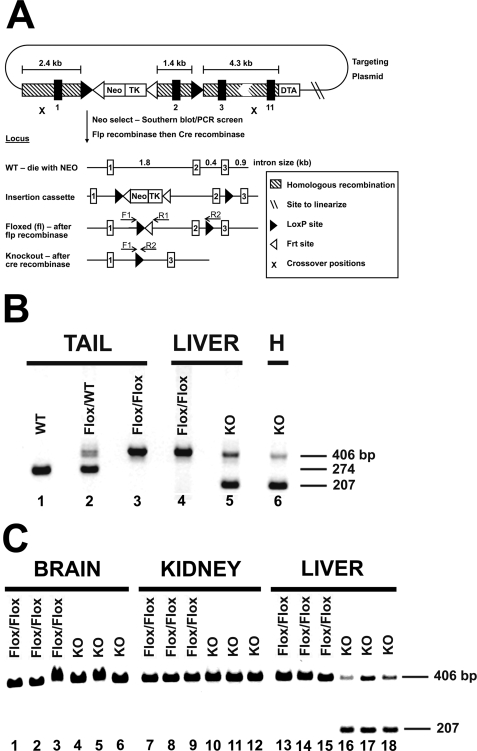
The steps to obtain a hepatocyte-specific knock-out of ECT are outlined in Fig. 2A. The steps were as follows: 1) engineering the plasmid construct depicted in Fig. 2; 2) transducing, screening, and selecting clonal embryonic stem cells that contained a replacement of the endogenous ECT gene with the engineered construct by homologous recombination; 3) injecting mouse blastocysts with the recombinant embryonic stem cells (St. Jude Transgenic Core Facility); 4) screening mouse chimeras for mosaic animals capable of germ line transmission of the engineered ECT gene; and 5) mating the mice carrying the recombinant allele with a transgenic mouse strain globally expressing the FLP1 recombinase. The FLP1 recombinase-mediated deletion of the DNA between the “Frt” sequences (Fig. 2) removed the NeoTK selection cassette and yielded a floxed mouse with the addition of only two 35-bp pieces of new DNA in two introns (Fig. 2A). The ECT floxed mouse was crossed with a transgenic mouse expressing the Cre recombinase under control of the liver-specific albumin promoter (The Jackson Laboratories, Bar Harbor, ME). The Cre recombinase under control of the albumin promoter mediates the extremely efficient and selective deletion of the genomic DNA between the “loxP” sequences specifically in hepatocytes (30). Mice with a tail genotype of Pcyt2fl/fl/Alb-Cre+/0 lacked functional ECT expression in hepatocytes. Routine genotyping used a PCR-based screen of mouse tail DNA using primers specific for the ECT floxed (fl) allele and the Alb-Cre transgene (Fig. 2B). The primers used for Pcyt2 genotyping were as follows: F1, 5′-TGGTGTTGACATGATGATAGCC-3′; R1, 5′-TGACACAAGTGGACAGTTCCC-3′; R2, 5′-CTGCAGTGTGCAAATGGTATG-3′. These data identified mice with a liver-specific knock-out (Pcyt2fl/fl/Alb-Cre+/0) and the floxed (Pcyt2fl/fl/Alb-Cre0/0) control mice arising from each litter. A product of the F1-R2 primer pair (1637 bp) in the floxed liver sample was not observed because of the short extension time in the PCR analysis.
FIGURE 2.
Creation of the hepatocyte-specific Pcyt2 (ECT) gene deletion. A, diagram (not to scale) shows the targeting plasmid at the top, highlighting the genomic insertion cassette that confers cellular resistance to neomycin (NeoTK). Line 2 shows the structure of the wild-type allele that was replaced by recombination with the insertion cassette. Line 3 shows the gene structure after recombination in embryonic stem cells. Line 4 shows the floxed (fl) allele that resulted from a cross between mice carrying the insertion cassette and transgenic mice expressing the FLP recombinase. FLP mediated excision of the NeoTK selection cassette left only short DNA sequences within the two introns encoding two LoxP sites (▶) and a residual Frt site (◁). These were called floxed mice and served as the wild-type littermate controls. Line 5 shows the ECT allele that was deleted in the livers of progeny arising from a cross between floxed mice and mice that expressed the Alb-Cre transgene. The deleted ECT allele lacked exon 2 and retained a single 34-bp LoxP site in the intron between exons 1 and 3. F1 is the forward PCR primer, and R1 and R2 are the two reverse PCR primers used for genotyping. B, DNA was extracted from mouse tails and liver samples from either nonfloxed wild-type (WT) mice, control floxed (Flox/Flox) mice lacking the transgene (Pcyt2fl/fl/Alb-Cre0/0), heterozygous floxed (WT/Flox) mice, or knock-out (KO) mice expressing the Cre recombinase in liver (Pcyt2fl/fl/Alb-Cre+/0). Tail samples are as follows: lane 1, wild-type mouse (Pcyt2+/+); lane 2, heterozygous mouse (Pcyt+/fl); and lane 3, floxed mouse (Pcyt2fl/fl). Liver samples are as follows: lane 4, a control liver (Pcyt2fl/fl/Alb-Cre0/0) with the 406-bp floxed band; and lane 5, an ECT-deficient liver (Pcyt2fl/fl/Alb-Cre+/0) with the 207-bp ECT knock-out band. Lane 6, hepatocytes (H) isolated from an ECT-deficient liver. C, DNA was extracted from the brain (lanes 1–6), kidney (lanes 7–12), and liver (lanes 13–18) of three control female mice (Flox/Flox, lanes 1–3, 7–9, and 13–15) or three knock-out female mice (KO, lanes 4–6, 10–12, and 16–18). Multiplex PCR was performed using primers F1 plus R1 + R2 to genotype liver, kidney, brain and hepatocyte samples.
Animal Experiments
The breeding program mated Pcyt2fl/fl mice with Pcyt2fl/fl, albumin-Cre+/0 mice. This strategy on average produced an equal number of mice with either normal ECT levels in the liver (Pcyt2fl/fl, Albumin-Cre0/0) or with an ECT-deficient liver (Pcyt2fl/fl, albumin-Cre+/0), thus providing both mutant mice and littermate controls (floxed) for the experiments. All experimental animals were identified at weaning by PCR-mediated genotyping of tail DNA and were used for experiments between 8 and 16 weeks of age. Animals of either sex exhibited the same phenotype, and thus both sexes were used for experiments. Blood chemistry analysis was performed with five mice per gender and genotype that were fasted overnight. Samples were analyzed by the Veterinary Pathology Core at St. Jude Children's Research Hospital. Weight monitoring of 6–10 mice per gender and genotype was started at 4 weeks of age and recorded weekly for 12 weeks up to age 16 weeks. All procedures were approved by the Animal Care and Use Committee of St. Jude Children's Research Hospital.
Hepatocyte Isolation
Hepatocytes were isolated using the liver perfusion procedure described by Mudra and Parkinson (31). Briefly, control and ECT-deficient mice were anesthetized with sodium pentobarbital, and their livers were perfused in situ through direct cannulation of the portal vein. All solutions were equilibrated at 37 °C before perfusion. Each liver was perfused at a speed of 7 ml/min first with 50 ml of Krebs-Ringer solution (4.8 mm KCl, 1.2 mm MgCl2, 1.2 mm KH2PO4, 120 mm NaCl, 24 mm NaHCO3, 5 mm Hepes, pH 7.4, and 20 mm glucose) containing 0.1 mm of EGTA and 1.05 mg of Liberase Blendzyme 3 (Roche Applied Science), followed by an additional 50 ml of Krebs-Ringer solution containing 1.4 mm of CaCl2 and 1.2 mg of Liberase Blendzyme 3. The livers were then gently removed and placed in 20 ml of ice-cold of Krebs-Ringer solution containing 1.4 mm CaCl2. Hepatocytes were dispersed by cutting through the liver capsule several times and filtered through a 70-μm cell strainer. The filtrate was then diluted to 30 ml with the same solution and centrifuged at 5000 × g for 2 min at 4 °C. This step was repeated twice. Genomic DNA was extracted from the hepatocytes using the REDExtract-N-Amp Tissue PCR kit (Sigma), following the manufacturer's instruction for mouse tails and tissue.
Metabolic Labeling
Isolated hepatocytes were cultured at a density of 106 per 60-mm dish in Williams' medium E (32) containing 5 μm glycerol plus [3H]glycerol (20 μCi/ml; specific activity 40 Ci/mmol) or l-[3-3H]serine (10 μCi/ml, specific activity 40 Ci/mmol) obtained from American Radiolabeled Chemicals. After incubation for the specified times, cells were washed with phosphate-buffered saline, scraped from the culture dishes, counted, and subjected to extraction according to the method of Bligh and Dyer (33). The amount of radiolabel incorporated into the organic phase was quantified by scintillation counting. An aliquot of each organic phase was spotted onto silica gel H thin layers (Analtech) that were developed in chloroform/methanol/acetic acid/water, 50:25:8:2 (v/v), for separation of the phospholipids or chloroform/methanol/acetic acid, 98:2:1 (v/v), for separation of the neutral lipids. PtdCho, PtdEtn, PtdSer, DAG, and TG were identified by co-migration with standards, and the corresponding areas of silica gel were scraped from the plates, and the fractional distribution of the lipids was determined by scintillation counting. Radiolabeled secreted lipids were quantified following extraction of the culture medium and thin layer chromatography of aliquots of the organic phase on silica gel H layers developed in chloroform/methanol/acetic acid, 98:2:1.
ECT Enzymatic Assay
The standard ECT assays contained the following: CTP (2 mm), Mg2Cl (10 mm), Tris-HCl (0.1 m), pH 8.0, phospho-[14C]Etn (50 μm; final specific activity 5 μCi/μmol), and soluble cell lysate (0–80 μg of protein) in a final volume of 50 μl. The reaction was started by the addition of protein and stopped by the addition of acetic acid. The CDP-[14C]Etn product was separated from substrate by thin layer chromatography on silica gel H layers developed with 2% ammonium hydroxide, 95% ethanol (1:1; v/v). The substrate (Rf = 0.4) and CDP-Etn product (Rf = 0.8) were visualized using a Bioscan AR2000 radiochromatography imaging scanner and the appropriate areas scraped from the plate and quantified by scintillation counting. Protein was determined using the Bradford method (34).
Lipid Class Quantitation
Lipids were extracted using a slight modification of the Bligh and Dyer method (33) that had been optimized for lipid quantitation by the LipidMaps group (35). We determined the amount of each major lipid class using flame ionization mass detection following thin layer chromatography with the Iatroscan instrument (Iatron, Inc.). Phospholipids were separated using chloroform/methanol/acetic acid/water (50:25:8:2; v/v), and neutral lipid classes were separated using hexane/ether/acetic acid (90:10:1; v/v) on high resolution glass rods coated with a thin layer of silica gel chromatography medium. PtdSer was quantified following fractionation by column chromatography as described below followed by thin layer chromatography using a solvent system of chloroform/methanol/ammonium hydroxide (60:35:0.9; v/v). The lipids were identified by co-migration with standards, and a standard curve was prepared for each lipid class and used, along with the dilution factor from the original sample, to determine the amount of each lipid class present in the sample.
The amount of DAG was quantified in liver extracts as described previously (36). Briefly, liver extracts obtained as described above or 1,2-dioleoyl-sn-glycerol standard solutions (Avanti, Alabaster, AL) were solubilized in octyl-β-d-glucoside/cardiolipin, and the DAG mass was determined by enzymatic assay in a reaction buffer containing 90 mm imidazole HCl, pH 6.6, 90 mm NaCl, 22 mm MgCl2, 1.8 mm EGTA, 4.5 mm dithiothreitol, 4 μg DAG kinase (Sigma), 1 mm ATP, and 0.02 μCi of [γ-32P]ATP (30 Ci/mmol) in a total volume of 24.5 μl. The samples were incubated at room temperature for 30 min. The reactions were stopped by the addition of 750 μl of chloroform/methanol (1:2; v/v) and 175 μl of 1% HClO4 and vigorous mixing. The [32P]phosphatidic acid product was extracted with 250 μl of chloroform and an equal volume of 1% HClO4. The upper layer was discarded, and the lower layer was washed twice with 500 μl of 1% HClO4. The lower layer was spotted onto a TLC plate developed in chloroform, methanol, acetic acid, 88% formic acid (65:27:7:3; v/v). The dried plate was exposed to a phosphor screen, and the phosphorylated product was quantified using ImageQuant 5.2 software.
Phospholipid Molecular Species Profiling
Phospholipid molecular species fingerprints were determined using direct-infusion electrospray ionization-mass spectrometry technology (35, 37). Mass spectrometry analysis was performed at the Hartwell Center for Bioinformatics and Biotechnology, St. Jude Children's Research Hospital, using a Finnigan™ TSQ® Quantum (Thermo Electron, San Jose, CA) triple quadrupole mass spectrometer equipped with the nanospray ion source. PtdCho or PtdEtn was dissolved in 50:50 (v/v) chloroform, methanol + 1% formic acid; PtdSer and PtdIns were dissolved in 50:50 chloroform/methanol; and TG was dissolved in 50:50 chloroform, methanol + 5 mm ammonium acetate. The instrument was operated in positive ion mode for PtdCho, PtdEtn, and TG and negative ion mode for PtdSer and PtdIns. Ion source parameters were as follows: spray voltage 1000 V, capillary temperature 270 °C, capillary offset 35 V, and tube lens offset was set by infusion of the polytyrosine tuning and calibration solution (Thermo Electron, San Jose, CA) in electrospray mode; PtdCho, scan range, 600–900 m/z; scan time, 0.3 s; product mass, 184.1 m/z; collision energy, 40 V; peak width, Q1 and Q3 0.7 full width at half-maximum (FWHM); and Q2 CID gas, 0.5 mT; PtdEtn, scan range, 600–900; m/z; scan time, 0.3 s; neutral loss mass, 141.0 m/z; collision energy, 30 V; peak width, Q1 and Q3 0.7 FWHM; and Q2 CID gas, 0.5 mT. Instrument control and data acquisition was performed using a Finnigan™ Xcalibur™ software (Thermo Electron, San Jose, CA). The molecular species composition of the TG pool was determined as described (37) following the removal of the phospholipids by column chromatography. TG scan range was 700–1000 m/z; scan time was 0.5 s; and peak width was Q1 0.7 FWHM.
PtdSer and PtdIns were profiled by mass spectrometry (38) following separation from the major phospholipids using a Discovery DSC-NH2 solid phase extraction column (Supelco, Bellefonte, PA) (39). In brief, the column was conditioned with 8 ml of hexane, and lipid extract was added. Nonpolar lipids were eluted with 6 ml of 2:1 (v/v) chloroform/isopropyl alcohol; fatty acids were eluted with 6 ml of ether, 2% acetic acid; PtdCho and PtdEtn were eluted with 6 ml of methanol; and PtdSer and PtdIns were eluted with 6 ml of chloroform, methanol, 0.8 m sodium acetate, 60:30:4.5 (v/v). For PtdSer, the scan range was 600–900 m/z, scan time 0.5 s, neutral loss mass 87.0 m/z, collision energy 25 V, peak width Q1 and Q3 0.7 FWHM, and Q2 CID, gas 0.5 mT. For PtdIns, the scan range was 600–1100 m/z, scan time 0.5 s, parent mass 241.0 m/z, collision energy 45 V, peak width Q1 and Q3 0.7 FWHM, and Q2 CID gas, 0.5 mT. Acquisition parameters for a neutral loss scan that was used to identify the fatty acyl groups that constitute a particular mass peak were as follows: scan range 600–900 m/z, scan time 0.5 s, collision energy 30 V, peak width Q1 and Q3 0.7 FWHM, and Q2 CID gas 0.5 mT. For the neutral loss mass, the following fatty acyl groups and m/z were used: 16:0, 256; 16:1, 254; 18:0, 284; 18:1, 282; 18:2, 280; 20:4, 304; and 22:6, 328.
Tissue Histology
Mouse tissues were analyzed using paraffin sections. Mice were anesthetized with isoflurane and perfused intracardially with 4% paraformaldehyde in 0.1 m phosphate-buffered saline. Liver tissue was dissected from the animal and incubated at 4 °C overnight in 10% formalin prior to dehydration in ethanol and embedding in paraffin. Paraffin sections were cut to 4 μm thickness. Sections were stained with hematoxylin and eosin. Sample preparation was performed in the Animal Diagnostic Lab and viewed with an Olympus BX41 microscope.
Electron Microscopy
After animal perfusion as described above, tissue samples were fixed in 2.5% glutaraldehyde in 0.1 m sodium cacodylate buffer (Tousimis, Rockville, MD). Following postfixation in 0.8% osmium tetroxide, 3% ferrocyanide, 0.1 m phosphate-buffered saline, the cells were stained en bloc with 2% aqueous uranyl acetate, followed by ethanol dehydration. The samples were embedded in Spurr's epoxy resin, and ultrathin sections (∼75 nm) from selected blocks were mounted on 1 × 2-mm grids and examined using a Philips CM10 electron microscope (FEI, Hillsboro, OR) at 50–80 kV. These tasks were performed by the St. Jude Imaging Shared Resource.
Quantification of mRNA
Total RNA was isolated from livers of 4–7 control and ECT-deficient mice of either sex using the TRIzol reagent (Invitrogen) according to the manufacturer's instructions. Pelleted RNA was resuspended in nuclease-free water, digested with DNase I to remove any contaminating genomic DNA, aliquoted, re-precipitated in ethanol, and stored at −20 °C. Synthesis of first-strand cDNA was obtained by reverse transcription using SuperScript™ II RNase H− reverse transcriptase, the RNA templates, and random primers. Quantitative real time PCR was performed in triplicate using the ABI Prism® 7700 Sequence detection system. The primers used are listed in supplemental Table S1. The reaction mixtures contained SYBR Green PCR Master Mix, 10 ng of cDNA, and 150 nm of the appropriate primers. Cyclophilin B mRNA was used as a control. All of the real time values were compared using the CT method.
Statistical Analysis
The two-tailed t test for significance between means was used to compare results between mouse groups. The statistical analysis package included in GraphPad Prism software was used to perform the calculations and graphical analysis.
RESULTS
Derivation of the Hepatocyte-specific ECT Knock-out Mouse Model
An adult knock-out mouse model lacking a functional CDP-Etn pathway in hepatocytes because of the specific deletion of the ECT gene (Pcyt2) was derived as outlined in Fig. 2A and detailed under “Experimental Procedures.” Control (floxed) mice lacked the Alb-Cre transgene (tail genotype = Pcyt2fl/fl/Alb-Cre0/0), and the mice with an ECT-deficient liver harbored the Alb-Cre transgene (tail genotype = Pcyt2fl/fl/Alb-Cre+/0). The selective inactivation of the Pcyt2 gene in liver was verified using multiplex PCR genotyping of liver and a selection of other tissue samples (Fig. 2, B and C). Only a single band of 406 bp arising from the F1-R1 primer pair was found in the livers from mice with the Pcyt2fl/fl/Alb-Cre0/0 tail genotype, showing the presence of only the floxed ECT gene. Livers from Pcyt2fl/fl/Alb-Cre+/0 mice contained primarily the 207 bp band arising from the F1-R2 primer pair that corresponded to the removal of exon-2 from the Pcyt2 gene (Fig. 2B). The presence of cell types other than hepatocytes accounted for some of the undeleted floxed allele detected in the ECT-deficient liver sample. Accordingly, genotyping of hepatocytes isolated from the ECT-deficient liver showed that Pcyt2 deletion was more efficient than in the total liver sample (Fig. 2B, lanes 5 and 6). These data showed that mice with the Pcyt2fl/fl/Alb-Cre+/0 tail genotype had efficiently deleted the Pcyt2 gene in the majority of hepatocytes.
Absence of Pcyt2 mRNA and ECT Activity in the Knock-out Liver
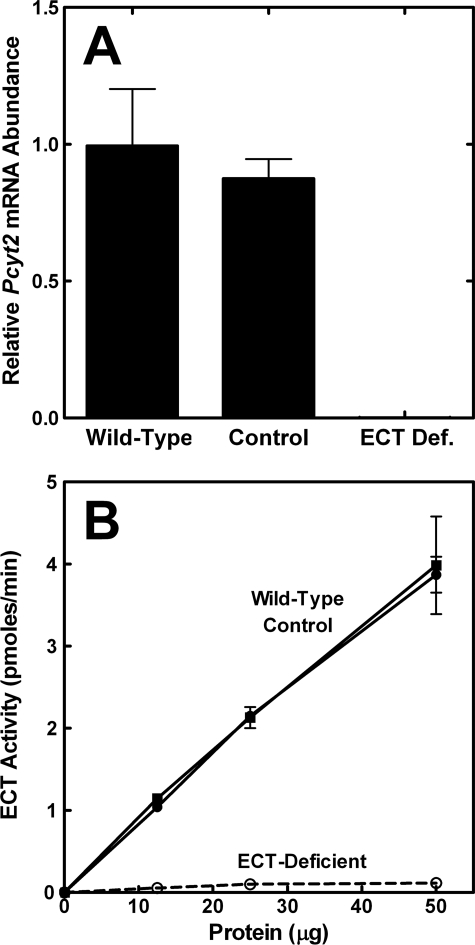
Two experiments were performed to verify that mice with a Pcyt2−/− genotype lacked Pcyt2 mRNA and ECT activity (Fig. 2). Expression of the floxed (active) allele in the control liver was the same as the Pcyt2 gene in wild-type liver (Fig. 3A). In contrast, ECT mRNA abundance in the ECT-deficient liver samples was >5,000 times lower than the ECT mRNA abundance in either the wild-type or floxed liver (Fig. 3A). The primer combination was designed to detect transcripts containing exon-2 to confirm the genotyping result and signal the level of functional Pcyt2 mRNA in the ECT-deficient liver. There was no difference in the ECT-specific activity in extracts prepared from livers of wild-type or control (floxed) mice, whereas the ECT activity was nearly abolished in the ECT-deficient liver extracts (Fig. 3B). This small residual activity arose in part from the nonhepatocyte cell lineages present in the intact liver extract (Fig. 2B). The splicing of exon-1 into exon-3 created a stop codon at the splice junction that terminated translation at amino acid 29 of the 560-amino acid ECT protein. There were also multiple downstream in-frame stop codons introduced by the deletion of exon-2 ensuring that functional ECT expression was abolished. These data confirmed that there was only a single gene that encoded a protein that can carry out the ECT reaction in mice.
FIGURE 3.
ECT mRNA and enzyme activity in ECT-deficient liver. A, ECT mRNA levels in livers from Pcyt2fl/fl/Alb-Cre0/0 (control), wild-type, and Pcyt2fl/fl/Alb-Cre+/0 tail genotypes were quantified by real time PCR (qRT-PCR). The qRT-PCR assay was designed to detect Pcyt2 transcripts containing exon 2, and the knock-out liver samples had <1:5,000 of control transcripts. Data are the average values from two males plus two females of each genotype, performed in triplicate. B, ECT enzymatic activity was measured as a function of protein concentration in liver cytosols prepared from wild-type (■), control (floxed) (●), and ECT-deficient mice (○). The data are the average ± S.D. of duplicate determinations from four mice (two males and two females) of each genotype.
General Features of the Mice
Mice with an ECT-deficient liver appeared outwardly unremarkable with normal activity and breeding behavior. Some general characteristics of the mice are listed in Table 1. Their body weights and rate of weight increase with age between 4 and 16 weeks were the same as the control animals (data not shown), and the data obtained at 8 and 12 weeks are shown in Table 1 as benchmarks. Serum glucose, cholesterol, and albumin levels were indistinguishable from the controls. There were also the same levels of aspartate and alanine aminotransferases in the serum, indicating the absence of cellular damage or inflammation in the liver. The sole notable finding was that the ECT-deficient mice had lower serum TG levels than the controls.
TABLE 1.
General characteristics of the ECT-deficient mice
The floxed mice had normal liver ECT activity, and the Pcyt2−/− mice had an ECT-deficient liver. Values represent means ± S.D., n = 5. Assays were performed as described under “Experimental Procedures.”
| Males |
Females |
|||
|---|---|---|---|---|
| Floxed | Pcyt2−/− | Floxed | Pcyt2−/− | |
| Characteristic | ||||
| Weight at 8 weeks, g | 22.7 ± 2.0 | 22.6 ± 3.5 | 19.3 ± 2.3 | 18.0 ± 1.6 |
| Weight at 12 weeks, g | 27.3 ± 2.1 | 28.6 ± 4.4 | 22.4 ± 1.9 | 21.1 ± 0.9 |
| Serum parameter | ||||
| Triglycerides, mg/dl | 146 ± 41 | 61 ± 5a | 106 ± 15 | 81 ± 19a |
| Cholesterol, mg/dl | 147 ± 12 | 148 ± 32 | 137 ± 9 | 114 ± 38 |
| Albumin, g/dl | 3.3 ± 0.2 | 3.5 ± 0.1 | 3.2 ± 0.1 | 3.4 ± 0.2 |
| AST,b units/liter | 342 ± 179 | 318 ± 118 | 225 ± 136 | 218 ± 110 |
| ALT,c units/liter | 78 ± 30 | 112 ± 41 | 65 ± 23 | 60 ± 12 |
ap < 0.05.
b AST means aspartate aminotransferase.
c ALT means alanine aminotransferase.
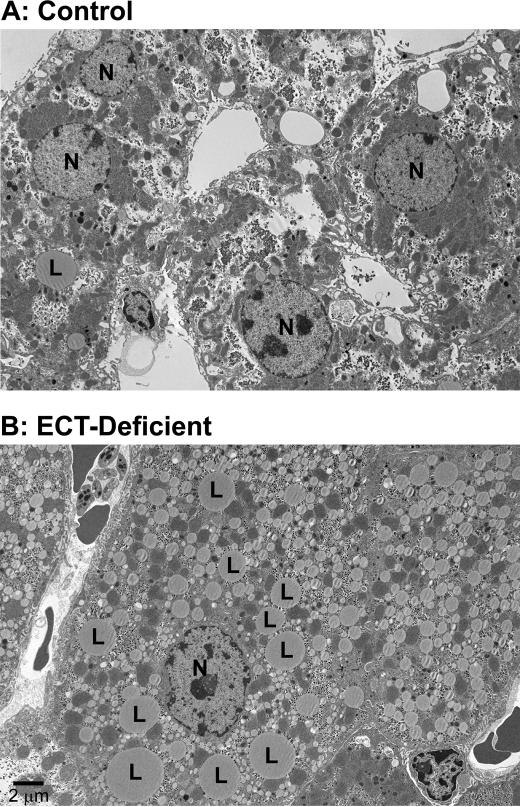
ECT-deficient liver was pale in appearance compared with the controls. Light microscopy showed hepatocytes filled with vacuoles using hematoxylin and eosin-stained sections, suggesting the presence of numerous lipid droplets in the ECT-deficient cells (data not shown). Electron microscopy clearly illustrated the accumulation of lipid droplets in the ECT-deficient hepatocytes (Fig. 4). These droplets were so abundant that they filled the cytosol and disrupted the normal intracellular organization of the hepatocyte.
FIGURE 4.
Transmission electron microscopy of ECT-deficient liver. A, control liver morphology. B, ECT-deficient liver with hepatocytes engorged with lipid droplets. L, lipid droplet; N, cell nucleus. Both livers were from female mice.
Dysregulation of Lipid Class Composition in the ECT-deficient Liver
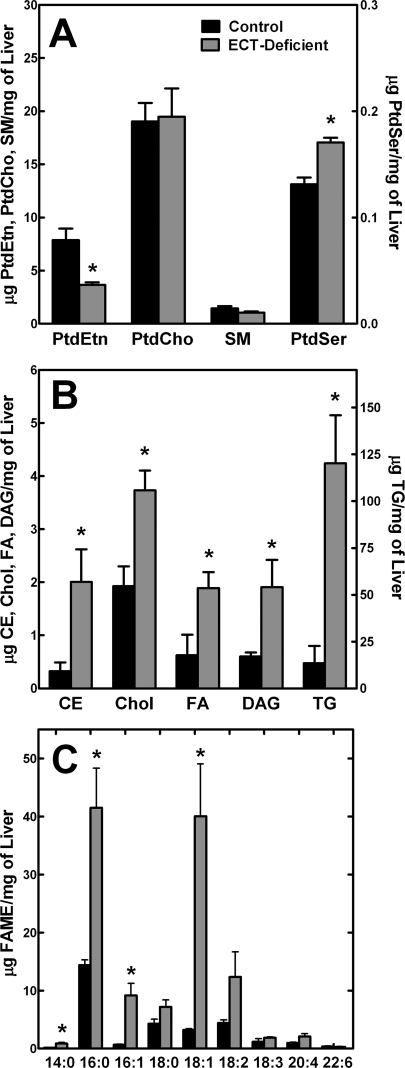
The ECT-deficient livers had an imbalance in the levels of the major hepatic lipid classes (Fig. 5). The content of PtdEtn in the ECT-deficient livers was 50% lower than was found in the control animals (Fig. 5A). There was no difference in the levels of PtdCho in the knock-out mice, and no significant change in sphingomyelin. PtdSer was a small percentage of the total phospholipid in both normal and ECT-deficient livers and increased about 25% in the ECT-deficient livers (Fig. 5A). All neutral lipid classes were elevated. Cholesterol, cholesterol ester, DAG, and free fatty acids were about 2-fold higher in the ECT-deficient liver compared with controls. The most notable lipid compositional feature was the 10-fold increase in TG in the ECT-deficient liver (Fig. 5B). These data indicated that the lipid droplets observed in the electron micrographs (Fig. 4B) were composed primarily of TG. The overall fatty acid composition was also quite different in the ECT-deficient liver (Fig. 5C). There were substantial increases in 16:0 and 18:1, which were indicative of an increased proportion of fatty acids derived from the de novo biosynthetic pathway in the ECT-deficient liver compared with the controls. Most of these fatty acids were found in TG, but there were also higher levels in the phospholipids altering the molecular species profiles (see below).
FIGURE 5.
Lipid composition of the ECT-deficient liver. A, amounts of the major phospholipid classes in control and ECT-deficient livers. SM, sphingomyelin. B, neutral lipid classes in control and ECT-deficient livers. Liver lipids were extracted, separated, and quantified as described under “Experimental Procedures.” Note the difference in scale for the TG dataset. The data are the average ± S.D. of triplicate determinations from 6 to 7 males for each genotype. CE, cholesterol ester; Chol, cholesterol; FA, fatty acid. C, total fatty acid composition of control and ECT-deficient livers. Hepatic lipids were extracted, converted to the respective fatty acid methyl esters (FAME), and analyzed by gas chromatography. The data are the average of three males per genotype ± S.D. Solid bars represent control (floxed) livers, and the gray bars represent ECT-deficient livers. *, p < 0.05.
Imbalances in Molecular Species Composition in the ECT-deficient Liver
Mass spectrometry was used to “fingerprint” the molecular species of the major phospholipids in control and ECT-deficient livers to determine whether the reliance on the PSD pathway for PtdEtn synthesis led to changes in the composition of the major phospholipid pools. Molecular species fingerprints were obtained from three mice in each group, and representative spectra are shown. The fatty acid composition for several of the major peaks are indicated in the figures based on the identification of the major fatty acids present at a particular mass as described under “Experimental Procedures,” coupled with the well established rule that saturated fatty acids are localized in the 1-position with unsaturated fatty acids occupying the 2-position. Although there may be minor isobaric species present at each of these masses, the major molecular species present at each major mass peak is noted on each of the figures to guide comparisons of the spectra.
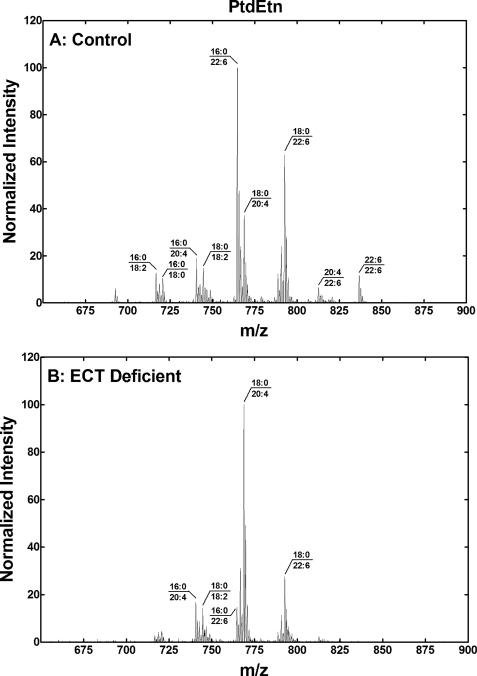
There was a very significant difference in the PtdEtn molecular species composition in the ECT-deficient liver (Fig. 6). (16:0–22:6)PtdEtn was the most abundant species in the control liver and was almost absent from the ECT-deficient liver. (18:0–20:4)PtdEtn was the predominant species in the ECT-deficient liver with lower amounts of 18:0/22:6-PtdEtn. Overall, the PtdEtn in the ECT-deficient liver was highly enriched in molecular species containing 18:0 paired with a polyunsaturated fatty acid and deficient in species containing 16:0 paired with a polyunsaturated fatty acid.
FIGURE 6.
PtdEtn, molecular species in the ECT-deficient liver. A, PtdEtn molecular species fingerprint of a typical control mouse liver. B, PtdEtn molecular species analysis of a typical ECT-deficient liver. The data are representative of duplicate analyses on three different male mice of each genotype. The identification of the primary phospholipid molecular species in each of the major peaks was based on the fatty acid composition, and the preponderance of saturated fatty acids in the 1-position and unsaturated fatty acids in the 2-position of hepatic phospholipids.
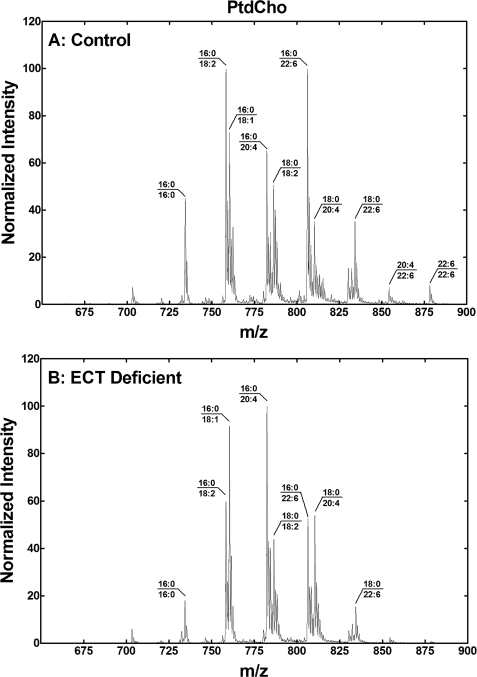
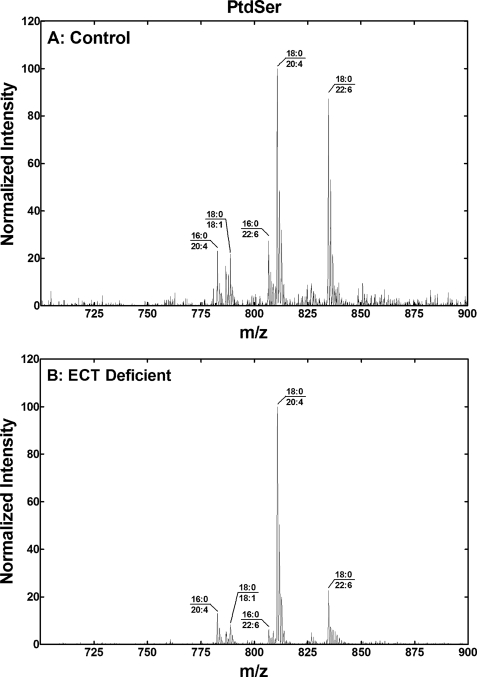
Although the changes in the PtdCho were less pronounced, there were differences noted in the PtdCho molecular species (Fig. 7). (16:0–18:2)PtdCho and (16:0–22:6)PtdCho were the most prevalent species in the control liver. There was a decrease in the abundance of PtdCho molecular species containing 22:6 in the ECT-deficient liver leading to (16:0/18:1)PtdCho and (16:0–20:4)PtdCho becoming the most abundant species in the ECT-deficient liver. PtdSer was dominated by (18:0–20:4)PtdSer and (18:0–22:6)PtdSer in both the control and ECT-deficient liver (Fig. 8). The notable differences were lower levels of molecular species with 16:0 and a significant decrease in (18:0–22:6)PtdSer. (18:0–20:4)PtdIns dominated the PtdIns molecular species, which were not different in the control and ECT-deficient liver (data not shown).
FIGURE 7.
PtdCho molecular species in the ECT-deficient liver. A, molecular species fingerprint of PtdCho from a typical control liver. B, PtdCho molecular species fingerprint from a typical ECT-deficient liver. Data are representative of duplicate analyses on three different male mice of each genotype. The identification of the primary phospholipid molecular species in each of the major peaks was based on the fatty acid composition and the preponderance of saturated fatty acids in the 1-position and unsaturated fatty acids in the 2-position of hepatic phospholipids.
FIGURE 8.
PtdSer molecular species in the ECT-deficient liver. A, molecular species fingerprint of PtdSer from a typical control liver. B, PtdSer molecular species fingerprint of PtdSer from a typical ECT-deficient liver. Data are representative of duplicate analyses on three different male mice of each genotype. The identification of the primary phospholipid molecular species in each of the major peaks was based on the fatty acid composition and the preponderance of saturated fatty acids in the 1-position and unsaturated fatty acids in the 2-position of hepatic phospholipids.
Expression of Compensating Pathway Genes in ECT-deficient Liver
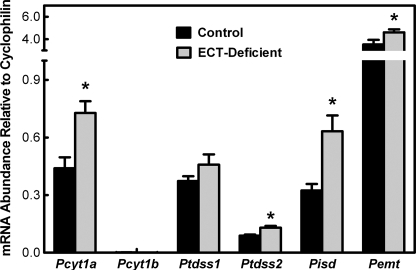
The PtdEtn produced in the ECT-deficient liver arises exclusively from the PSS1/PSD pathway (Fig. 1), whereas in normal liver, the ECT pathway produces the bulk of the PtdEtn. The mRNA abundance for each of the genes involved in PtdEtn homeostasis was quantified to determine whether the transcript levels of the genes changed in response to the inactivation of the ECT pathway (Fig. 9). The data in the wild-type liver samples provided an overview of the relative transcript abundance in the normal genotype. Pcyt1a, Ptdss1, and Pisd mRNA levels were about the same in the control mice, whereas Ptdss2 was lower and Pemt significantly higher than the other three. Pcyt1b, encoding CCTβ, was the least abundant mRNA in normal liver. Overall, the relative abundance of mRNA derived from the genes was the same in the ECT-deficient liver. The level of Pisd (PSD) mRNA increased ∼2-fold in the ECT-deficient liver, whereas PSS1 expression did not change significantly. These data are consistent with the roles for these two gene products in the PSD pathway. PSS1 catalyzes the readily reversible headgroup exchange reaction, and PSD catalyzes an irreversible decarboxylation that pulls the pathway toward PtdEtn formation.
FIGURE 9.
Expression of phospholipid biosynthetic genes in the ECT-deficient liver. The mRNA abundance for each indicated phospholipid biosynthetic gene was determined by qRT-PCR as described under “Experimental Procedures.” Solid bars represent control (floxed) livers, and the gray bars represent ECT-deficient livers. The data are the average ± S.D. of triplicate determinations from four mice (two males and two females) of each genotype. *, p < 0.05.
Glycerolipid Synthesis in ECT- deficient Hepatocytes
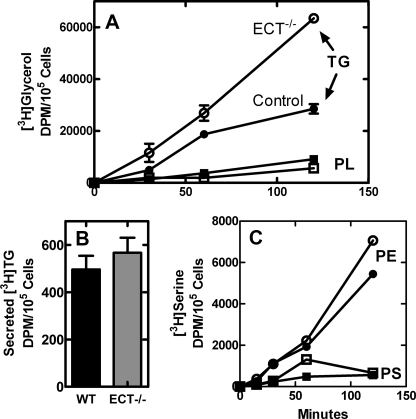
Hepatocytes were isolated from control and ECT-deficient liver and labeled with either [3H]glycerol or [3H]serine to examine the effect of ablating the ECT pathway on phospholipid and TG synthesis in vitro (Fig. 10). ECT-deficient hepatocytes incorporated a similar amount of [3H]glycerol into the phospholipid fraction but were more active in the formation of TG than their normal counterparts (Fig. 10A). ECT-deficient and control hepatocytes secreted the same amount of [3H]TG into the medium (Fig. 10B). Metabolic labeling experiments with [3H]serine showed that the ECT-deficient hepatocytes formed PtdSer at a similar rate as the control cells and were more active than the control cells in producing PtdEtn via the PSD pathway (Fig. 10C). Although the isolated hepatocyte system was not a perfect model for investigating the in vivo regulation of these pathways, the metabolic labeling data were consistent with increased lipogenesis as a primary cause for the accumulation of TG in the ECT-deficient liver.
FIGURE 10.
Rates of lipid synthesis in control and ECT-deficient hepatocytes. A, metabolic labeling of ECT-deficient and control hepatocytes with [3H]glycerol. The amounts of glycerol incorporated into the TG and phospholipid (PL) fractions were determined following extraction and thin layer chromatography as described under “Experimental Procedures.” ●, control TG; ○, ECT-deficient TG; ■, control phospholipid (PL); □, ECT-deficient phospholipid. The data are representative of two independent experiments. B, [3H]TG secretion. The amount of [3H]glycerol-labeled TG recovered in the medium from control and ECT-deficient hepatocytes after 2 h. WT, wild type. C, metabolic labeling of control and ECT-deficient hepatocytes with [3H]serine. ●, control PtdEtn; ○, ECT-deficient PtdEtn; ■, control PtdSer; □, ECT-deficient PtdSer.
Lipogenic Gene Transcription in the ECT-deficient Liver
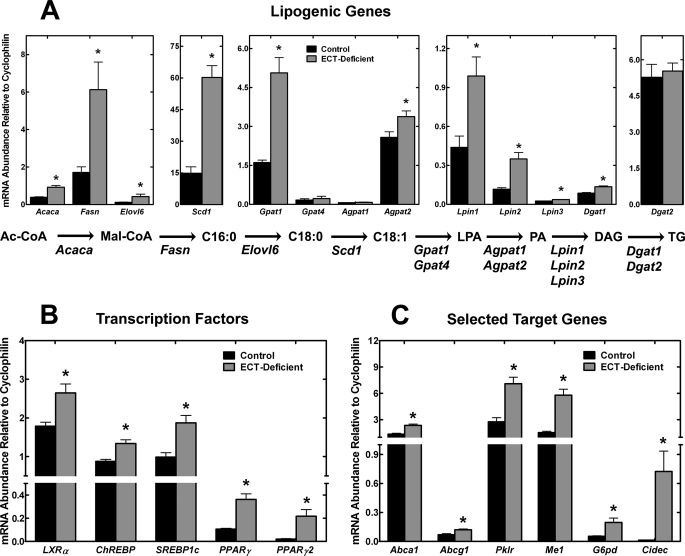
One potential explanation for the increase in TG in the ECT-deficient liver was the up-regulation of lipogenesis. The excess DAG formed because of reduced utilization by the ECT pathway would require additional acyl-CoA to be produced to convert the DAG to TG. Quantification of the transcript levels for the key genes in the TG biosynthetic pathway showed that most were significantly elevated in the ECT-deficient liver (Fig. 11A). In particular, Fasn, Scd1, and Gpat1 were the most substantially increased. The only genes whose expression did not increase were Gpat4, Agpat1, and Dgat2. This pattern reflected the gene expression changes commonly associated with increased hepatic lipogenesis. There are several transcription factors that regulate the expression of Fasn, Scd1, etc. as part of their mechanism of action. A survey of the expression levels of the genes for these factors showed that LXRα, ChREBP, SREBP1c, and PPARγ mRNA were all significantly more abundant in the ECT-deficient liver (Fig. 11B). Among these, SREBP1c appeared particularly relevant in light of the strong induction of its target genes like Fasn, Scd1, and Gpat1 (Fig. 11A) (40). The mRNA levels of Abca1 and Abcg1 were increased (Fig. 11C) illustrating that increased LXRα expression translated into induction of two LXRα-specific target genes. Likewise, a specific target gene for ChREBP, Pklr, was up-regulated (Fig. 11C) indicating elevated transcriptional activity of ChREBP. Most notable was the 10-fold increase in the expression of PPARγ2 (Fig. 11B) and the 60-fold induction of its specific target Cidec (also called Fsp27) (Fig. 11C). Together, these data illustrate that a significant up-regulation of genes that promote hepatic lipogenesis underlies the increased TG synthesis and TG accumulation in the ECT-deficient liver.
FIGURE 11.
Increased transcription of lipogenic genes in ECT-deficient livers. A, transcription of genes involved in the conversion of acetyl-CoA to triglycerides was significantly increased in the ECT-deficient livers. B, increase in lipogenic gene transcription correlated with a significant increase in the mRNA levels of all major transcription factors known to regulate lipogenesis, LXRα, ChREBP, SREBP1c, and PPARγ. C, additional target genes of the transcription factors shown in B were also significantly up-regulated in the ECT-deficient livers. The data are the average ± S.D. of triplicate determinations from 4 to 7 mice (males and females) of each genotype. *, p < 0.05. Acaca, acetyl-CoA carboxylase α; Fasn, fatty-acid synthase; Elovl6, long chain fatty-acid elongase 6; Scd1, stearoyl-CoA desaturase 1; Gpat1 and 4, glycerol-3-phosphate acyltransferase 1 and 4; Agpat1 and -2, 1-acylglycerol-3-phosphate O-acyltransferase 1 and 2; Lpin1, -2, and -3, Lipin 1, 2, and 3; Dgat1 and -2, diacylglycerol O-acyltransferase 1 and 2; Abca1, ATP-binding cassette transporter A1; Abcg1, ATP-binding cassette transporter G1; Pklr, pyruvate kinase liver and red blood cells; Me1, malic enzyme 1; G6pd, glucose-6-phosphate dehydrogenase; Cidec, fat-specific protein 27.
DISCUSSION
A primary finding of the study is that the efficient deletion of ECT in the liver does not prevent the proliferation, differentiation, or survival of hepatocytes. The ECT pathway is a major route for the formation of PtdEtn, and the embryonic lethality of the Pcyt2 knock-out mice (20) suggested that principal organs may not develop without a functional CDP-Etn pathway. However, the alternate PSD pathway is capable of producing sufficient PtdEtn to allow the development of the liver, and potentially other tissues as well. The mice with an ECT-deficient liver are outwardly normal without overt indications of liver injury or inflammation. However, the absence of PtdEtn biosynthesis via ECT severely disrupts hepatic lipid homeostasis.
Notable metabolic phenotypes in the ECT-deficient liver are a 50% decrease in PtdEtn and a 10-fold increase in TG. In contrast, disruption of the CDP-choline pathway for PtdCho biosynthesis (Fig. 1) by hepatocyte-specific deletion of CCTα resulted in 25% less PtdCho and a 2-fold increase in TG (6, 41). The hypertriglyceridemia is clearly more severe in the ECT-deficient livers. This may be due to the CDP-Cho pathway still operating at about 15–20% efficiency in the CCTα-deficient liver due to the increased expression of CCTβ (6). Thus, both knock-out mouse models reduce the utilization of DAG for phospholipid synthesis at the endoplasmic reticulum, and consistent with the findings in cultured cells (42), DAG is re-directed to TG synthesis. The CCTα-deficient liver is also defective in the secretion of PtdCho-containing lipoproteins, which is thought to contribute to the accumulation of TG in this model (6, 41). The secretion defect in CCTα-deficient liver involves both the release of cholesterol-containing high density lipoprotein as well as TG-rich VLDL. Unlike the CCTα-deficient mice, ECT-deficient animals have normal serum cholesterol but lower fasting serum TG, suggesting that reduced secretion may contribute to TG accumulation in this model also. Although the dependence of lipoprotein secretion on PtdCho synthesis via the CCT and PEMT pathways is established, the mechanism is not well understood. A plausible idea is that there is a requirement for the de novo synthesis of PtdCho at the site of apolipoprotein assembly/secretion (43), which is supported by the finding that CCT activity is essential for cytokine secretion from macrophages and surfactant phospholipid secretion from lung type II cells (44, 45). Agren et al. (46) reported an enrichment of PtdEtn in newly secreted and nascent Golgi-derived VLDL and suggested a role for PtdEtn in the assembly and secretion of VLDL. Thus, syntheses of both PtdEtn and PtdCho via their respective cytidine diphosphonucleotide pathways may be necessary for the normal control of plasma lipoprotein composition.
The accumulation of TG in the ECT-deficient liver was strongly associated with up-regulation of the transcription factors and target genes that activate de novo lipogenesis. This effect is reminiscent of the increased lipogenic gene expression observed in Drosophila cells lacking the CDP-Etn pathway, which is attributed to the activation of fly SREBP (47). SREBP1c target genes are also strongly up-regulated in the ECT-deficient liver. In addition to SREBP-1c, the transcript levels of two other transcriptional regulators, LXRα (48) and ChREBP (49, 50), that support lipogenesis are also elevated. A significant increase in the mRNA levels of the targets confirms the increased activities of the respective transcription factors. Most striking is the activated transcription of PPARγ2 (10-fold) and a primary target gene in liver, Cidec (60-fold). PPARγ belongs to the nuclear receptor superfamily that is most well known for its role in the regulation of genes required for adipocyte differentiation (51, 52). Cidec (also called Fsp27) is a lipid droplet-associated protein that enhances TG accumulation when ectopically expressed (53, 54), and knocking down Cidec transcription in ob/ob mouse liver results in a lower level of TG accumulation (55). Elevated PPARγ2 expression promotes steatosis in several models of fatty liver disease (56, 57), and it is thought that PPARγ2 expression protects against lipotoxicity by facilitating the storage of excess lipid as relatively harmless lipid droplets (58). Thus, it is tempting to speculate that the large increase in PPARγ2 gene expression and transcriptional activation of Cidec underlies the accumulation of TG in the ECT-deficient liver, although the number and complexity of the transcriptional responses makes it difficult to determine whether increased PPARγ expression is the precipitating event for TG accumulation in the ECT-deficient liver.
Another important conclusion is that the substrate specificity of PSS1 controls the molecular species composition of PtdSer and the PtdEtn derived from this pathway. The analysis of the perturbations in the phospholipid molecular species arising from the inactivation of ECT in the metabolic network illustrated in Fig. 1 supports this conclusion. PtdSer is derived from PtdCho via the PSS1 base-exchange reaction, and the substrate specificity of PSS1 is revealed by the comparison of the PtdCho and PtdSer molecular species. PtdSer is dominated by molecular species containing 18:0 paired with either 20:4 or 22:6 (Fig. 8A), which are not the most abundant molecules in the PtdCho pool (Fig. 7A). PSS1 selectively recognizes both 18:0 and the polyunsaturated fatty acid because neither the (16:0–22:6)PtdCho nor the (18:0–18:2)PtdCho is efficiently converted to PtdSer. The ratio of (18:0–20:4):(18:0–22:6) species in the PtdCho changed from 1.6 ± 0.4 to 5.4 ± 1.0 comparing the control to the ECT-deficient livers, and the ratios in PtdSer changed from 1.2 ± 0.3 to 6.4 ± 1.6. These data illustrate that the abundance of the 18:0–20:4/22:6 molecular species in PtdSer reflects its abundance in PtdCho precursor pool. The PtdEtn in the ECT-deficient liver reflects the composition of the PtdSer pool (compare Fig. 6B and Fig. 8B), supporting the conclusion that the PSS1/PSD pathway is the primary source for PtdEtn in the ECT-deficient liver. The overall molecular species composition of PtdCho and PtdEtn is quite different in cultured cells because of the reliance of rapidly dividing cells on de novo fatty acid biosynthesis and a deficiency in polyunsaturated fatty acids in culture media. For example, the ratio of (16:0–18:1)PtdCho:(16:0–20:4)PtdCho in cells is about 200 (59), whereas it is close to 1 in the animal (Fig. 8A). Nonetheless, the selectivity of the PSD pathway for molecular species containing 18:0 paired with a polyunsaturated fatty acid is also observed in cultured cells (59). The idea that PSD substrate specificity underlies the selective synthesis of PtdEtn via the PSD pathway arose from examining the substrate specificity of PSD for the polyunsaturated fatty acids in the 2-position in vitro (59–61). However, the close correlation between the molecular species composition of PtdEtn and PtdSer in the ECT-deficient liver illustrates that PSS1 substrate specificity selects molecular species of PtdSer from the more diverse PtdCho pool, and then PSD nonselectively converts them to PtdEtn. In summary, the ECT pathway produces PtdEtn molecular species with 16:0 paired with 18:1, 18:2, or a polyunsaturated fatty acid and 18:0 paired with 18:1 or 18:2, whereas the PSD pathway is responsible for the molecules with 18:0 paired with a polyunsaturated fatty acid.
The similarity of the PtdEtn and PtdSer molecular species in the ECT-deficient liver illustrates that there is no acyl chain remodeling of PtdEtn. This conclusion is at odds with the general idea that glycerolipids synthesized from glycerol 3-phosphate via the CCT or ECT pathways subsequently undergo maturation through extensive remodeling (for reviews see Refs. 62, 63). Extensive fatty acid remodeling in PtdEtn at both the 1- and 2-positions is thought to occur in liver based on a pulse-chase mass spectrometry study using labeled glycerol (64). This conclusion was based on the increasing abundance of labeled PtdEtn molecular species with 18:0 at the 1-position and 20:4 or 22:6 at the 2-position during the chase. However, these authors did not consider the operation of the PSD pathway in their analysis, and our data suggest a different interpretation. The appearance of glycerol-labeled 18:0/22:4 and 18:0/22:6 molecular species following the pulse is not because of the deacylation/reacylation of PtdEtn, but rather to the arrival of these molecular species from the labeled PtdCho pool via the PSD pathway during the chase. Our experiments reflect the steady state distribution of molecular species, so we cannot determine whether there is removal of fatty acids from PtdEtn followed by replacement with the same fatty acid. However, we can conclude that there is no significant remodeling of the overall PtdEtn molecular species composition in liver following its synthesis via the PSD pathway.
While this manuscript was under review, the characterization of the physiology of heterozygous Pcyt2+/− mice was reported by Fullerton et al. (65). The livers of these heterozygous animals exhibit a similar but much less severe phenotype compared with the liver-specific Pcyt2−/− knock-out in that they progressively accumulate TG associated with stimulated de novo lipogenesis. The effect on TG accumulation and lipogenic gene transcription in the heterozygous mice is significantly less pronounced than in the Pcyt2−/− livers and only becomes apparent in older animals. The heterozygous mice have increased serum TG, whereas our animals do not; however, the heterozygous animals exhibit their most noticeable phenotypes (elevated weight, impaired glucose tolerance, etc.) at 36 weeks of age, and we do not have any information on older mice with an ECT-deficient liver. Further work will be required to determine whether the phenotypes associated with older heterozygous mice relate primarily to an ECT deficiency in the liver, or whether a deficiency in the ECT pathway in other tissues plays an important role in the whole animal phenotypes noted in the heterozygous mice.
Supplementary Material
Acknowledgments
We thank Karen Miller, Lois Richmond, Jina Wang, Caroline Pate, the Transgenic Mouse Core, and the Hartwell Center for Bioinformatics and Biotechnology for their expert technical assistance.
This work was supported, in whole or in part, by National Institutes of Health CORE Support Grant CA21765. This work was also supported by the American Lebanese Syrian Associated Charities.

The on-line version of this article (available at http://www.jbc.org) contains supplemental Table S1 and additional references.
- PtdEtn
- phosphatidylethanolamine
- ECT
- phosphoethanolamine cytidylyltransferase
- CCT
- phosphocholine cytidylyltransferase
- Etn
- ethanolamine
- PtdCho
- phosphatidylcholine
- PtdSer
- phosphatidylserine
- PtdIns
- phosphatidylinositol
- TG
- triacylglycerol
- DAG
- diacylglycerol
- PSS
- PtdSer synthase
- PSD
- PtdSer decarboxylase
- PEMT
- PtdEtn N-methyltransferase
- Cho
- choline
- qRT
- quantitative real time
- mT
- millitorr
- LXR
- liver X receptor
- PPARγ
- peroxisome proliferator-activated receptor-γ
- VLDL
- very low density lipoprotein
- FWHM
- full width at half-maximum.
REFERENCES
- 1.Bakovic M., Fullerton M. D., Michel V. (2007) Biochem. Cell Biol. 85, 283–300 [DOI] [PubMed] [Google Scholar]
- 2.Vance J. E. (2008) J. Lipid Res. 49, 1377–1387 [DOI] [PubMed] [Google Scholar]
- 3.Nagan N., Zoeller R. A. (2001) Prog. Lipid Res. 40, 199–229 [DOI] [PubMed] [Google Scholar]
- 4.Gorgas K., Teigler A., Komljenovic D., Just W. W. (2006) Biochim. Biophys. Acta 1763, 1511–1526 [DOI] [PubMed] [Google Scholar]
- 5.Jackowski S., Rehg J. E., Zhang Y. M., Wang J., Miller K., Jackson P., Karim M. A. (2004) Mol. Cell. Biol. 24, 4720–4733 [DOI] [PMC free article] [PubMed] [Google Scholar]
- 6.Jacobs R. L., Devlin C., Tabas I., Vance D. E. (2004) J. Biol. Chem. 279, 47402–47410 [DOI] [PubMed] [Google Scholar]
- 7.Walkey C. J., Yu L., Agellon L. B., Vance D. E. (1998) J. Biol. Chem. 273, 27043–27046 [DOI] [PubMed] [Google Scholar]
- 8.Hunt M. C., Alexson S. E. (1999) Biochem. Soc. Trans. 27, 378–382 [DOI] [PubMed] [Google Scholar]
- 9.Sundler R., Akesson B., Nilsson A. (1974) FEBS Lett. 43, 303–307 [DOI] [PubMed] [Google Scholar]
- 10.Sundler R. (1973) Biochim. Biophys. Acta 306, 218–226 [DOI] [PubMed] [Google Scholar]
- 11.Lykidis A., Wang J., Karim M. A., Jackowski S. (2001) J. Biol. Chem. 276, 2174–2179 [DOI] [PubMed] [Google Scholar]
- 12.Nakashima A., Hosaka K., Nikawa J. (1997) J. Biol. Chem. 272, 9567–9572 [DOI] [PubMed] [Google Scholar]
- 13.Bladergroen B. A., Houweling M., Geelen M. J., van Golde L. M. (1999) Biochem. J. 343, 107–114 [PMC free article] [PubMed] [Google Scholar]
- 14.Poloumienko A., Coté A., Quee A. T., Zhu L., Bakovic M. (2004) Gene 325, 145–155 [DOI] [PubMed] [Google Scholar]
- 15.Tie A., Bakovic M. (2007) J. Lipid Res. 48, 2172–2181 [DOI] [PubMed] [Google Scholar]
- 16.Henneberry A. L., McMaster C. R. (1999) Biochem. J. 339, 291–298 [PMC free article] [PubMed] [Google Scholar]
- 17.Horibata Y., Hirabayashi Y. (2007) J. Lipid Res. 48, 503–508 [DOI] [PubMed] [Google Scholar]
- 18.Zhu L., Johnson C., Bakovic M. (2008) J. Lipid Res. 49, 2197–2211 [DOI] [PubMed] [Google Scholar]
- 19.Sasaki H., Kume H., Nemoto A., Narisawa S., Takahashi N. (1997) Proc. Natl. Acad. Sci. U.S.A. 94, 7320–7325 [DOI] [PMC free article] [PubMed] [Google Scholar]
- 20.Fullerton M. D., Hakimuddin F., Bakovic M. (2007) Mol. Cell. Biol. 27, 3327–3336 [DOI] [PMC free article] [PubMed] [Google Scholar]
- 21.Voelker D. R. (2003) J. Lipid Res. 44, 441–449 [DOI] [PubMed] [Google Scholar]
- 22.Steenbergen R., Nanowski T. S., Beigneux A., Kulinski A., Young S. G., Vance J. E. (2005) J. Biol. Chem. 280, 40032–40040 [DOI] [PMC free article] [PubMed] [Google Scholar]
- 23.Voelker D. R. (1984) Proc. Natl. Acad. Sci. U.S.A. 81, 2669–2673 [DOI] [PMC free article] [PubMed] [Google Scholar]
- 24.Kuge O., Hasegawa K., Saito K., Nishijima M. (1998) Proc. Natl. Acad. Sci. U.S.A. 95, 4199–4203 [DOI] [PMC free article] [PubMed] [Google Scholar]
- 25.Saito K., Nishijima M., Kuge O. (1998) J. Biol. Chem. 273, 17199–17205 [DOI] [PubMed] [Google Scholar]
- 26.Kuge O., Saito K., Nishijima M. (1999) J. Biol. Chem. 274, 23844–23849 [DOI] [PubMed] [Google Scholar]
- 27.Goldberg D. M., Roomi M. W., Yu A., Roncari D. A. (1981) Biochem. J. 196, 337–346 [DOI] [PMC free article] [PubMed] [Google Scholar]
- 28.Arikketh D., Nelson R., Vance J. E. (2008) J. Biol. Chem. 283, 12888–12897 [DOI] [PubMed] [Google Scholar]
- 29.Bergo M. O., Gavino B. J., Steenbergen R., Sturbois B., Parlow A. F., Sanan D. A., Skarnes W. C., Vance J. E., Young S. G. (2002) J. Biol. Chem. 277, 47701–47708 [DOI] [PubMed] [Google Scholar]
- 30.Postic C., Shiota M., Niswender K. D., Jetton T. L., Chen Y., Moates J. M., Shelton K. D., Lindner J., Cherrington A. D., Magnuson M. A. (1999) J. Biol. Chem. 274, 305–315 [DOI] [PubMed] [Google Scholar]
- 31.Mudra D. R., Parkinson A. (2001) Current Protocols in Toxicology, pp. 8:14.2.1–14.2.13, John Wiley & Sons, Inc., New York: [DOI] [PubMed] [Google Scholar]
- 32.Abu-Elheiga L., Oh W., Kordari P., Wakil S. J. (2003) Proc. Natl. Acad. Sci. U.S.A. 100, 10207–10212 [DOI] [PMC free article] [PubMed] [Google Scholar]
- 33.Bligh E. G., Dyer W. J. (1959) Can. J. Biochem. Physiol. 37, 911–917 [DOI] [PubMed] [Google Scholar]
- 34.Bradford M. M. (1976) Anal. Biochem. 72, 248–254 [DOI] [PubMed] [Google Scholar]
- 35.Ivanova P. T., Milne S. B., Byrne M. O., Xiang Y., Brown H. A. (2007) Methods Enzymol. 432, 21–57 [DOI] [PubMed] [Google Scholar]
- 36.Preiss J. E., Loomis C. R., Bell R. M., Niedel J. E. (1987) Methods Enzymol. 141, 294–300 [DOI] [PubMed] [Google Scholar]
- 37.Krank J., Murphy R. C., Barkley R. M., Duchoslav E., McAnoy A. (2007) Methods Enzymol. 432, 1–20 [DOI] [PubMed] [Google Scholar]
- 38.Alvarez J. G., Touchstone J. C. (1992) J. Chromatogr. 577, 142–145 [DOI] [PubMed] [Google Scholar]
- 39.Brügger B., Erben G., Sandhoff R., Wieland F. T., Lehmann W. D. (1997) Proc. Natl. Acad. Sci. U.S.A. 94, 2339–2344 [DOI] [PMC free article] [PubMed] [Google Scholar]
- 40.Takeuchi K., Reue K. (2009) Am. J. Physiol. Endocrinol. Metab. 296, E1195–E1209 [DOI] [PMC free article] [PubMed] [Google Scholar]
- 41.Jacobs R. L., Lingrell S., Zhao Y., Francis G. A., Vance D. E. (2008) J. Biol. Chem. 283, 2147–2155 [DOI] [PubMed] [Google Scholar]
- 42.Jackowski S., Wang J., Baburina I. (2000) Biochim. Biophys. Acta 1483, 301–315 [DOI] [PubMed] [Google Scholar]
- 43.Vance D. E. (2008) Curr. Opin. Lipidol. 19, 229–234 [DOI] [PubMed] [Google Scholar]
- 44.Tian Y., Zhou R., Rehg J. E., Jackowski S. (2007) Mol. Cell. Biol. 27, 975–982 [DOI] [PMC free article] [PubMed] [Google Scholar]
- 45.Tian Y., Pate C., Andreolotti A., Wang L., Tuomanen E., Boyd K., Claro E., Jackowski S. (2008) J. Cell Biol. 181, 945–957 [DOI] [PMC free article] [PubMed] [Google Scholar]
- 46.Agren J. J., Kurvinen J. P., Kuksis A. (2005) Biochim. Biophys. Acta 1734, 34–43 [DOI] [PubMed] [Google Scholar]
- 47.Dobrosotskaya I. Y., Seegmiller A. C., Brown M. S., Goldstein J. L., Rawson R. B. (2002) Science 296, 879–883 [DOI] [PubMed] [Google Scholar]
- 48.Joseph S. B., Laffitte B. A., Patel P. H., Watson M. A., Matsukuma K. E., Walczak R., Collins J. L., Osborne T. F., Tontonoz P. (2002) J. Biol. Chem. 277, 11019–11025 [DOI] [PubMed] [Google Scholar]
- 49.Denechaud P. D., Bossard P., Lobaccaro J. M., Millatt L., Staels B., Girard J., Postic C. (2008) J. Clin. Invest. 118, 956–964 [DOI] [PMC free article] [PubMed] [Google Scholar]
- 50.Uyeda K., Repa J. J. (2006) Cell Metab. 4, 107–110 [DOI] [PubMed] [Google Scholar]
- 51.Rosen E. D., Sarraf P., Troy A. E., Bradwin G., Moore K., Milstone D. S., Spiegelman B. M., Mortensen R. M. (1999) Mol. Cell 4, 611–617 [DOI] [PubMed] [Google Scholar]
- 52.Rosen E. D., Hsu C. H., Wang X., Sakai S., Freeman M. W., Gonzalez F. J., Spiegelman B. M. (2002) Genes Dev. 16, 22–26 [DOI] [PMC free article] [PubMed] [Google Scholar]
- 53.Keller P., Petrie J. T., De Rose P., Gerin I., Wright W. S., Chiang S. H., Nielsen A. R., Fischer C. P., Pedersen B. K., MacDougald O. A. (2008) J. Biol. Chem. 283, 14355–14365 [DOI] [PMC free article] [PubMed] [Google Scholar]
- 54.Puri V., Konda S., Ranjit S., Aouadi M., Chawla A., Chouinard M., Chakladar A., Czech M. P. (2007) J. Biol. Chem. 282, 34213–34218 [DOI] [PubMed] [Google Scholar]
- 55.Matsusue K., Kusakabe T., Noguchi T., Takiguchi S., Suzuki T., Yamano S., Gonzalez F. J. (2008) Cell Metab. 7, 302–311 [DOI] [PMC free article] [PubMed] [Google Scholar]
- 56.Schadinger S. E., Bucher N. L., Schreiber B. M., Farmer S. R. (2005) Am. J. Physiol. Endocrinol. Metab. 288, E1195–E1205 [DOI] [PubMed] [Google Scholar]
- 57.Zhang Y. L., Hernandez-Ono A., Siri P., Weisberg S., Conlon D., Graham M. J., Crooke R. M., Huang L. S., Ginsberg H. N. (2006) J. Biol. Chem. 281, 37603–37615 [DOI] [PubMed] [Google Scholar]
- 58.Medina-Gomez G., Gray S. L., Yetukuri L., Shimomura K., Virtue S., Campbell M., Curtis R. K., Jimenez-Linan M., Blount M., Yeo G. S., Lopez M., Seppänen-Laakso T., Ashcroft F. M., Oresic M., Vidal-Puig A. (2007) PLoS. Genet. 3, e64. [DOI] [PMC free article] [PubMed] [Google Scholar]
- 59.Bleijerveld O. B., Brouwers J. F., Vaandrager A. B., Helms J. B., Houweling M. (2007) J. Biol. Chem. 282, 28362–28372 [DOI] [PubMed] [Google Scholar]
- 60.Demant E. J., Op Den Kamp J. A. (1982) Arch. Biochem. Biophys. 213, 186–192 [DOI] [PubMed] [Google Scholar]
- 61.Kevala J. H., Kim H. Y. (2001) Anal. Biochem. 292, 130–138 [DOI] [PubMed] [Google Scholar]
- 62.Shindou H., Hishikawa D., Harayama T., Yuki K., Shimizu T. (2009) J. Lipid Res. 50, (suppl.) S46–S51 [DOI] [PMC free article] [PubMed] [Google Scholar]
- 63.Shindou H., Shimizu T. (2009) J. Biol. Chem. 284, 1–5 [DOI] [PubMed] [Google Scholar]
- 64.Schmid P. C., Deli E., Schmid H. H. (1995) Arch. Biochem. Biophys. 319, 168–176 [DOI] [PubMed] [Google Scholar]
- 65.Fullerton M. D., Hakimuddin F., Bonen A., Bakovic M. (2009) J. Biol. Chem. 284, 25704–25713 [DOI] [PMC free article] [PubMed] [Google Scholar]
Associated Data
This section collects any data citations, data availability statements, or supplementary materials included in this article.


