Authors and readers should not refer to previous receiver operating characteristic studies without careful consideration of the strengths and weaknesses of the individual study when trying to understand or design a research study.
Abstract
Purpose:
To provide a broad perspective concerning the recent use of receiver operating characteristic (ROC) analysis in medical imaging by reviewing ROC studies published in Radiology between 1997 and 2006 for experimental design, imaging modality, medical condition, and ROC paradigm.
Materials and Methods:
Two hundred ninety-five studies were obtained by conducting a literature search with PubMed with two criteria: publication in Radiology between 1997 and 2006 and occurrence of the phrase “receiver operating characteristic.” Studies returned by the query that were not diagnostic imaging procedure performance evaluations were excluded. Characteristics of the remaining studies were tabulated.
Results:
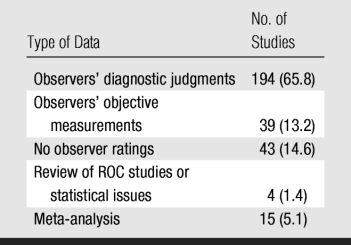
Two hundred thirty-three (79.0%) of the 295 studies reported findings based on observers' diagnostic judgments or objective measurements. Forty-three (14.6%) did not include human observers, with most of these reporting an evaluation of a computer-aided diagnosis system or functional data obtained with computed tomography (CT) or magnetic resonance (MR) imaging. The remaining 19 (6.4%) studies were classified as reviews or meta-analyses and were excluded from our subsequent analysis. Among the various imaging modalities, MR imaging (46.0%) and CT (25.7%) were investigated most frequently. Approximately 60% (144 of 233) of ROC studies with human observers published in Radiology included three or fewer observers.
Conclusion:
ROC analysis is widely used in radiologic research, confirming its fundamental role in assessing diagnostic performance. However, the ROC studies reported in Radiology were not always adequate to support clear and clinically relevant conclusions.
© RSNA, 2009
Supplemental material: http://radiology.rsna.org/lookup/suppl/doi:10.1148/radiol.2533081632/-/DC1
Introduction
Receiver operating characteristic (ROC) analysis is a method based on signal detection theory (1) that was introduced into medicine by Lusted (2) in the 1960s and further delineated later (3). Since the early 1970s, ROC analysis has been used in the field of radiology for evaluation of radiologic imaging systems (4–9).
In general, substantial time and resources are necessary to decide whether a new diagnostic technology will have a useful effect on patient care. Because of this and ethical concerns, technologies are usually assessed in a stepwise fashion by progressively quantifying more directly relevant characteristics, though at increasingly greater cost and often with less rigidly controlled potential cofactors. One way to look at this progression is in terms of the six levels of diagnostic efficacy introduced by Fryback and Thornbury (10), which range from technical fidelity to the impact of a new diagnostic device on a society's well-being. ROC analysis assesses efficacy at the second level, which is diagnostic accuracy.
ROC analysis has evolved steadily during the past several decades, allowing researchers to analyze increasingly complex experimental designs and, thereby, to be increasingly confident in the resulting claims. Although a review article has covered recent developments in the field (11), we are not aware of any attempt to provide an overview of the kinds of ROC analyses that have been most commonly published in radiologic research. By comparing the work published with the techniques available, one can not only obtain perspective on the types of analysis done in the field, but one can also learn much concerning the strength of the conclusions that can be drawn from those published manuscripts.
It is also worthwhile to ask whether we can draw lessons for the design of future studies from those that have already been published. For better or worse, it is common to design future experiments on the basis of previously published ones. We want to see whether the previously published experiments provide the basis for a good standard. Several comprehensive reviews (12–16) have surveyed design issues in medical diagnostics experiments. We chose to focus on Radiology because a large number of manuscripts in which ROC analysis results are reported are published in it, thereby providing an opportunity for us to analyze a pool of studies that had been subjected to similar peer-review criteria.
Thus, the purpose of our study was to provide a broad perspective concerning the use of ROC analysis in medical imaging by reviewing studies published in Radiology between 1997 and 2006 for experimental design, imaging modalities, medical conditions, and ROC paradigms.
Materials and Methods
No authors contributed to the development of the commercial software programs listed in our study.
This study was exempt from review by our institutional review board because no human subjects were used. A literature search for studies published in Radiology between January 1997 and December 2006 was performed by using PubMed to access the MEDLINE database (http://www.ncbi.nlm.nih.gov/pubmed/) and the Radiology Web site (http://radiology.rsna.org/) search tool to access articles by using the phrase “receiver operating characteristic.” For the PubMed and Radiology searches, the query returned a total of 299 and 260 articles, respectively. After removing the articles that were not relevant to this research (ie, those that were not published in the selected time frame or that included “receiver operating characteristic” in the text but did not use ROC analysis), we obtained a total of 295 ROC studies.
We reviewed these 295 articles according to 16 considerations: (a) inclusion of human observers (reviews and meta-analyses were excluded from further analysis), (b) the general purpose of the ROC analysis, (c) imaging modality, (d) radiology subspecialty, (e) ROC paradigm, (f) type of reference standard, (g) ROC study design, (h) number of observers, (i) number of cases with positive or negative findings included in the analysis, (j) number of categories in the ordinal scale used to rate cases, (k) data clustering, (l) method used to standardize observers' rating data, (m) type of signals studied, (n) what ROC estimates were reported, (o) what pairs of areas under the ROC curve (AUCs) (17,18) were found for the modalities being compared and whether each difference was considered statistically significant (if available), and (p) the software used for data analysis. These 16 considerations are detailed in Appendix E1 (online).
The original reports were divided into three subgroups. Subgroup A consisted of reports that included human observers' diagnostic judgments or objective measurements. Subgroup B (part of subgroup A) consisted of the reports that specifically included observers' diagnostic judgments. Subgroup C consisted of studies that used the conventional ROC paradigm. These subgroups were used because they represent important types of studies.
Results
In the following, we report the results of our literature survey according to the 16 criteria described in the previous section.
Study Included Human Observers
Of the 295 retrieved manuscripts, 276 were original reports that used ROC, free-response ROC (FROC), or alternative FROC methods. Of these, 233 included human observers (Table 1).
Table 1.
Presence of Observer Data in 295 ROC Studies
Note.—Data in parentheses are percentages.
General Purpose of ROC Analysis
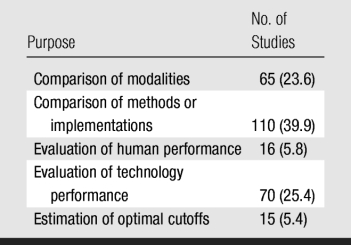
Most (63.5%) of the studies used ROC analysis to compare two or more modalities, methods, or implementations (eg, different sequences or contrast agents in magnetic resonance [MR] imaging, different compression ratios in digital radiography) (Table 2). Sixteen studies (5.8%) were designed to evaluate or compare the performance levels of human observers (eg, faculty radiologists vs residents). Seventy (25.4%) studies focused on measuring the performance of a technology (usually newer) without any direct comparison to alternative diagnostic modalities. Estimation of optimal cutoff values was attempted in only 15 ROC studies (5.4%).
Table 2.
General Purpose of 276 ROC Studies
Note.—Data in parentheses are percentages.
Imaging Modalities
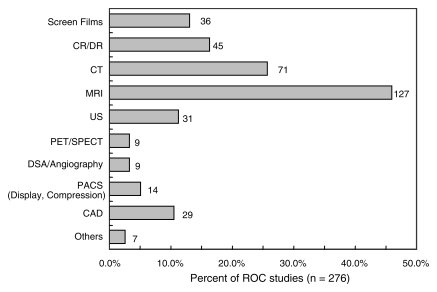
In 187 (67.8%) of 276 ROC studies, one imaging modality was evaluated; in 77 (27.9%), two modalities were evaluated; and in 12 (4.3%), three or more modalities were evaluated. A broad distribution of modalities was assessed by using ROC analysis, with MR imaging (127 studies; 46.0%) and computed tomography (CT) (71 studies; 25.7%) analyzed most frequently (Fig 1).
Figure 1:
Bar graph of imaging modalities used in ROC studies. Number to right of each bar is number of studies in which that modality was used. Sum of data does not equal number of studies because some studies used more than one modality. Denominator for percentages was number of studies (n = 276). CAD = computer-aided diagnosis, CR/DR = computed radiography/digital radiography, DSA = digital subtraction angiography, PACS = picture archiving and communication system, PET/SPECT = positron emission tomography/single photon emission computed tomography, US = ultrasonography.
Radiology Subspecialty
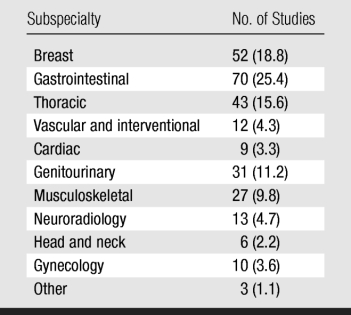
Breast (18.8%), gastrointestinal (25.4%), thoracic (15.6%), and genitourinary (11.2%) imaging accounted for 71.0% of the studies (Table 3).
Table 3.
Radiology Subspecialty of 276 ROC Studies
Note.—Data in parentheses are percentages.
ROC Paradigm
The conventional ROC paradigm was used in 242 (87.7%) of 276 studies, FROC or alternative FROC analysis was used in 27 (9.8%), both ROC and location ROC were used in four (1.4%), and both ROC and FROC or alternative FROC were used in three (1.1%).
Reference Standard
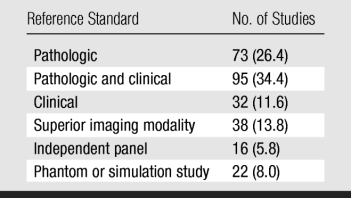
Reference standards were sometimes referred to as gold standards in the literature. Most (60.8%) of the studies used pathologic or pathologic and clinical data as the reference standard (Table 4). In those studies, the classification of a patient as having positive findings (ie, carrying the disease or abnormality) was supported by pathologic data from surgery or biopsy; for patients with benign or normal findings, a combination of pathologic findings and clinical judgment (eg, follow-up for a certain period or lack of symptoms) was considered sufficient. Imaging modalities that were considered to be superior were used as the reference standard in 38 (13.8%) of 276 studies: CT for the evaluation of chest radiography; optical colonoscopy, for CT; CT, for angiography and digital subtraction angiography; and MR imaging, for US. It is interesting to note that CT was sometimes used as a reference standard and sometimes as the modality undergoing evaluation, implicitly pointing to a potential source of bias.
Table 4.
Reference Standard Used in 276 ROC Studies
Note.—Data in parentheses are percentages.
ROC Study Design
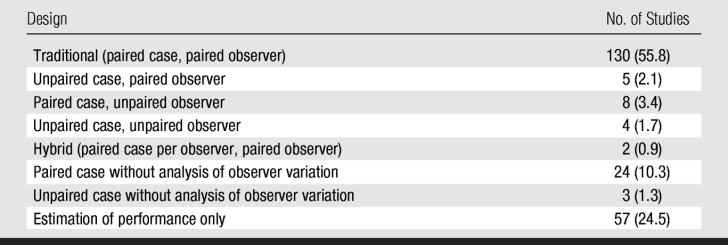
In most (55.8%) of the 233 ROC studies in which observer variation was considered, the researchers used the traditional fully crossed design with paired cases and paired observers when comparing modalities (Table 5). However, 84 (36.1%) studies (subgroup A) were performed without considering observer variation and, thus, provided a weaker assessment of clinical performance. Cases were collected retrospectively in 174 (74.7%) studies and prospectively in 52 (22.3%); the remaining seven (3.0%) studies failed to indicate how cases were collected.
Table 5.
Study Design in 233 ROC Studies with Observers
Note.—Data in parentheses are percentages.
Number of Observers
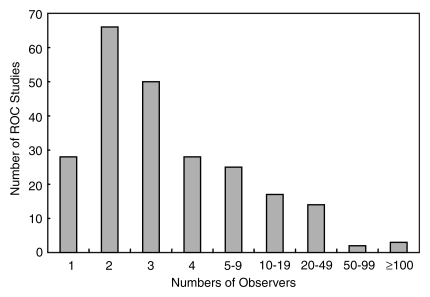
Most (172 studies; 73.8%) of the 233 ROC studies in subgroup A involved fewer than five observers, and 28 (12.0%) involved only one observer (Fig 2). In 78 (54.2%) of the 144 studies with between two and four observers, a κ statistic or a similar measure was used to estimate interobserver variation.
Figure 2:
Bar graph of number of observers in 233 subgroup A ROC studies.
Number of Cases
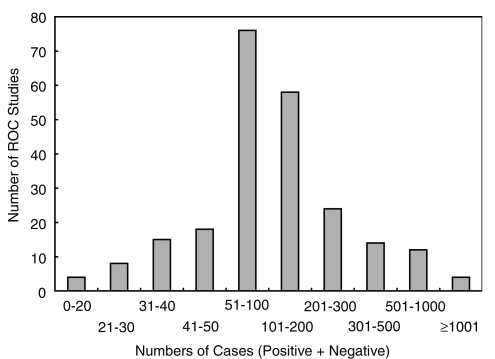
In most (188 studies; 80.7%) of the 233 studies, researchers based their conclusions on more than 50 cases, with most including between 51 and 200 cases (Fig 3).
Figure 3:
Bar graph of number of cases (sum of those with positive findings and those with negative findings) in 233 subgroup A ROC studies.
Number of Categories in the Rating Scale
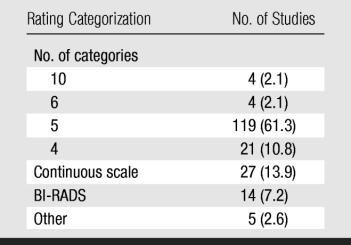
Table 6 indicates the number or type of rating categories used in the 194 studies that were based on observers' diagnostic judgments (subgroup B). In 133 (68.6%) studies, a traditional five-category ordinal rating scale (including the BI-RADS scale) was used; whereas in only 27 (13.9%), a continuous or quasicontinuous scale was used. BI-RADS category 0 (“need additional imaging evaluation”) is often used as a flag to recall patients. However, this creates problems when trying to construct an ordinal scale to be mapped to an ROC curve because this category overlaps with all score above BI-RADS category 2. It is not surprising, therefore, that nine of the 14 studies in which the BI-RADS scale was used did not allow radiologists to use category 0. The remaining five studies did not specify how category 0 was used.
Table 6.
Rating Categorization Used in 194 ROC Studies with Observers' Diagnostic Judgments
Note.—Data in parentheses are percentages. BI-RADS = Breast Imaging Reporting and Data System.
Data Clustering
In 123 (63.4%) of the 194 studies in subgroup B, nonclustered input data were used; whereas in 69 (35.6%), clustered (n = 55) or partially clustered (n = 14) input data were used. Researchers in two studies did not describe the nature of their data in enough detail to indicate whether it was clustered.
Observer Rating Standardization Method
In 159 (68.2%) of the 233 studies in subgroup A, researchers used individual observers' ratings to estimate observer-specific ROC, FROC, or alternative FROC curves. However, in 40 (17.2%) studies, pooling (n = 20; 8.6%), consensus (n = 13; 5.6%), or averaging (n = 7; 3.0%) were used to calculate a summary ROC index or curve. Of the remaining 34 studies, 28 involved a single observer, and researchers in six did not describe how the observer rating data were standardized.
Type of Signals
In 208 (89.3%) of the 233 subgroup A studies, actual lesions or clinically important features were evaluated. In 22 studies, researchers used superimposed simulated signals on clinical images (n = 11) or used images of phantoms (n = 11) to increase the number of samples and/or to control their characteristics. Studies with simulated and/or phantom images used a mean of 244.5 cases (range, 20–600 cases), which was more than the mean of 187.7 cases used in studies with actual lesions, although this difference was not significant (P = .27). In only three studies were images of animals used.
ROC Estimates Reported
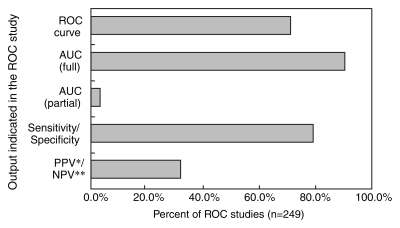
In 224 (90.0%) of 249 ROC studies describing the assessment of a medical imaging methods (subgroup C), researchers reported AUCs among their indexes of accuracy (Fig 4). ROC curves can cross, potentially rendering significant differences in AUCs inconclusive because the modality with the larger AUC could be inferior for a critical range of specificity values. However, partial AUC values were rarely used, and they were only used in studies of breast imaging. Only 176 (70.7%) of the studies showed any estimates of the ROC curves themselves. Sensitivity and specificity were used nearly as frequently as was AUC, and all three measures were reported in 172 (69.1%) of the studies.
Figure 4:
Bar graph of data reported in 249 ROC studies. Percentages do not sum to 100 because some studies reported more than one output value. NPV** = negative predictive value, PPV* = positive predictive value.
AUCs and Significance of Their Differences
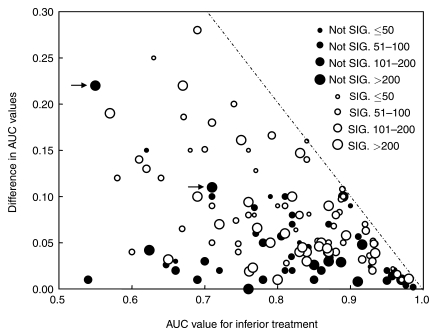
We found that studies with nonsignificant findings tended to be relatively large (Fig 5). In addition, studies with significant results tended to be larger when the differences in AUCs were smaller.
Figure 5:
Scatterplot of the relationship between differences in pairs of AUCs obtained when comparing two different treatments and AUC for the inferior treatment in each pair, with indication of finding significance and number of cases in the key. Two ROC studies (arrows) were performed by the same research group and employed a similar experimental design (phantom images as a clustered case sample; four observers; LABMRMC software used). Most likely cause of nonsignificant results is a small number of observers. Dashed line = theoretical maximum difference in AUC for the AUC for inferior treatment. Not SIG. = not significant, SIG. = significant.
Software
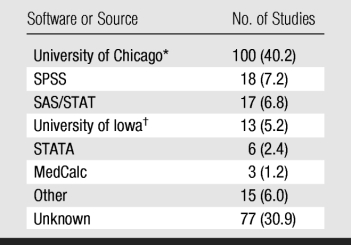
One hundred (40.2%) of the 249 subgroup C studies used University of Chicago software, whereas 77 (30.9%) did not indicate what kind of software was employed (Tables 7 and 8). It should be noted that no software was available specifically for FROC or alternative FROC analysis before 2005, so 25 of the 27 studies that used these methods employed software designed for other types of analysis or in-house implementations. Investigators in two recent studies (19,20) that used FROC or alternative FROC analysis used software (JAFROC; http://www.devchakraborty.com/JAFROC.html) dedicated to this type of analysis that can be downloaded without a charge.
Table 7.
Software Used in 249 ROC Studies
Note.—Software developers are listed in table 8. Data in parentheses are percentages.
* ROCFIT, ROCKIT, CORROC2, CLABROC, LABROC, PROPROC, and LABMRMC.
† RSCORE and DBM-MRMC.
Table 8.
Source and Description of Software Most Commonly Used in 295 ROC Studies
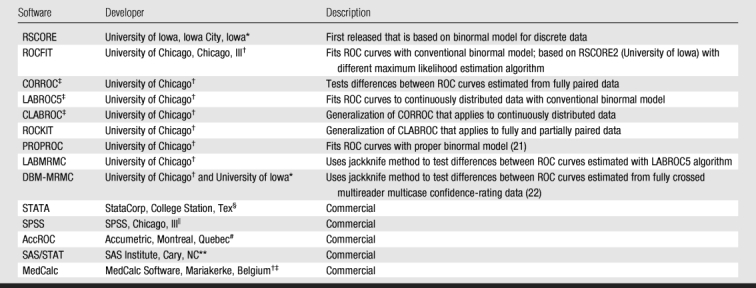
Note.—Software is free unless it is described as commercial.
‡ CORROC, LABROC5, and CLABROC are not available separately but are incorporated into ROCFIT.
Discussion
It is important for both investigators and readers of the radiologic literature to carefully consider the use of ROC and related methods, which are steadily becoming more widely employed. Attention must also be paid to new developments, such as FROC and alternative FROC analysis, which are likely to become more common in the future.
Among the 276 original research articles that we found in Radiology, researchers in a large fraction (79.0%) described observer performance. Moreover, in most (83.3%) of these studies, diagnostic judgments, as opposed to other simpler tasks, were evaluated. These percentages may reflect the spectrum of manuscripts that are submitted to Radiology and/or the biases of the journal's editor and reviewers. However, they are consistent with a conjecture that the readers of Radiology prefer investigations in which an attempt is made to describe the effect of specific technologies on physician performance under reasonably realistic conditions, which is the main purpose of a clinical journal.
Our findings indicate that ROC analysis has been used mainly to compare the diagnostic performance of two or more modalities, methods, or implementations, which is the most reasonable approach when an already accepted and validated technology is available. However, ROC analysis is also useful to evaluate and optimize a new technology or implementation independently from alternatives (eg, using cost-benefit analysis or clinical evidence to optimize the cutoffs used to make clinical decisions).
It is not surprising that MR imaging (46.0%) and CT (25.7%) were the most commonly analyzed modalities, given that they are generally more expensive and more advanced than most other radiologic techniques. However, it is interesting that US is almost as commonly studied as is digital radiography, suggesting that US is commanding widespread research interest despite, or perhaps because of, its relatively low cost. However, the number of ROC studies on US is small compared with that on MR imaging or CT. Perhaps this is owing, at least in part, to experimental design issues that are specific to US images, which in clinical practice are partially or largely analyzed during image acquisition, thereby rendering reader studies difficult.
Because lung cancer is the leading cause of cancer death, and breast cancer is the second most common cause of cancer death among women, it is not surprising that breast and lung were the two most frequently investigated organs in our literature search. Moreover, current debate concerning the usefulness of breast cancer screening (23) provides additional motivation for active research in that field.
The dominance (90.2%) of the conventional ROC paradigm might have been partially caused by the fact that location analysis tools are relatively new and have not yet been quantitatively related to higher levels of diagnostic efficacy (10), whereas conventional ROC analysis is intimately connected with cost-benefit analysis (7). Comparison of observer study paradigms is still very much an open field of research, and the ultimate implications of different paradigms are not yet evident.
The reference standard used to establish the presence of a condition in an ROC study is a fundamental factor in assessing its value. A few examples may help clarify this issue. If the reference standard was determined by consensus—what we categorized as an independent panel of experts—then the estimated performance of the treatment is likely to be biased because experts can be wrong or disagree. On the other hand, when the study was designed to compare the performance of a new modality against the established one, which was also used as the reference standard (an approach frequently used in colonoscopy), there is essentially the certainty of a bias in favor of the established modality (24). A more subtle bias occurs when lesions detected only with the conventional modality are more likely to be included in the study as having positive findings than are lesions detected only with the new technology. This is not strictly an issue of reference standard, because usually the reference standard of the cases is established accurately and independently. However, cases are usually selected by using the conventional modality because they are judged to have stronger evidence for the presence of a condition, thereby potentially introducing bias (25,26).
We conjecture that the most likely reasons for the dominance of the fully crossed experimental design are that it is the most powerful for detecting differences in performance and that it is the design for which ROC analysis tools have been available for the longest time (11,27). However, other experimental designs may be dictated by particular experimental goals and practical constraints (eg, comparisons of US with MR imaging do not lend themselves to fully crossed designs because images from these two modalities are usually read by different radiologists).
The significance of differences between index values of new technologies, such as computer-aided diagnosis, is often first tested by accounting only for case variation—how much an accuracy index estimate would be expected to vary if the experiment were repeated with independently drawn and identically sized case samples but with a fixed image observer or set of observers. This approach to testing does not fully indicate how a technology will affect medical practice because it provides no information about how consistently different radiologists or physicians can or will use it. However, such tests can be useful in deciding whether a new tool is capable, in principle, of providing useful information about a disease. When only case-sample variation is taken into account, the standard error of any single AUC estimate can be approximated (11). One should note that (a) small data sets yield large uncertainties (eg, for 30 cases with positive findings and 30 cases with negative findings, the 95% confidence interval covers nearly 40% of all possible results), (b) unbalanced data yield relatively large uncertainties given a particular total number of cases, and (c) uncertainty drops slowly as the total number of cases increases. Including a large number of cases in an observer study may reduce observers' motivation to complete the study without loss of concentration, however. Therefore, one must choose the number of cases for the observer study by taking into account estimates of both the mean reading time required per case and the number of cases that observers can read without appreciable fatigue during one interpretation session or a small number of them. Moreover, the advantage of performing experiments that mimic clinical practice as closely as possible usually requires the use of unbalanced data sets, because clinical disease prevalence is usually far below 50%.
Studies that pair cases across modalities are more powerful than studies that sample cases independently across modalities for demonstrating the significance of real differences. We found that the majority of ROC studies published in Radiology must be considered exploratory studies from the case-variation point of view. Use of paired cases reduces the width of the confidence interval on any difference but not substantially in many situations. If, as often happens, cases are selectively chosen rather than randomly sampled, study results are likely to be even less generalizable.
Observer variability is caused by differences in training, experience, and other factors (11,28). We found that nearly 50% of all studies published in Radiology included three or fewer observers. These small numbers of observers raise questions such as the following: (a) To what extent can a study performed with three or four observers represent the radiologic community? (b) What knowledge about the variation in performance of a technology is provided by a study performed with two attending radiologists from a research institution and their three residents? (c) How much are the results of such a study affected by the practical details of its experimental design? However, there are situations where a small number of observers can be acceptable. Some examples include preliminary studies, situations where it is impossible or impractical to obtain a larger sample of radiologists (because few radiologists work in a subspecialty or because the effect of a study is too small to justify a higher cost), and situations where independent prestudy evidence suggests very low reader variability.
Many methods for rating cases are used in ROC studies. Ordinal five-category scales were ubiquitous in ROC research published more than 20 years ago, so tradition may be at least partially responsible for the widespread use of those scales today. However, a few simple points concerning such rating scales (11) must be noted: (a) When few (eg, less than five) rating categories are available, it is nearly impossible to obtain a reliable estimate of AUC and of many other ROC indexes unless the resulting operating points are well distributed along the ROC curve. (b) The BI-RADS categories themselves are problematic when estimating ROC indexes. (c) Nominally continuous scales, especially those used by observers to estimate probability or odds, are often practically equivalent to 10- or 20-category scales. (d) When an observer's operating points (ie, combinations of sensitivity and specificity) from which an ROC curve is to be estimated are poorly distributed, most ROC index estimates tend to be heavily biased in practice, and any comparisons that are based on them may be nearly meaningless.
Additionally, data in radiologic research are often clustered (eg, most patients have two lungs and most women have two breasts). Analyzing clustered data as if they were independent produces estimates of uncertainty that are too small; we tend to be more confident in our conclusions than we should be. Thus, when the data in an evaluation study are naturally clustered, it is necessary to carefully look at the statistical analysis the study employs and the conclusions the researchers draw.
Our observation that 68.2% of the studies analyzed different observers' ratings independently shows that researchers tend to be mindful to the fact that observers use rating scales differently and are concerned that pooling observers nearly always distorts the performance of diagnostic devices. In contrast, the 8.6% of the studies that pooled observers' findings must be interpreted with great caution because their results are likely to include bias in an unknown direction, unless observers used each study's rating scale in a standardized way, which experience shows is rare.
The fact that most of the studies in our literature survey used actual lesions is consistent with a more clinical approach that may come close to representing real-world medical practice. In addition, it is consistent with the use of phantom images partially to achieve greater statistical power.
We found that studies with nonsignificant findings tended to be relatively large, consistent with the tendency to publish the findings of these trials only if they are of high quality—an example of so-called publication bias (29). Moreover, studies with significant results tended to be larger when the differences in AUCs were smaller, which seems to be a consequence of the effort needed to prove that small differences are real differences. However, this may be another example of publication bias: Small studies are published only when the findings are significant, thereby providing a highly skewed impression. Large AUC differences are almost exclusively populated in studies with significant findings with no particular trend in terms of study size, suggesting a potential publication bias.
One finding of our research was the heterogeneity of the data reported in the studies. The results of each study are thus difficult to put in context and even more difficult to use to design future experiments. We believe that authors of future studies that describe ROC analysis should give greater consideration to the “Reporting the Results” section of report 79 (26) of the International Commission on Radiation Units and Measurements and the references therein.
In conclusion, appropriate experimental design and data analysis are key requirements for successful observer performance studies. However, the ROC studies reported in Radiology between 1997 and 2006 were not always adequate and contained some mistakes that occurred frequently, which suggests that authors and readers should not refer to previous work without careful consideration of the strengths and weaknesses of the individual study when trying to understand or design a research study.
Advances in Knowledge.
Focusing on receiver operating characteristic (ROC) analysis, this study provides a broad perspective on how medical imaging systems were assessed in Radiology by reviewing 295 studies published between 1997 and 2006.
The majority of the studies employed ROC analysis for the purpose of comparing two or more modalities, methods, or implementations.
Nearly 50% of ROC studies involving the assessment of observer performance included three or fewer radiologists, thereby seriously challenging the generalizability of their conclusions to the relevant population of radiologists.
Large differences between areas under the ROC curves were nearly always found to be significant, regardless of sample size, suggesting a potential publication bias.
The information tabulated and discussed in this study should be useful to radiology researchers when planning and publishing their studies and to clinicians when trying to interpret the literature.
Supplementary Material
Received September 25, 2008; revision requested November 11; revision received March 6, 2009; accepted May 20; final version accepted June 24.
From the 2007 RSNA Annual Meeting.
Supported in part by USPHS grant CA98119.
Funding: This research was supported by the National Institutes of Health (grant R01 EB000863).
Abbreviations:
- AUC
- area under the ROC curve
- BI-RADS
- Breast Imaging Reporting and Data System
- FROC
- free-response ROC
- ROC
- receiver operating characteristic
References
- 1.Green DM, Swets JA. Signal detection theory and psychophysics New York, NY: Krieger, 1974 [Google Scholar]
- 2.Lusted L. Introduction to medical decision making Springfield, Ill: Charles C Thomas, 1968 [Google Scholar]
- 3.Lusted LB. Signal detectability and medical decision-making. Science 1971;171:1217–1219 [DOI] [PubMed] [Google Scholar]
- 4.Swets JA. Measuring the accuracy of diagnostic systems. Science 1988;240:1285–1293 [DOI] [PubMed] [Google Scholar]
- 5.Goodenough DJ, Rossmann K, Lusted LB. Radiographic applications of receiver operating characteristic (ROC) curves. Radiology 1974;110:89–95 [DOI] [PubMed] [Google Scholar]
- 6.Metz CE. ROC methodology in radiologic imaging. Invest Radiol 1986;21:720–733 [DOI] [PubMed] [Google Scholar]
- 7.Metz CE. Basic principles of ROC analysis. Semin Nucl Med 1978;8:283–298 [DOI] [PubMed] [Google Scholar]
- 8.Metz CE. ROC analysis in medical imaging: a tutorial review of the literature. Radiol Phys Technol 2008;1:2–12 [DOI] [PubMed] [Google Scholar]
- 9.Obuchowski NA. Receiver operating characteristic curves and their use in radiology. Radiology 2003;229:3–8 [DOI] [PubMed] [Google Scholar]
- 10.Fryback DG, Thornbury JR. The efficacy of diagnostic imaging. Med Decis Making 1991;11:88–94 [DOI] [PubMed] [Google Scholar]
- 11.Wagner RF, Metz CE, Campbell G. Assessment of medical imaging systems and computer aids: a tutorial review. Acad Radiol 2007;14:723–748 [DOI] [PubMed] [Google Scholar]
- 12.Wagner RF, Beiden SV, Campbell G, Metz CE, Sacks WM. Assessment of medical imaging and computer-assist systems: lessons from recent experience. Acad Radiol 2002;9:1264–1277 [DOI] [PubMed] [Google Scholar]
- 13.Pepe MS. The statistical evaluation of medical tests for classification and prediction Oxford, England: Oxford University Press, 2004 [Google Scholar]
- 14.Zhou XH, Obuchowski NA, McClish DK. Statistical methods in diagnostic medicine New York, NY: Wiley-Interscience, 2002 [Google Scholar]
- 15.Eng J. Sample size estimation: a glimpse beyond simple formulas. Radiology 2004;230:606–612 [DOI] [PubMed] [Google Scholar]
- 16.Dorfman DD, Berbaum KS, Brandser EA. A contaminated binormal model for ROC data. I. Some interesting examples of binormal degeneracy. Acad Radiol 2000;7:420–426 [DOI] [PubMed] [Google Scholar]
- 17.Hanley JA, McNeil BJ. The meaning and use of the area under a receiver operating characteristic (ROC) curve. Radiology 1982;143:29–36 [DOI] [PubMed] [Google Scholar]
- 18.Hanley JA, McNeil BJ. A method of comparing the areas under receiver operating characteristic curves derived from the same cases. Radiology 1983;148:839–843 [DOI] [PubMed] [Google Scholar]
- 19.Penedo M, Souto M, Tahoces PG, et al. Free-response receiver operating characteristic evaluation of lossy JPEG2000 and object-based set patitioning in hierarchical trees compression of digitized mammograms. Radiology 2005;237:450–457 [DOI] [PubMed] [Google Scholar]
- 20.Pikus L, Woo JH, Wolf RL, et al. Artificial mulitple sclerosis lesions on simulated FLAIR brain MR images: echo time and observer performace in detection. Radiology 2006;239:238–245 [DOI] [PubMed] [Google Scholar]
- 21.Pesce LL, Metz CE. Reliable and computationally efficient maximum-likelihood estimation of proper binormal ROC curves. Acad Radiol 2007;14:814–829 [DOI] [PMC free article] [PubMed] [Google Scholar]
- 22.Dorfman DD, Berbaum KS, Metz CE. Receiver operating characteristic rating analysis: generalization to the population of readers and patients with the jackknife method. Invest Radiol 1992;27:723–731 [PubMed] [Google Scholar]
- 23.Gotzsche PC. On the benefits and harms of screening for breast cancer. Int J Epidemiol 2004;33:56–64 [DOI] [PubMed] [Google Scholar]
- 24.Ransohoff DF, Feinstein AR. Problems of spectrum and bias in evaluating the efficacy of diagnostic tests. N Engl J Med 1978;299:926–930 [DOI] [PubMed] [Google Scholar]
- 25.Begg CB, McNeil BJ. Assessment of radiologic tests: control of bias and other design considerations. Radiology 1988;167:565–569 [DOI] [PubMed] [Google Scholar]
- 26.International Commission on Radiation Units and Measurements. Receiver operating characteristic analysis in medical imaging Oxford, England: Oxford University Press, 2008 [Google Scholar]
- 27.Obuchowski NA. Multireader receiver operating characteristic studies: a comparison of study designs. Acad Radiol 1995;2:709–716 [DOI] [PubMed] [Google Scholar]
- 28.Wagner RF, Beam CA, Beiden SV. Reader variability in mammography and its implications for expected utility over the population of readers and cases. Med Decis Making 2004;24:561–572 [DOI] [PubMed] [Google Scholar]
- 29.Petitti DB. Meta-analysis, decision-analysis, and cost-effectiveness analysis: methods for quantitative synthesis in medicine 2nd ed Oxford, England: Oxford University Press, 2000 [Google Scholar]
Associated Data
This section collects any data citations, data availability statements, or supplementary materials included in this article.


