

Radiologists without fellowship training in breast imaging significantly improved in their interpretation of screening mammograms as they gained clinical experience following residency, while radiologists who received fellowship training in breast imaging did not have this learning curve in clinical practice.
Abstract
Purpose:
To examine changes in screening mammogram interpretation as radiologists with and radiologists without fellowship training in breast imaging gain clinical experience.
Materials and Methods:
In an institutional review board—approved HIPAA-compliant study, the performance of 231 radiologists who interpreted screen-film screening mammograms from 1996 to 2005 at 280 facilities that contribute data to the Breast Cancer Surveillance Consortium was examined. Radiologists’ demographic data and clinical experience levels were collected by means of a mailed survey. Mammograms were grouped on the basis of how many years the interpreting radiologist had been practicing mammography, and the influence of increasing experience on performance was examined separately for radiologists with and those without fellowship training in breast imaging, taking into account case-mix and radiologist-level differences.
Results:
A total of 1 599 610 mammograms were interpreted during the study period. Performance for radiologists without fellowship training improved most during their 1st 3 years of clinical practice, when the odds of a false-positive reading dropped 11%–15% per year (P < .015) with no associated decrease in sensitivity (P > .89). The number of women recalled per breast cancer detected decreased from 33 for radiologists in their 1st year of practice to 24 for radiologists with 3 years of experience to 19 for radiologists with 20 years of experience. Radiologists with fellowship training in breast imaging experienced no learning curve and reached desirable goals during their 1st year of practice.
Conclusion:
Radiologists’ interpretations of screening mammograms improve during their first few years of practice and continue to improve throughout much of their careers. Additional residency training and targeted continuing medical education may help reduce the number of work-ups of benign lesions while maintaining high cancer detection rates.
© RSNA, 2009
Introduction
Physicians begin practicing independently in their chosen field after residency training is completed, yet little is known about how their clinical skills develop over the course of their careers. The link between experience in clinical practice and the quality of care delivered has been a focus of some professions such as surgery (1–3); however, within other fields, including radiology, learning curves have not been studied beyond their relation to the use of emerging technologies (4).
Variability in radiologists’ interpretive performance of mammography in the United States has been extensively studied (5–11). Prior research has found that radiologists with more years of experience in interpreting mammograms have lower false-positive rates than their less experienced counterparts, with inconsistent effects on sensitivity (7–9,12,13). However, these studies compared groups of radiologists who had interpreted mammograms for different periods of time rather than studying changes within individual radiologists as they proceeded through their careers. Thus, these studies are confounded by temporal changes in medical education and practices, as well as by inherent differences among radiologists who have chosen to remain in mammography for many years compared with those who have more recently entered the field.
Our purpose was to evaluate changes in screening mammogram interpretation as radiologists with and radiologists without fellowship training in breast imaging gained clinical experience.
Materials and Methods
Study Population
Our study includes data from seven mammography registries in the National Cancer Institute–funded Breast Cancer Surveillance Consortium (BCSC) (14) (http://breastscreening.cancer.gov). These registries link information on women who undergo mammography at a participating facility to regional cancer registries and pathology databases to determine cancer outcomes. These cancer registries have been found to be at least 94.3% complete (15). The survey is described in Elmore et al (16). There were 256 responding radiologists, but we excluded 25 radiologists who interpreted no screening mammograms during our study period (from January 1, 1996, to December 31, 2005) and one who did not answer the question about years of experience. The final study sample included 231 radiologists from 280 facilities. Performance measures for the 231 radiologists in our study were similar to the performance measures for the 1073 radiologists who interpreted screen-film screening mammograms in the BCSC at any time from January 1, 1996, to December 31, 2005—that is, the recall rate was 9.5% in our study versus 9.4% in the BCSC, the sensitivity was 82.4% versus 81.6%, the false-positive rate was 9.2 versus 9.1%, and the positive predictive value of recall (PPV1) was 4.3% versus 4.3%. The BCSC Statistical Coordinating Center pooled and linked data from the registries and surveys for analysis.
The institutional review boards of all participating sites approved this study. Each BCSC registry, as well as the Statistical Coordinating Center, also received institutional review board approval, for either active or passive consenting processes or for a waiver of consent to enroll women who underwent mammography at BCSC sites, to link data, and to perform analytic studies. All procedures complied with the Health Insurance Portability and Accountability Act, and all registries and the Statistical Coordinating Center received a Federal Certificate of Confidentiality and other protection for the identities of the women, physicians, and facilities who were the subjects of this research (17).
To assess performance, we included screen-film screening mammograms interpreted by a participating radiologist at a BCSC facility during the study period. To simplify the study design, digital mammograms were excluded because a separate learning curve could be associated with the introduction of this new technology. A screening mammogram was defined as a bilateral mammogram that the interpreting radiologist indicated was for routine screening. To avoid misclassifying diagnostic examinations as screening examinations, we excluded mammograms obtained within 9 months of a prior breast imaging examination. We excluded mammograms obtained in women with breast augmentation, women with a history of breast cancer, and women younger than 18 years.
Measurements
The radiologist survey included questions about demographic characteristics (age and sex), experience (years of mammographic interpretation [not including residency training], fellowship training in breast imaging, the volume of mammograms that were interpreted independently and the number that were double read, and the percentage of time working in breast imaging in the prior year), and clinical practice characteristics in the prior year (affiliation with an academic medical center).
We defined the year each radiologist started interpreting mammograms by subtracting the total number of years they self-reported having interpreted mammograms from the year they completed the survey. If this calculated start year preceded the year they reported graduating from residency, we used the graduation year as their start year (n = 16). If the date when they started interpreting mammograms at a BCSC facility after July 1 of the year they graduated from residency was within 15 months of July 1 of their self-reported start year, we used the date they started interpreting mammograms at a BCSC facility as their start date (n = 43). Otherwise, we assumed that they started interpreting mammograms on July 1 of their start year (n = 188), the day after physicians usually finish their residency. From this start date, we calculated the interpreting radiologist's years of experience for each screening mammogram they interpreted in the BCSC database.
Information on patient and mammogram characteristics collected at the time of mammography included patient age, mammographic breast density, time since last mammographic examination, availability of comparison films, and whether computer-aided detection (CAD) was used. Mammographic breast density was characterized by using the Breast Imaging Reporting and Data System (BI-RADS) (18) categories: almost entirely fat, scattered fibroglandular densities, heterogeneously dense, or extremely dense.
Mammograms were classified as positive or negative by using standard BCSC definitions (19) on the basis of the initial BI-RADS assessment and recommendations (18) assigned by the radiologist. Women were considered to have breast cancer if a diagnosis of invasive carcinoma or ductal carcinoma in situ occurred within 1 year of the mammogram and prior to the next screening mammogram.
The recall rate was defined as the percentage of mammograms with a positive assessment, sensitivity was defined as the percentage of positive mammographic studies among women with a breast cancer diagnosis, the false-positive rate was defined as the percentage of positive mammograms among women without a breast cancer diagnosis, and PPV1 was defined as the percentage of positive mammograms that resulted in a breast cancer diagnosis.
Statistical Analysis
We calculated descriptive statistics for the radiologists and mammograms included in the study. Population-averaged performance measures were estimated according to the interpreting radiologist's years of experience, separately for radiologists with and those without fellowship training in breast imaging (20,21). For radiologists with fellowship training, we were able to examine only their 1st 10 years of practice, given that fellowship training in breast imaging has only been available in more recent years. We calculated 95% confidence intervals (CIs) for these performance measures on the basis of the robust variances estimated from logistic regression models fit by using generalized estimating equations with a working independence correlation structure to account for correlation among mammograms interpreted by the same radiologist (22). We tested for trends in the population-averaged performance measures according to years of experience by using score tests from logistic regression models fit by means of generalized estimating equations, including years of experience as a continuous variable.
We examined the within-radiologist effect of increasing years of experience on the performance measures, separately for radiologists with and those without fellowship training in breast imaging, by using multivariable conditional logistic regression models that adjusted for patient age, mammographic breast density, time since last mammogram, whether comparison films were available, and whether CAD was used. This type of analysis uses conditioning to remove the effects of any heterogeneity between radiologists from the likelihood function, including the effects of any covariates that vary solely between radiologists, such as clinical practice characteristics and registry site (23). Thus, adjustment is needed only for potential confounders that vary within radiologists. For characteristics that vary both within and between radiologists, such as years of practice, the effects of any between-radiologist differences are also controlled for; therefore, estimated odds ratios (ORs) correspond to within-radiologist effects of increasing years of practice.
The effect of increasing years of experience may depend on the number of years already in practice. For example, we might expect larger changes in performance earlier in a radiologist's career. Therefore, we included an interaction term between increasing years of experience and 5-year experience groups. To examine how performance changes during the first few years of practice, we further categorized the 1st 5 years of practice into 1-year experience groups. Statistical analyses were performed by using software (SAS, version 9.1; SAS Institute, Cary, NC). All tests of statistical significance were two-sided. An α level of .05 was used to determine statistical significance.
Results
Ninety (39%) study radiologists had a mean of less than 10 years of experience interpreting mammograms, and 40 (20%) had a mean of 20 years or more. The radiologists ranged in age from 33 to 84 years, 72.7% were male, and most (>90%) had no fellowship training in breast imaging and worked in nonacademic settings (Table 1). Radiologists with fewer years of experience were more likely to be younger, female, and fellowship-trained in breast imaging. Only 28 (12%) of 231 of the radiologists reported performing any double reading of screening mammograms, and those who double read reported double reading for only a small percentage (<5%) of studies.
Table 1.
Characteristics of 231 Radiologists Included in Study
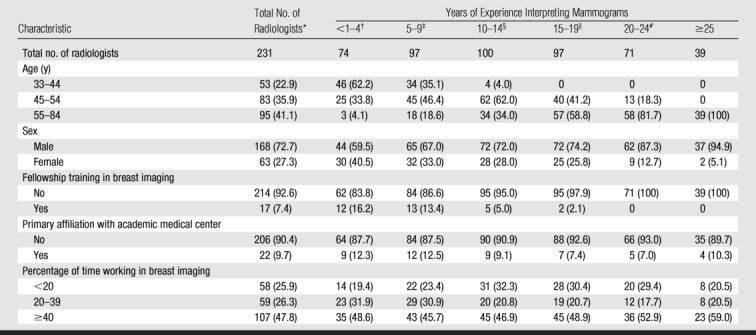
Note.—Data are numbers of radiologists, with percentages in parentheses. Radiologists could contribute to more than one comparison group.
* No. of missing values = three (1.3%) for primary affiliation with academic medical center and seven (3.0%) for percentage of time working in breast imaging.
† No. of missing values = one (1.4%) for primary affiliation with academic medical center and two (2.7%) for percentage of time working in breast imaging.
‡ No. of missing values = one (1.0%) for primary affiliation with academic medical center and three (3.1%) for percentage of time working in breast imaging.
§ No. of missing values = one (1.0%) for primary affiliation with academic medical center and four (4.0%) for percentage of time working in breast imaging.
∥ No. of missing values = two (2.1%) for primary affiliation with academic medical center and five (5.2%) for percentage of time working in breast imaging.
# No. of missing values = three (4.2%) for percentage of time working in breast imaging.
Of 1 559 610 screening mammograms obtained in 819 418 women, 7821 (5.0 per 1000) were associated with a breast cancer diagnosis within 1 year (Table 2). Most mammograms were obtained in women 40–59 years of age (59.6%) and in women who had undergone screening mammography in the prior 2 years (82.6%). Only 6.1% of women had never undergone mammography, and 11.3% had undergone their most recent screening examination more than 3 years earlier. Most women had scattered fibroglandular densities (45.5%) or heterogeneously dense breast tissue (37.8%). Comparison films were available for 84.4% of the mammograms, and CAD was used for 20.4%. CAD use increased over time, from no use in 1996 to 42% use in 2004.
Table 2.
Patient Characteristics for 1 559 610 Screening Mammograms Included in Study
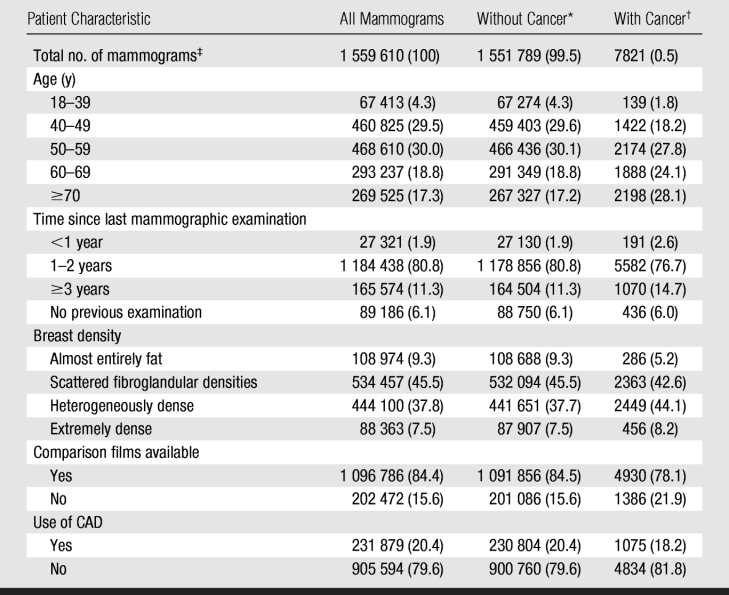
Note.—Data are numbers of mammograms, with percentages in parentheses. Within-column percentages are reported unless otherwise noted.
* No. of missing values = 92 549 (6.0%) for patient's time since last mammographic examination, 381 449 (24.6%) for breast density, 258 847 (16.7%) for comparison films available, and 420 225 (27.1%) for use of CAD.
† No. of missing values = 542 (6.9%) for patient's time since last mammographic examination, 2267 (29.0%) for breast density, 1505 (19.2%) for comparison films available, and 1912 (24.5%) for use of CAD.
‡ Data in parentheses are within-row percentages.
Figure 1 illustrates how average performance varied according to the interpreting radiologist's years of experience and compared with the Agency for Healthcare Research and Quality (AHRQ) desirable goals for screening mammography (18,24) for radiologists without fellowship training in breast imaging. In Figure 1, different radiologists may have contributed data to different years of experience, so any trends may be due to either between- or within-radiologist differences. Radiologists without fellowship training in breast imaging who had been practicing longer were less likely to recall women for further work-up (P < .001), had lower false-positive rates (P < .001), and tended to have higher PPV1 (P = .066). Mean recall and false-positive rates for radiologists with less than 1 year of experience were significantly higher than the AHRQ desirable goals (recall rate: P = .001; false-positive rate: P < .005), and PPV1 was significantly lower than the AHRQ desirable goals (P = .006). Mean recall and false-positive rates consistently met the AHRQ desirable goals only for radiologists with 19 or more years of experience. The average PPV1 fell within the AHRQ desirable range only for those radiologists with either 22 or 24 or more years of experience. There were no significant trends in sensitivity with increasing years of experience (P = .15, test for trend); however, sensitivity decreased significantly below the AHRQ desirable goals for radiologists having 20–22 years of experience (P < .005 in all cases), and (on the basis of a post hoc comparison) radiologists with 19 or more years of experience had a lower chance of detecting cancer than their counterparts with less experience (P = .025). Assuming a rate of five cancers per 1000 women screened, the number of women recalled for every breast cancer detected decreased from 33 for radiologists in their 1st year of practice to 24 for radiologists with 3 years of experience to 19 for radiologists with 20 years of experience.
Figure 1:

Graphs show population-averaged performance of screening mammography (solid lines) and 95% CIs (dashed lines) for radiologists without fellowship training in breast imaging according to the number of years radiologists had interpreted mammograms. Shaded areas = the AHRQ's desirable goals for the performance of interpretation of screening mammograms (18,24).
Figure 2 shows how average performance varied according to the interpreting radiologist's years of experience for radiologists with fellowship training. During their 1st year of practice, fellowship-trained radiologists met the AHRQ desirable goals for false-positive rate, sensitivity, and PPV1. There were no significant trends in recall rate (P = .56), false-positive rates (P = .58), or PPV1 (P = .08) with increasing years of experience. Sensitivity significantly increased with increasing years of experience (P = .043, test for trend). Sensitivity decreased below 85%, though not significantly, for fellowship-trained radiologists with 2–3 years of practice but increased again for more experienced radiologists.
Figure 2:

Graphs show population-averaged performance of screening mammography (solid lines) and 95% CIs (dashed lines) for radiologists with fellowship training in breast imaging according to the number of years radiologists had interpreted mammograms. Shaded areas = the AHRQ's desirable goals for the performance of interpretation of screening mammograms (18,24).
The largest improvement in the interpretive performance of individual radiologists without fellowship training in breast imaging occurred during the 1st 3 years of practice, when the odds of recalling a patient without cancer for additional work-up decreased by 11%–15% per year (OR for 1 year vs <1 year = 0.89 [95% CI: 0.82, 0.98], P = .015; OR for 2 years vs 1 year = 0.85 [95% CI: 0.78, 0.93], P < .001), without a significant change in sensitivity (P = .89 for 1 year vs <1 year, P = .95 for 2 years vs 1 year) (Table 3). The false-positive rate continued to decline between 2 and 19 years of practice, though this was only statistically significant between 5 and 19 years of practice. Sensitivity significantly improved from 2 to 3 years of practice (P = .035) but significantly decreased again the following year (P = .043). In contrast to the population-averaged results, the within-radiologist results showed that the false-positive rates increased with continued years of practice for those with 20 or more years of experience, with a corresponding nonsignificant improvement in sensitivity. The only significant change in PPV1 was an improvement between 15 and 19 years (P = .005).
Table 3.
Evaluation of Various Performance Measures according to Radiologists’ Years of Experience for Radiologists without Fellowship Training in Breast Imaging
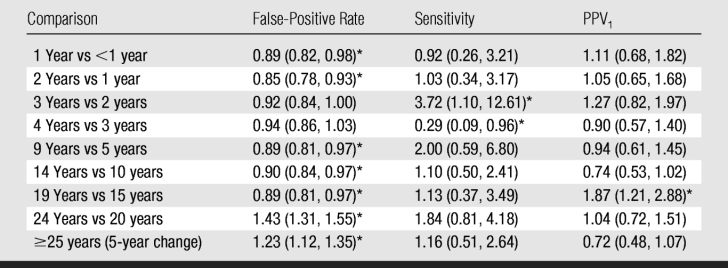
Note.—Data are ORs, with 95% CIs in parentheses. The table shows the within-radiologist effect of a 1-year increase in years of experience on performance during the 1st 5 years of practice and the within-radiologist effect of a 5-year increase in years of experience on interpretive performance for each subsequent 5-year experience group. Radiologists could contribute to more than one comparison group. Values are adjusted for patient age, time since last mammographic examination, availability of comparison films, use of CAD, and BI-RADS breast density category.
* Statistically significant difference (P < .05).
We found no evidence of a learning curve among radiologists with fellowship training in breast imaging (Table 4). We observed small and nonsignificant changes in false-positive rates during the 1st 5 years of practice. Larger but highly variable differences were noted for sensitivity, with no significant changes in PPV1. The false-positive rate increased significantly between years 5 and 9 (OR = 1.63 [95% CI: 1.38, 1.92]) without evidence of a corresponding change in sensitivity or PPV1.
Table 4.
Evaluation of Various Performance Measures according to Radiologists’ Years of Experience for Radiologists with Fellowship Training in Breast Imaging
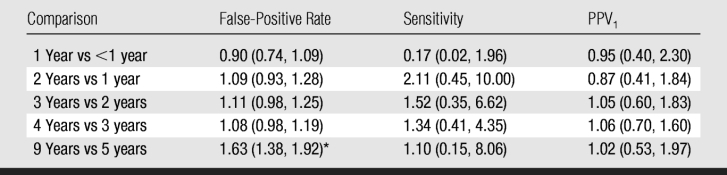
Note.— Data are ORs, with 95% CIs in parentheses. The table shows the within-radiologist effect of a 1-year increase in years of experience on interpretive performance during the 1st 5 years of practice and the within-radiologist effect of a 5-year increase in years of experience on interpretive performance from years 5 to 9. Radiologists could contribute to more than one comparison group. Values are adjusted for patient age, time since last mammographic examination, availability of comparison films, use of CAD, and BI-RADS breast density category.
* Statistically significant difference (P < .05).
Discussion
Radiologists without fellowship training in breast imaging significantly improved in their interpretation of screening mammograms as they gained clinical experience following residency, while radiologists who received fellowship training in breast imaging did not have this learning curve in clinical practice.For radiologists without fellowship training in breast imaging, false-positive rates decreased sharply within the 1st 3 years of clinical practice, without evidence of an associated decrease in sensitivity. This suggests an important learning curve in screening mammogram interpretation as radiologists take several years to establish firmly which mammographic findings do not require additional work-up. In contrast, radiologists with fellowship training in breast imaging met the AHRQ desirable goals for screening mammography performance in their 1st year of practice. The additional training offered in breast imaging fellowships may better prepare radiologists for screening mammogram interpretation than the standard training offered to radiology residents. We note that the AHRQ goals were intended for highly skilled experts in mammography, not community-based general radiologists. Currently, standards for mammographic interpretive performance do not exist in the United States.
Our findings suggest that the current educational system for radiologists who do not undertake fellowship training in breast imaging may lead to unnecessary work-ups in women without cancer, without gains in cancer detection. To improve screening mammography, perhaps continuing medical education should be tailored toward decreasing recall rates early in a radiologist's career or residency training in this area should be improved. Teaching screening mammography skills to residents is difficult for many reasons. Breast cancer is rare in a screening population (five cancers per 1000 women), so residents may see only a handful of cancers during their short rotation of 3–4 months in breast imaging. Therefore, training programs likely emphasize diagnostic mammography, where the cancer detection rate is higher but cancers are likely to be later stage cancers and may appear more obvious on mammograms. Thus, training in diagnostic mammography provides more direct teaching in cancer detection but deemphasizes specificity. In contrast, training in screening mammography would provide a needed emphasis on specificity, given that recall rates are high in this setting. Training to achieve high sensitivity at screening may be provided by means of teaching conferences where selected screening mammograms with masked cancer statuses are reviewed and at which the frequency of screen-detected cancers can be quite high.
Another challenge for residency programs is the difficulty of teaching screening skills in print format. Textbooks and other print training materials show fairly obvious masses and calcifications because these mammographic findings are easy to reproduce in print format. As medical teaching progresses toward an electronic format, teaching residents which subtle mammography findings require recall and which are likely to be benign will hopefully become easier.
Another approach to improve screening mammography performance for recent residency graduates might be to partner these radiologists with more experienced radiologists to review and discuss mammograms in patients whom newer radiologists would like to recall. In addition, radiologists should follow up or receive feedback about the women they recall for additional work-up so that they know the final results (10,25).
Dedicated mammography courses have been shown to improve mammographic interpretation (26). Unfortunately, little research exists on which educational interventions are most effective, and postgraduate courses typically do not focus on screening mammogram interpretation. A recent report by the Macy Foundation (27) called the continuing medical education enterprise “… fragmented, poorly regulated, and uncoordinated” and “highly variable in quality and poorly aligned with efforts to improve quality and enhance health outcomes.”
In terms of how performance changes later in radiologists’ careers, we found that false-positive rates continued to decline, although more slowly, between 10 and 19 years of practice, which suggests that radiologists’ ability to discern cancerous from noncancerous lesions may be continually refined. Perhaps these findings are not surprising, given that the vast majority of mammograms in the United States are interpreted by general radiologists who interpret mammograms as a small percentage of their practice (28). A low annual volume may lengthen the amount of time it takes to gain the experience necessary to accurately identify lesions that require additional work-up, since breast cancer is a rare occurrence in a screening population. The good news is that we did not find evidence of a time point over 25 years of clinical practice when performance for individual radiologists began to decline. We found some evidence that radiologists with 19 or more years of experience had lower false-positive rates at the expense of lower sensitivity compared with their less-experienced counterparts; however, these results are from our population-averaged analysis and thus could be due to multiple factors that vary between radiologists.
Our study underscores the need to understand better how clinicians gain experience. Experience is multifaceted and needs to be defined and measured reliably and reproducibly. In our study, we used years of practice in interpreting mammograms as a measure of experience, but other factors may also increase experience—for example, continuing medical education, specialization in breast imaging, or interpreting a high volume of mammograms. We found that breast imaging fellowships remove the postresidency learning curve. Future studies should examine what aspects of fellowship training improve mammographic interpretation and whether other factors better prepare general radiologists for mammographic interpretation.
Our study had many strengths. We examined the effects of increasing years of breast imaging practice within individual radiologists, instead of comparing groups of radiologists with different years of experience. Another strength is that we examined performance in clinical practice, without having to rely on test sets, which might not accurately reflect clinical performance (29–31). Our detailed clinical information for each patient let us adjust radiologist performance measures for differences in case mix, and the statistical technique of conditional logistic regression controlled for any radiologist-level differences.
Among our study's possible limitations was that it was restricted to radiologists who participated in a mailed survey and who answered a question about their years of experience interpreting mammograms; however, the survey response rate was high, and the interpretive performance of the participants was similar to the performance of the entire BCSC population during the same time period. Second, we could not adjust for whether double reading was performed, as we lacked information at the mammogram level; however, double reading was rare among our study population. In addition, we could not examine whether the learning curve depended on other factors, such as annual interpretive volume, where the radiologist trained, the type of feedback provided, or continuing medical education obtained. While CAD use increased dramatically during the study time period, we were able to adjust for any changes in performance due to the use of CAD in our analysis.
In summary, our study provides, to our knowledge, the first evidence of a learning curve in screening mammogram interpretation among community radiologists without fellowship training in breast imaging. This learning curve is steepest during the 1st 3 years of clinical practice but also appears to continue well into a radiologist's career. Educational interventions, such as academic detailing and interactive case-based continuing education; system-level support, such as double reading with consensus and arbitration; and direct feedback on radiologists’ interpretive performance through audit data may be especially important during the first few years of practice. Improving the accuracy of screening mammogram interpretation would benefit women and the health care system by increasing detection of breast cancers at an earlier stage, when treatment is most successful, and by reducing the number of unnecessary work-ups and biopsies that result in both patient anxiety and increased medical costs.
Advances in Knowledge.
Radiologists without fellowship training in breast imaging significantly improved in their interpretation of screening mammograms as they gained clinical experience, especially during the 1st 3 years after residency.
Radiologists’ performance continued to improve, though to a lesser extent, through 20 years of practice.
For radiologists without fellowship training, the number of women recalled per breast cancer detected dropped from 33 for radiologists in their 1st year of practice to 24 for radiologists with 3 years of experience to 19 for radiologists with 20 years of experience.
Radiologists with fellowship training in breast imaging experienced no learning curve once in clinical practice and reached desirable goals during their 1st year of practice.
Implication for Patient Care.
Improving the accuracy of screening mammogram interpretation for radiologists without fellowship training in breast imaging would benefit women by increasing detection of breast cancers at an earlier stage, when treatment is most successful, and by reducing the number of unnecessary work-ups and biopsies that result in both patient anxiety and increased medical costs.
Acknowledgments
We thank the participating women, mammography facilities, and radiologists for the data they provided for this study. A list of the BCSC investigators and procedures for requesting BCSC data for research purposes are provided at http://breastscreening.cancer.gov/. The collection of cancer data used in this study was supported in part by several state public health departments and cancer registries throughout the United States. A full description of these sources is at http://breastscreening.cancer.gov/work/acknowledgement.html.
Received January 15, 2009; revision requested February 19; revision received April 23; accepted May 8; final version accepted May 25.
Supported by the National Cancer Institute (grants 1R01 CA107623, 1K05 CA104699), the Breast Cancer Surveillance Consortium (grants U01 CA63740, U01 CA86076, U01 CA86082, U01 CA63736, U01 CA70013, U01 CA69976, U01 CA63731, U01 CA70040), the Agency for Healthcare Research and Quality (grant 1R01 CA107623), the Breast Cancer Stamp Fund, and the American Cancer Society, made possible by a donation from the Longaberger Company's Horizon of Hope Campaign (grants SIRGS-07-271-01, SIRGS-07-272-01, SIRGS-07-273-01, SIRGS-07-274-01, SIRGS-07-275-01, SIRGS-06-281-01).
Funding: This research was supported by the National Cancer Institute (grants 1R01 CA107623, 1K05 CA104699), the Breast Cancer Surveillance Consortium (grants U01CA63740, U01CA86076, U01CA86082, U01CA63736, U01CA70013, U01CA69976, U01CA63731, U01CA70040), and the Agency for Healthcare Research and Quality (grant 1R01 CA107623).
Authors stated no financial relationship to disclose.
See also the article by Elmore et al and the editorial by Kopans in this issue.
Abbreviations:
- AHRQ
- Agency for Healthcare Research and Quality
- BCSC
- Breast Cancer Surveillance Consortium
- BI-RADS
- Breast Imaging Reporting and Data System
- CAD
- computer-aided detection
- CI
- confidence interval
- OR
- odds ratio
- PPV1
- positive predictive value of recall
References
- 1.Ramsay CR, Grant AM, Wallace SA, Garthwaite PH, Monk AF, Russell IT. Assessment of the learning curve in health technologies: a systematic review. Int J Technol Assess Health Care 2000;16:1095–1108 [DOI] [PubMed] [Google Scholar]
- 2.Gaster B. A piece of my mind: the learning curve. JAMA 1993;270:1280 [DOI] [PubMed] [Google Scholar]
- 3.Subramonian K, Muir G. The “learning curve” in surgery: what is it, how do we measure it and can we influence it? BJU Int 2004;93:1173–1174 [DOI] [PubMed] [Google Scholar]
- 4.Taylor PM. A review of research into the development of radiologic expertise: implications for computer-based training. Acad Radiol 2007;14:1252–1263 [DOI] [PubMed] [Google Scholar]
- 5.Institute of Medicine Breast imaging quality standards. Washington, DC: National Academies Press, 2005 [Google Scholar]
- 6.Rosenberg RD, Yankaskas BC, Abraham LA, et al. Performance benchmarks for screening mammography. Radiology 2006;241:55–66 [DOI] [PubMed] [Google Scholar]
- 7.Barlow WE, Chi C, Carney PA, et al. Accuracy of screening mammography interpretation by characteristics of radiologists. J Natl Cancer Inst 2004;96:1840–1850 [DOI] [PMC free article] [PubMed] [Google Scholar]
- 8.Elmore JG, Miglioretti DL, Reisch LM, et al. Screening mammograms by community radiologists: variability in false-positive rates. J Natl Cancer Inst 2002;94:1373–1380 [DOI] [PMC free article] [PubMed] [Google Scholar]
- 9.Smith-Bindman R, Chu P, Miglioretti DL, et al. Physician predictors of mammographic accuracy. J Natl Cancer Inst 2005;97:358–367 [DOI] [PubMed] [Google Scholar]
- 10.Miglioretti DL, Smith-Bindman R, Abraham L, et al. Radiologist characteristics associated with interpretive performance of diagnostic mammography. J Natl Cancer Inst 2007;99:1854–1863 [DOI] [PMC free article] [PubMed] [Google Scholar]
- 11.Sickles EA, Miglioretti DL, Ballard-Barbash R, et al. Performance benchmarks for diagnostic mammography. Radiology 2005;235:775–790 [DOI] [PubMed] [Google Scholar]
- 12.Tan A, Freeman DH, Jr, Goodwin JS, Freeman JL. Variation in false-positive rates of mammography reading among 1067 radiologists: a population-based assessment. Breast Cancer Res Treat 2006;100:309–318 [DOI] [PubMed] [Google Scholar]
- 13.Sickles EA, Wolverton DE, Dee KE. Performance parameters for screening and diagnostic mammography: specialist and general radiologists. Radiology 2002;224:861–869 [DOI] [PubMed] [Google Scholar]
- 14.Ballard-Barbash R, Taplin SH, Yankaskas BC, et al. Breast Cancer Surveillance Consortium: a national mammography screening and outcomes database. AJR Am J Roentgenol 1997;169:1001–1008 [DOI] [PubMed] [Google Scholar]
- 15.Ernster VL, Ballard-Barbash R, Barlow WE, et al. Detection of ductal carcinoma in situ in women undergoing screening mammography. J Natl Cancer Inst 2002;94:1546–1554 [DOI] [PubMed] [Google Scholar]
- 16.Elmore JG, Jackson SL, Abraham L, et al. Variability in interpretive performance at screening mammography and radiologists’ characteristics associated with accuracy. Radiology 2009;253:###–###. [DOI] [PMC free article] [PubMed] [Google Scholar]
- 17.Carney PA, Geller BM, Moffett H, et al. Current medicolegal and confidentiality issues in large, multicenter research programs. Am J Epidemiol 2000;152:371–378 [DOI] [PubMed] [Google Scholar]
- 18.American College of Radiology American College of Radiology Breast Imaging Reporting and Data System Atlas. Reston, Va: American College of Radiology, 2003 [Google Scholar]
- 19.BCSC Glossary of Terms. http://breastscreening.cancer.gov/data/bcsc_data_definitions.pdf Accessed April 22, 2009
- 20.Neuhaus JM, Kalbfleisch JD, Hauck WW. A comparison of cluster-specific and population-averaged approaches for analyzing correlated binary data. Int Stat Rev 1991;59:25–35 [Google Scholar]
- 21.Zeger SL, Liang KY, Albert PS. Models for longitudinal data: a generalized estimating equation approach. Biometrics 1988;44:1049–1060 [PubMed] [Google Scholar]
- 22.Liang KY, Zeger SL. Longitudinal data analysis using generalized linear models. Biometrika 1986;73:13–22 [Google Scholar]
- 23.Breslow NE, Day NE. Statistical methods in cancer research. Vol 1, The analysis of case-control studies Lyon: International Agency for Research on Cancer, 1980 [PubMed] [Google Scholar]
- 24.U.S. Department of Health and Human Services Quality determinants of mammography. Rockville, Md: Agency for Health Care Policy and Research, 1994 [Google Scholar]
- 25.Molins E, Macia F, Ferrer F, Maristany MT, Castells X. Association between radiologists’ experience and accuracy in interpreting screening mammograms. BMC Health Serv Res 2008;8:91 [DOI] [PMC free article] [PubMed] [Google Scholar]
- 26.Linver MN, Paster SB, Rosenberg RD, Key CR, Stidley CA, King WV. Improvement in mammography interpretation skills in a community radiology practice after dedicated teaching courses: 2-year medical audit of 38,633 cases. Radiology 1992;184:39–43 [DOI] [PubMed] [Google Scholar]
- 27.Fletcher SW. Chairman's summary of the conference. In Hager M, ed. Continuing education in the health professions: improving healthcare through lifelong learning, Nov 28 to Dec 1, 2007 Bermuda, New York: Josiah Macy, Jr Foundation, 2008 [DOI] [PubMed] [Google Scholar]
- 28.Lewis RS, Sunshine JH, Bhargavan M. A portrait of breast imaging specialists and of the interpretation of mammography in the United States. AJR Am J Roentgenol 2006;187:W456–W68 [DOI] [PubMed] [Google Scholar]
- 29.Gur D, Bandos AI, Cohen CS, et al. The “laboratory” effect: comparing radiologists’ performance and variability during prospective clinical and laboratory mammography interpretations. Radiology 2008;249:47–53 [DOI] [PMC free article] [PubMed] [Google Scholar]
- 30.Gur D, Bandos AI, Klym AH, et al. Agreement of the order of overall performance levels under different reading paradigms. Acad Radiol 2008;15:1567–1573 [DOI] [PMC free article] [PubMed] [Google Scholar]
- 31.Rutter CM, Taplin S. Assessing mammographers’ accuracy: a comparison of clinical and test performance. J Clin Epidemiol 2000;53:443–450 [DOI] [PubMed] [Google Scholar]