Abstract
Tyrosine phosphorylation, controlled by the coordinated action of protein-tyrosine kinases (PTKs) and protein-tyrosine phosphatases (PTPs), is a fundamental regulatory mechanism of numerous physiological processes. PTPs are implicated in a number of human diseases and their potential as prospective drug targets is increasingly being recognized. Despite their biological importance, until now no comprehensive overview has been reported describing how all members of the human PTP family are related. Here we review the entire human PTP family and present a systematic knowledge-based characterization of global and local similarity relationships, which are relevant for the development of small molecule inhibitors. We use parallel homology modeling to expand the current PTP structure space and analyze the human PTPs based on local three-dimensional catalytic sites and domain sequences. Furthermore, we demonstrate the importance of binding site similarities in understanding cross-reactivity and inhibitor selectivity in the design of small molecule inhibitors.
Keywords: Tyrosine dephosphorylation, phosphatases, tyrosine phosphatome, phosphatase inhibitors, structure-based drug design, sequence similarity, catalytic binding site similarity
INTRODUCTION
Tyrosine phosphorylation is involved in the regulation of many physiological processes, including growth, proliferation and differentiation, metabolism, cell cycle regulation and cytoskeletal function, cell-cell interactions, neuronal development, gene transcription, and the immune response.1–6 The levels of cellular protein tyrosine phosphorylation are regulated by the coordinated action of protein-tyrosine phosphatases (PTPs) and kinases (PTKs).1,5 Until recently, PTKs were considered to be the main enzymes regulating tyrosine phosphorylation and huge progress has been made over the last 20 years in clarifying their significance in signal transduction.7–9 Today, beyond kinases, PTPs are recognized as critical regulators of signal transduction.10 The ability of PTPs to dephosphorylate phosphotyrosine residues selectively on their substrates plays an important role in initiating, sustaining and terminating cellular signaling.5 Several studies have shown that the diversity of functions for the PTPs match those of the PTKs.11,12
Malfunction of the PTP activity is related to a number of human diseases, ranging from cancer to neurological disorders and diabetes. The diversity of cellular functions regulated by PTPs and their implications in human diseases suggest that PTPs are prospective drug targets.12–14
The human genome contains 107 PTPs.15,16 Based on the catalytic mechanism of dephosphorylation the PTPs can be grouped into two separate families, Cys-based family comprising 103 members and Asp-based family comprising four members. The Cys-based PTPs, which are the focus of the present study, can be further divided into four major classes: classical PTPs, dual-specificity PTPs (DUSPs), cdc25 PTPs and low-molecular weight (LMW) PTPs.
Although protein similarities and classification are generally anticipated by sequence similarity, three-dimensional structures tend to be more conserved than sequences and are essential for the functional properties of proteins.17–19 In enzymes, the protein substrate recognition occurs at structurally conserved and specific binding sites. Hence structural features of the catalytic sites define protein function. Several studies show that comparative sequence analyses should be combined with other approaches (such as genomic and proteomic analyses) to fully understand structure, function and evolution of protein families.20,21
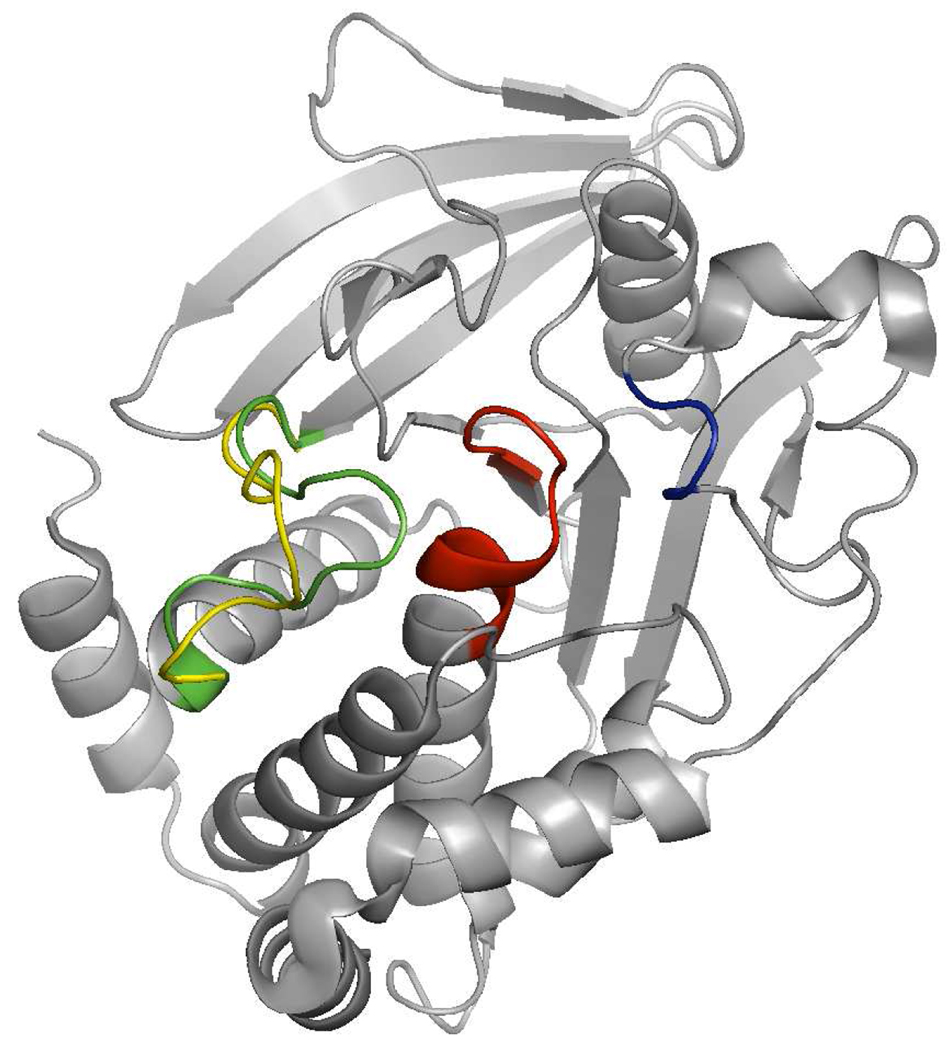
PTPs utilize the active site signature (H/V)C(X)5R(S/T) motif in the conserved PTP catalytic domain to hydrolyze phosphoester bonds in protein and non-protein substrates.22,23 This structure motif is called PTP loop (red loop in Figure 1). Key features of the domain also include the phosphotyrosine recognition loop (blue loop in Figure 1) and the WPD loop that occurs in two conformations, open and closed (Figure 1, yellow and green loops, respectively). In the native form the WPD loop is in an open conformation, and the binding pocket is easily accessible to substrate. Upon substrate binding, the WPD loop closes over the active site, forming a tight binding pocket for the substrate.24,25 In the active, closed form the Asp residue from WDP loop is in position to act as a general acid/base catalyst in the dephosphorylation reaction.26 Furthermore it has been shown that the catalytic activities of the PTPs are influenced by the flexibility and stability of the WPD loop in its active form.27,28
Figure 1.
Structural features of PTP catalytic domain. Substrate recognition loop in blue, PTP loop in red, flexible WPD loop in either open or closed position in yellow and green, respectively.
The PTP binding site is highly polar with the deprotonated thiol anion of the catalytic cysteine acting as a nucleophile. Such binding environment favors polar binders and it is therefore one of the challenges in developing useful compounds to balance inhibitory activity with cellular permeability.
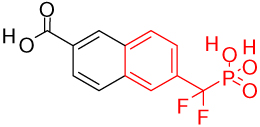
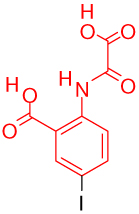
One key component in the design of PTP inhibitors is a hydrolytically stable phosphotyrosine or phosphate mimic as a "head" group. Several classes of mimics have been reported29, including the difluoromethylenephosphonates, sulfamic acid, and benzoic acids such as 2-(oxalylamino)-benzoic acids, salicylic acids, and its derivatives. Various PTP inhibitor co-crystal structures with these types of head groups have been reported. Table 1 shows potent representative PTP1B inhibitors with different head groups and their corresponding PDB codes.
Table 1.
Typical phophatase inhibitor "head" groups. Representative potent PTP1B inhibitors and the PDB codes of their co-crystal structures and co-crystal structures of their analogs with the same head group are shown.
| Head group in co-crystallized ligands | PDB codes of similar ligands |
|---|---|
 |
1bzc, 1kak, 1kav, 1lqf, 1pxh, 1q6j, 1q6m, 1q6n, 1q6p, 1q6s, 1q6t, 2fjn |
| difluoromethylenephosphonate (1bzj)30 | |
 |
1c83, 1c84, 1c85, 1c86, 1c88, 1gfy, 1l8g, 1wax |
| 2-(oxalylamino)-benzoic acid (1ecv)31 | |
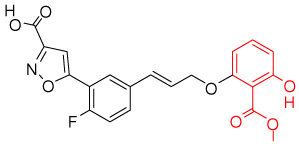 |
1g7g, 1jf7, 1qxk, 1xbo |
| salicylic acid and derivatives (1q1m)32 | |
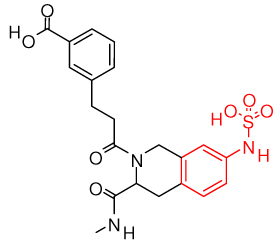 |
2f6v, 2f6y, 2f6z, 2f70 |
| phenyl sulfamic acid (2f71)33 | |
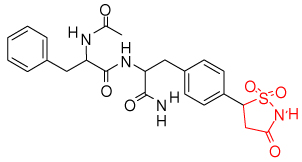 |
2bgd, 2bge, 2cma, 2cmb, 2cm8, 2nta, |
| isothiazolidinone (2cm7)34 |
To date most of the studies related to PTPs were performed on sequences of classical phosphatases5,16 and PTP1B in particular.12,30,35,36 Here we represent a comprehensive comparative analysis of the catalytic domain sequences and the three-dimensional catalytic sites of the entire human Cys-based PTP protein family. Experimental small molecule inhibition data illustrate that similarities of the catalytic site can reflect a PTP's propensity for selectivity and promiscuity. Local three-dimensional site similarity can be a first-order structure-based assessment to identify most similar targets, which are likely to show cross reactivity towards a small molecule inhibitor and therefore should be tested experimentally during lead optimization.
MATERIALS AND METHODS
Human PTP Gene Family
In order to compile a PTP gene list we searched literature15 and gene databases37–39 and retrieved 105 genes encoding human PTPs. Among them two are pseudogenes, PTPN20C and PTPRV. PTPN20A and PTPN20B are coded by the same chromosome and therefore have the same domain sequence. After eliminating redundant genes the final list assembles 102 human PTP genes with 37 genes encoding classical PTPs, 61 genes encoding DUSPs, three genes for the cdc25 PTPs and one for the LMW PTP. Classical PTPs are further divided into the classical receptor type phosphatases and classical non-receptor type phosphatases. DUSPs comprise several subtypes: map kinase phosphatases (MKPs), atypical DUSP, slingshots, myotubularins, PRLs, CDC14s, and PTENs. The list of 102 human PTP genes is given in the supporting material along with the protein names (Table S1). Here we rather refer to a phosphatase by the corresponding gene annotation.
PTP Sequences and Domains
Based on the identified gene list we have constructed a database with the PTP domain sequences from SWISS-PROT.38 A core SWISS-PROT data record consists of sequence data, citation information and taxonomic data, while the annotation consists of a description of the function of the protein, post-translational modifications, domains and sites (for example calcium binding regions, PTP catalytic sites, zinc fingers), similarities to other proteins, diseases associated with deficiency of the protein, etc. Some of these annotations are derived from other database, which are linked based on controlled vocabulary (and unique IDs) each describing an important piece of biological complexity. Most entries in Swiss-Prot have a cross-reference to Pfam or InterPro.
Pfam and InterPro are large collections of protein families and domains. 40–42 The human PTPs have different domains depending on the PTP types and subtypes. In the present study we use the InterPro domain annotation since it is the most comprehensive for PTP domains. However some of the InterPro annotated catalytic domains are remarkably shorter and do not contain the catalytic site (signature motif). In these cases we alternatively use the SWISS-PROT annotation where the PTP domains comprise the catalytic site. This was the case for CDC14A, CDC14B, RNGTT, PTPM1, AUXI, TENC1, TPTE, TPTE2, MTM1, MTMR1, MTMR2, MTMR3, MTMR4, MTMR5, MTMR6, MTMR7, MTMR8, MTMR9, MTMRA, MTMRB, MTMRC, and MTMRD. For myotubularin MTMR14 there was no annotated domain in any of the databases. In order to determine a PTP domain for MTMR14 we aligned its sequence to the sequences of other myotubularins using Clustal W.43 After verifying that the domains and catalytic sites of other myotubularins were properly aligned we extracted the analogous domain for MTMR14 phosphatase. MTMR15 has one annotated domain, VRR_NUC, which is not a PTP domain and the alignment to other myotubularins did not indicate the catalytic region. MTMR15 was therefore excluded from the further analysis resulting in a total of 101 PTP genes considered in this study. For tensine like PTPs, TENS1 and TENS3 (no annotation), the domain sequence was retrieved from the literature.44
Some of the classical receptor phosphatases have two cytoplasmic PTP domains, a membrane proximal domain (D1) and a membrane distal domain (D2). In total, we collected 113 PTP annotated domains for this study; one PTP domain for each PTP plus distal PTP domain for classical receptor phosphatases with two PTP domains.
Sequence Similarities and Identities
Pair-wise alignments and similarities of the 113 human PTP domain sequences were calculated by the Needleman-Wunsch (NW) algorithm45 (Blosum62 substitution matrix, gap penalty 10, gap extension penalty 0.5). NW uses dynamic programming to identify an optimum global alignment as the best pathway through a scoring matrix representing the two sequences to be aligned and which is constructed by optimizing the alignment score of successively increasing sequence segments.
Homology Modeling
The STRUCTFAST46 algorithm implemented in the Target Informatics Platform (TIP) software system39,47 was used to generate homology models for all PTP sequences against a number of templates (see below). STRUCTFAST is an automated profile-profile database search algorithm capable of detecting weak similarities between protein sequences. Multiple sequence alignment profiles are used for both the query and primary template sequence. The query sequence profiles are generated with a modified version of the PSI-BLAST algorithm. A database of profiles for template representatives from the PDB48 is generated in a similar manner, but incorporating information from structure–structure alignments derived from the template protein’s structural family. A query profile is aligned and scored against the library of structural profile templates and the alignments are ranked by the significance of their scores using Convergent Island Statistics. STRUCTFAST uses dynamic programming to incorporate gap information from the structural family directly into the alignment process. Because of rigorous analytical treatment of the profile-profile scores, STRUCTFAST scoring function includes no parameters to optimize.
The PTP models where build using a TIP database including the entire PDB database as of June 15, 2008 including 229 PTP structures. The PTP domain sequences were loaded into the TIP sequence database to generate models corresponding exactly to the defined PTP domains. The primary templates from which to derive the alpha carbon coordinates of the PTP STRUCTFAST models were selected as described in the following.
PTP Primary Structure Templates
To select suitable templates for homology modeling we explore the PDB data bank. There are more than two hundred structures of the human PTPs deposited in PDB, but about one hundred for PTP1B alone (corresponding gene annotated as PTPN1).
The primary criterion for selection was the active form of the corresponding PTP crystal structure, which is determined by the closed conformation of the WPD loop (see Figure 1.). However, for most of the phosphatases there is no experimental structure available and not all deposited PTP crystal structures are in the active form. Indeed only 26 PTPs have at least one crystal structure with the active WPD loop conformation. If a phosphatase has several structures in the active form, the one with the highest resolutions was kept as a template.
Some PTP types such as cdc25 phosphatases and myotubularins do not have the WPD loop and therefore exist in only one form. It is not quite clear which residue replaces the aspartic acid from the WPD loop and reacts as a general acid in the catalytic reaction of such PTPs. Some previous studies have shown that the general acid residue perhaps can be a part of the catalytic (H/V)C(X)5R(S/T) loop.49,50 The side chain conformation of such a residue would therefore define an active form for these phosphatases. However, the PDB crystal structures of MTMR2 and cdc25A are available and were used as templates for modeling PTPs without the WPD loop.
For PTPs that are structurally undetermined we compared their domain sequence similarities to the 26 selected templates. The crystal structure with the highest sequence similarity was defined as the primary template for generating a model of the corresponding phosphatase domain. The primary templates are listed in Table 2 along with their gene symbol and the resolution of the crystal structure. In addition Table S2 in the supporting material shows model to template identities.
Table 2.
List of PDB structures used as templates in homology modeling.
| Template PDB | Template | Resolution | Template PDB | Template | Resolution |
|---|---|---|---|---|---|
| code | PTP | code | PTP | ||
| 2f71A | PTPN1 | 1.55 | 1wrmA | DUSP22 | 1.5 |
| 2h02A | PTPRB | 2.3 | 1vhrA | DUSP3 | 2.1 |
| 2ooqA | PTPRT | 1.8 | 2imgA | DUSP23 | 1.9 |
| 2g59A | PTPRO | 2.19 | 2pq5A | DUSP13B | 2.3 |
| 2i1Ya | PTPRN | 2.23 | 2esbA | DUSP18 | 2 |
| 1ygrA | PTPRC | 2.9 | 1yz4A | DUSP15 | 2.4 |
| 1wchA | PTPN13 | 1.85 | 1oheA | CDC14B | 2.2 |
| 2g6zA | DUSP5 | 2.7 | 1xm2A | PTP4A1 | 2.7 |
| 1d5rA | PTEN | 2.1 | 1fpzA | CDKN3 | 2 |
| 1zzwA | DUSP10 | 1.6 | 1wvhA | TNS1 | 1.5 |
| 2nt2A | SSH2 | 2.1 | 1zsqA | MTMR2 | 1.82 |
| 2r0bA | STYX | 1.6 | 5pntA | ACP1 | 2.2 |
| 2e0tA | DUSP26 | 1.67 | 1c25A | cdc25A | 2.3 |
Because we expect the catalytic site in a homology model to be related to the tree-dimensional template structure, in many cases we generated several models based on different primary templates. This is to estimate (or minimize) a template bias that may be introduced into the models, but also to incorporate structural flexibility defined implicitly by different experimental structures. These additional primary templates were selected from the 26 candidate structures based on succeeding sequence similarity. Since most of the available experimental structures belong to the classical PTPs and DUSPs we generated more models for these two PTP types.
Definition of the Catalytic (Binding) Sites
Once the homology models were generated the local sites of interest were defined. For each template model (in a "template models" the PTP domain sequence corresponds to the crystal structure template and they are therefore very close or identical to the original template PDB structure) the initial site was defined as a set of solvent accessible residues within 10 Å around the catalytic cysteine. The site was further manually corrected by adding or removing residues that can still interact with a virtual ligand. For example, residues that belong to the inner area under a tangent on the protein surface are defined as a part of the catalytic site (tangent starts at the binding pocket). Residues outside this area were removed from the site even if they are proximate to the binding pocket. After defining the template sites, the corresponding models were aligned to their template model and the model binding sites were defined based on their matching residues. The so defined sites were in addition visually inspected for accuracy.
Calculation of Site Similarities
The SiteSorter algorithm implemented in the TIP software system computes pair-wise 3D similarities between sites. This is performed in three steps: 1) the two sites are described as graph representations, 2) the optimal overlay of the two sites is determined by optimizing the overlap score between the two site graphs, 3) the physiochemical similarity of the two optimally overlaid sites is scored. The SiteSorter algorithm is similar to Klebe’s approach51 in which sites are represented as collections of surface points and edges, which are inputs to a clique detection algorithm52 that determines the best site overlay as the maximum complete subgraph. However, SiteSorter in addition takes into account the orientation of each surface point with respect to the pocket opening. The similarities of each of the matching surface points are described as a continuum of scores and a weighted clique detection algorithm is used. An overlay score can be derived for any given orientation of the two graph surfaces considering distance and angle constraints of the corresponding surface points. The best overlaid sites are then scored based on chemical group similarity incorporating site chain and backbone atoms. These (raw) chemical scores are further normalized in the Tanimoto-like definition: SABnormalized = SAB/(SAA+SBB-SAB) where SAB is the raw value for the site similarity between sites A and B, SAA and SBB are self-site similarities for site A and site B, respectively. We use this normalized site similarity measure in our analyses. For pairs where no site overlay score was generated due to dissimilarity between sites we assigned a site similarity value zero.
Cluster Analysis
Domain sequence similarities and local (3D) site similarities were classified by the hierarchical clustering using the Spotfire Decision Site software.53 Minimum Spanning Trees (MST) were generated by Kruskal’s algorithm54 and visualized by Cytoscape (force-directed layout, weighted by similarity).55
Structural Model Alignment
After defining the template catalytic sites, structural alignment of the PTP models to their corresponding template model was performed using Schrödinger's Protein Structure Alignment program.56
Structure Visualization
PyMOL57 was used for visualizing PDB structures, models, and binding sites and also for defining the template binding sites.
Workflows
We used Scitegic Pipeline Pilot58 collection of components for data retrieval, filtering, and analysis.
SAR Data
The literature and PDB database was searched for known PTP inhibitors. We collected a moderately large list of small co-crystallized PTP1B inhibitors and their analogs that show reasonable potency against a set of different classical PTPs.31,35,59–62
RESULTS AND DISCUSSION
The global trend of phosphatase site vs. sequence similarities
In the present study we generated models for 113 domain sequences representing 101 PTPs (retrieved from the SWISS-PROT database, domains annotated by InterPro or SWISS-PROT) as described in the methods section. 455 models were generated using as primary templates the 26 different PTP structures in the active conformation that are available in the PDB; at least one model was generated for each of the 113 PTP sequences. The binding sites were defined as a set of residues within 10 Å around catalytic cysteine considering the solvent-accessible surface. Pair-wise site similarities were calculated following three-dimensional site overlay using a scoring function based on surface chemical features as described in the methods. The site similarity value depends on the size of the site, because larger sites can have a larger overlaid surface. Although the sites are reasonably similar in size (PTPs, 10 Å around the catalytic residue) we normalized the raw site similarity score using a Tanimoto-type definition after calculating the chemical site similarity of each site against itself. A correlation plot of normalized vs. raw site similarities is given in the supporting information (Figure S1). We observed more robust clustering of the normalized site similarities compared to the raw chemical scores.
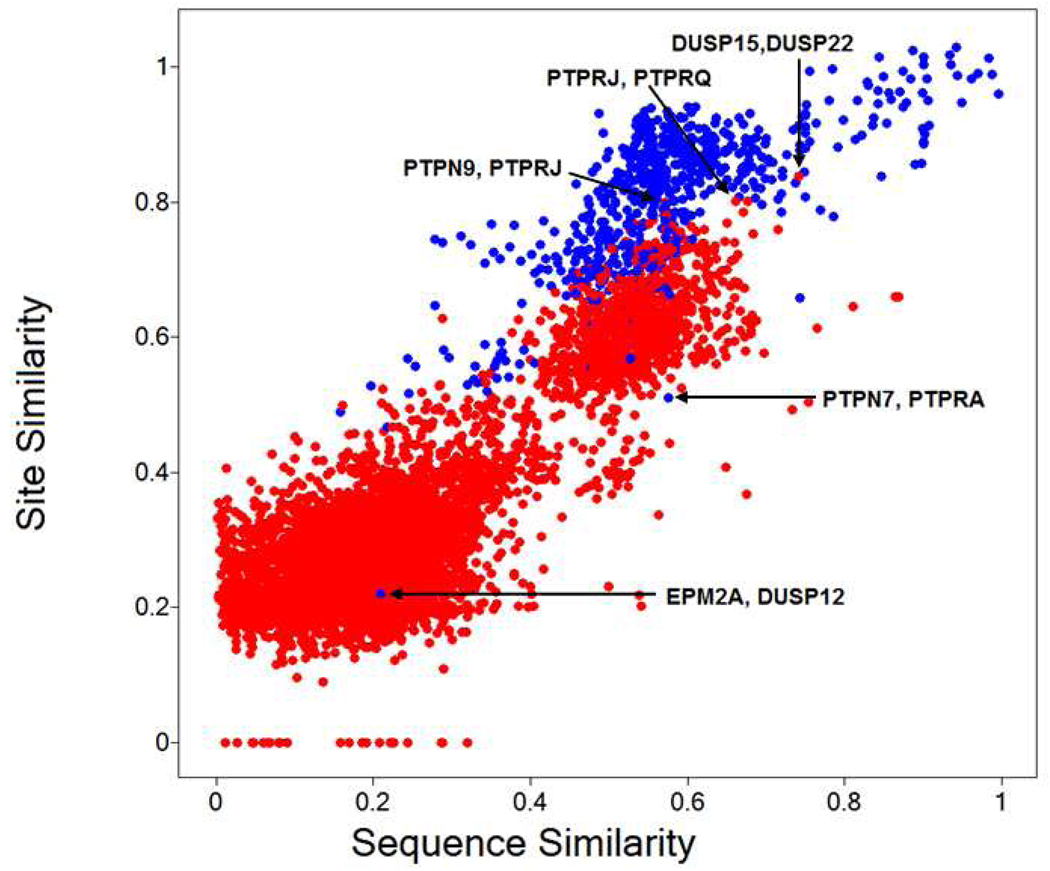
For most PTP domains multiple models were generated based on different primary templates and therefore each PTP can be characterized by different (catalytic) sites, which can lead to slightly different site similarity values for any given PTP domain pair. For the analysis presented here we used the sites emerging from best models (highest identity to model template; in case of several template candidates the model based on the highest resolution structure is used). Figure 2 shows a scatter plot of catalytic site similarity vs. domain sequence similarity for each PTP pair based on the currently modelable PTPs. All PTP domain sequence pairs were aligned using the NW algorithm to compute sequence similarity and sequence identity values. The average site similarities as well as the maximum site similarities between PTP pairs (which may provide a conservative estimate of the propensity of a pair of PTPs being similar around their catalytic site) are given in the supporting material (Figure S2). We also illustrate site similarities vs. sequence identities and histograms of the different similarity and identity measures to visualize their global distributions ( supporting Figures S3, and S4).
Figure 2.
Correlation of normalized site similarities and sequence similarities for all PTP combinations. Blue dots represent site pairs corresponding to models based on the same primary template, while for red data points the templates are different.
Qualitatively, Figure 2 illustrates that PTPs of high sequence similarity also have very similar catalytic sites while there is more variability of site similarities among pairs of lower and average similar sequences. This general trend also holds for average and maximum site similarities and in particular for sequence identities (supporting Figures S2 and S3). From Figure 2 and the histograms (supporting Figure S4) one can identify highly site-similar PTP pairs that correspond to lower sequence similarities; this is relative to the mode of the main sub-populations of the two similarity distributions and thus not an artifact of the different scaling of the measures. PTP pairs modeled from the same primary template structure show on average higher site similarities compared to those based on different templates. This is expected because pairs of models based on the same template also have on average higher sequence similarities (sharing higher identity to their template means that they are more similar to each other as well; the average identity of PTP pairs is shown in supporting Figure S5). But also there may be a bias introduced by the specific conformation of the template structure. However, the results should be viewed as our current stage of knowledge, based on the available structural body of the PDB. The vast majority of models are well within or above the required template identity to generate reliable homology models for the purpose of comparing sites18 - in particular for the profile-profile STRUCTFAST method used here.46,63 We can expect this picture to further be refined as more structures become available. Nevertheless, in a more detailed analysis we can identify highly site-similar PTP pairs based on different templates (for example, PTPRJ and PTPRQ, PTPN9 and PTPRJ, DUSP15 and DUSP22) and also pairs of low site similarity modeled from the same template (for example PTPN7 and PTPRA, EPM2A and DUSP12). We therefore conclude that the template bias is relatively small.
Categorization of PTPs based on site and sequence similarities
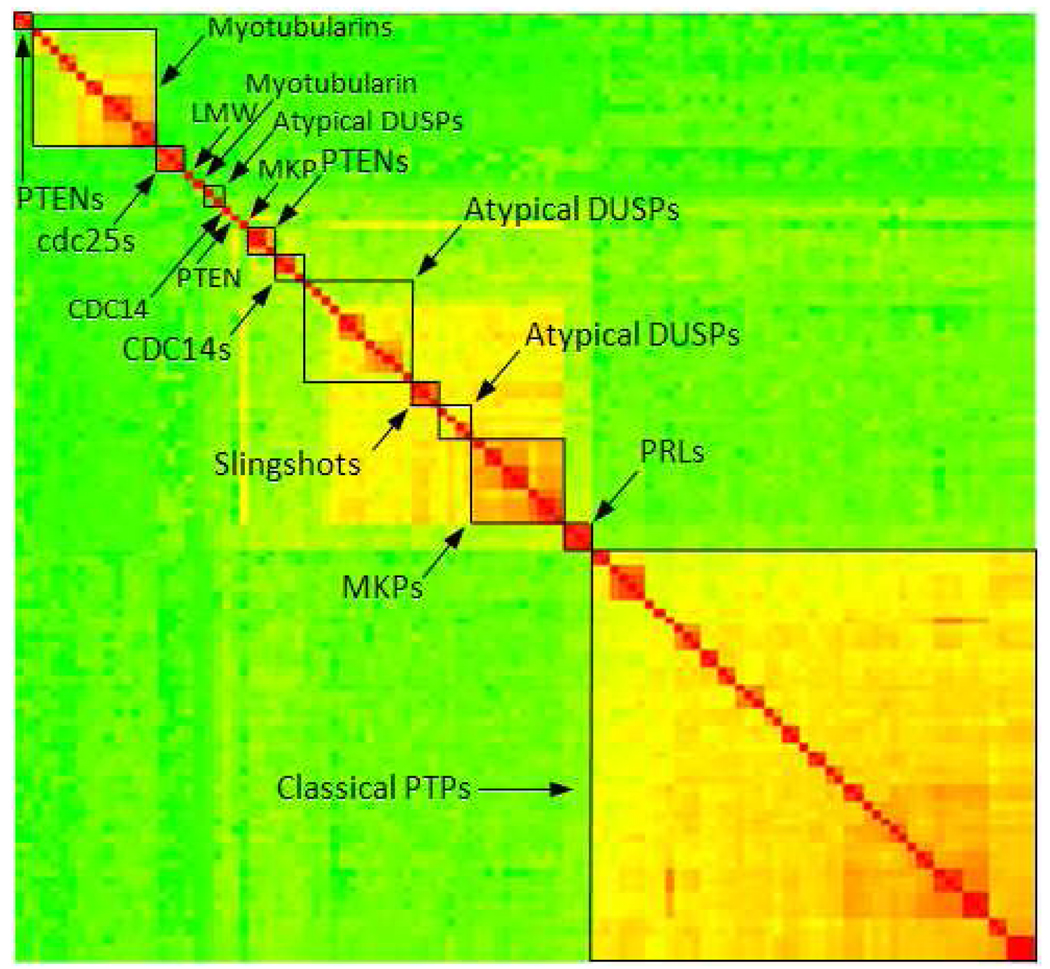
In addition to a global trend and direct comparison of individual PTPs we were also interested in identifying major and local groupings. We performed hierarchical clustering of the 113 PTP domains based on sequence- and site similarity matrices.Figure 3 shows the PTP domain groups in sequence space. The PTPs were hierarchically clustered using single linkage and the Euclidean distance of the sequence similarity vectors.
Figure 3.
Hierarchical clustering of human PTP domain sequences. Highest similarity is colored in red, medium in yellow and low similarity colored in green.
Several large clusters are evident. As expected all classical PTPs group together (lower right corner). The DUSPs are separated in two large groups. One (in the central part of the heat map) comprises atypical DUSP, MKPs, PRLs, slingshots, CDC14s and several PTENs. The other DUSP group (in the upper left corner) comprises all myotubularins and two remaining PTENs. These two DUSP groups are separated by two small clusters, one containing three cdc25s and one with the single LMW PTP. Based on sequences the DUSPs thus represent a very diverse group of PTPs with some discontinuous subtypes. Within the large cluster of DUSPs the different subtypes are mostly grouped together. The exceptions are STYXL1, which does not cluster with the rest of MKPs, CDKN3, which falls outside of the CDC14 cluster, and the atypical DUSPs which are separated into two fairly close sub-group. The relatively small sets of three slingshots and three PRLs form clusters including all their respective members.
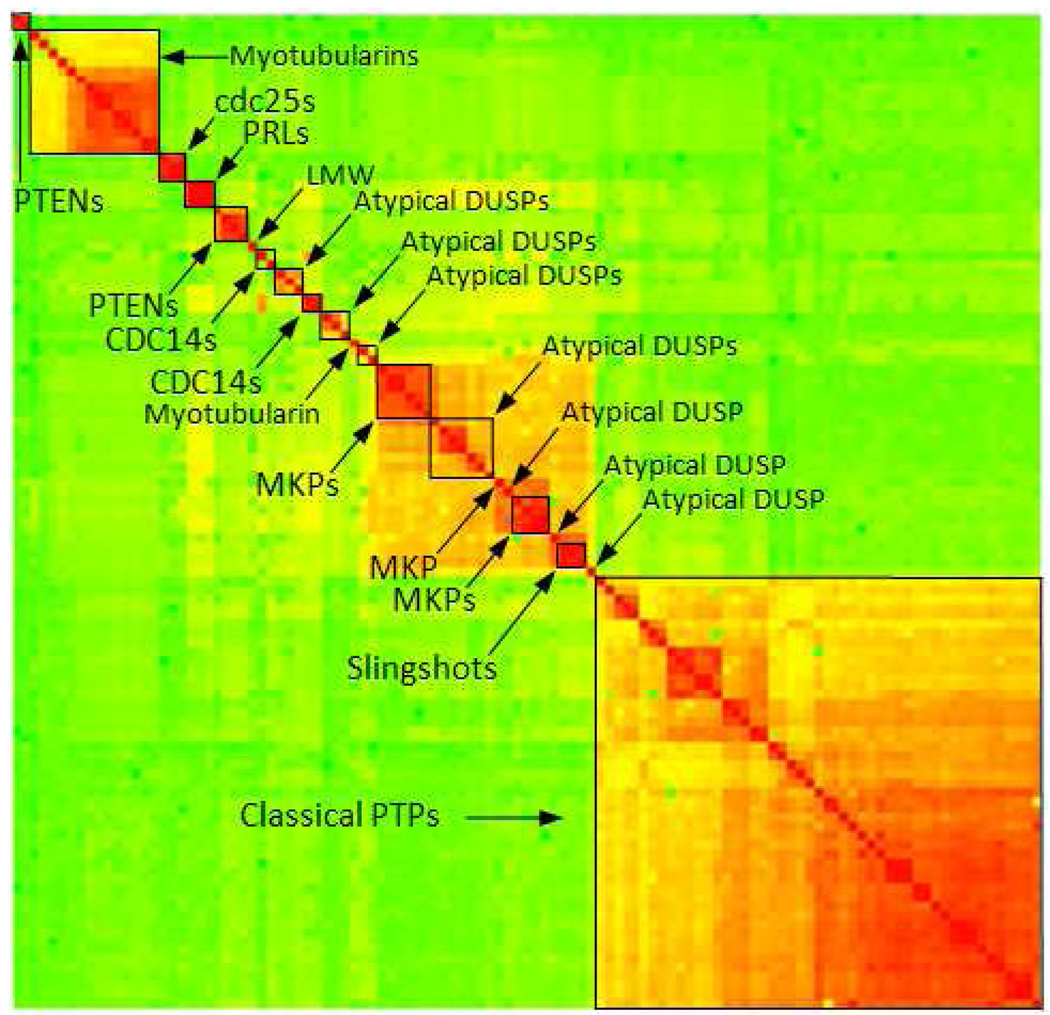
A similar clustering analysis was performed using site similarity vectors as a distance measure. As before, from the ensemble of catalytic sites corresponding to each domain sequence we selected the one that corresponds to the best model based on template identity. Results are shown in Figure 4.
Figure 4.
Hierarchical clustering of catalytic site similarities of human PTPs. Highest similarity is colored in red, medium in yellow and low similarity in green.
The major groupings that are obtained based on site similarities closely reflect sequence-based clustering. The same major clusters emerge when using ensemble average or maximum pair-wise site similarities. However, in contrast to sequence space the members within the major groups - and in particular the classical PTPs - appear much closer. This is consistent with our earlier observation of highly site-similar PTP pairs that correspond to lower sequence similarity; but here we can clearly identify the clusters of the closest PTPs based on site similarities. Similar to sequence space, in site space the DUSPs occupy the middle section of the map but its sub-groups are less continuous. The MKPs form two distinct clusters and the atypical DUSPs are split into many separate groups. However the central cluster of MKPs and some of the atypical DUSPs is more pronounced compared to site space. Although the major PTP groupings in site space are comparable to those in sequence space, the sub-groupings among classical PTPs and DUSPs are different. Here we provide several examples for DUSPs while classical PTPs are discussed in more detail in the next section. Several larger clusters evident from the DUSP sequence clustering are not present in the DUSP site clustering. For example in sequence space all MKPs belong to one cluster except STYXL, which forms a singleton. In site space STYXL is also isolated from the subtype members, but the other MKPs split into two clusters, containing DUSP1, DUSP2, DUSP4, DUSP5, and DUSP6, DUSP7, DUSP8, DUSP9, DUSP10, DUSP16 respectively. Two large atypical DUSP clusters (separated by slingshots) in sequence space exchange their members split into several smaller clusters and singletons in site space. For the CDC14 subtype, in sequence space CDC14A, CDC14B, PTPDC1 form one cluster and CDKN3 is isolated from the group, while in site space CDC14A and CDC14B belong to one cluster and CDKN3 and PTPDC1 form a separate cluster. The PTENs are grouped better in site space where PTEN, TENC1, TPTE, and TPTE2 form one cluster, while TENC1 is isolated in sequence space. Therefore, PRLs and slingshots present the only DUSP subtypes with preserved grouping (all members group together) in both spaces while all other (and in particular the atypical) DUSP are separated into smaller clusters or individual targets. This fragmentation of the subtype groups is more distinct in site space. While the major PTP groupings that emerge in sequence vs. site space are closely related, our detailed analysis shows that domain sequence-based categorization does not reflect the similarity relationships derived from comparing three-dimensional catalytic sites. Principle component analysis (supporting Figure S6) suggests the same conclusion (similar major, but different local groupings).
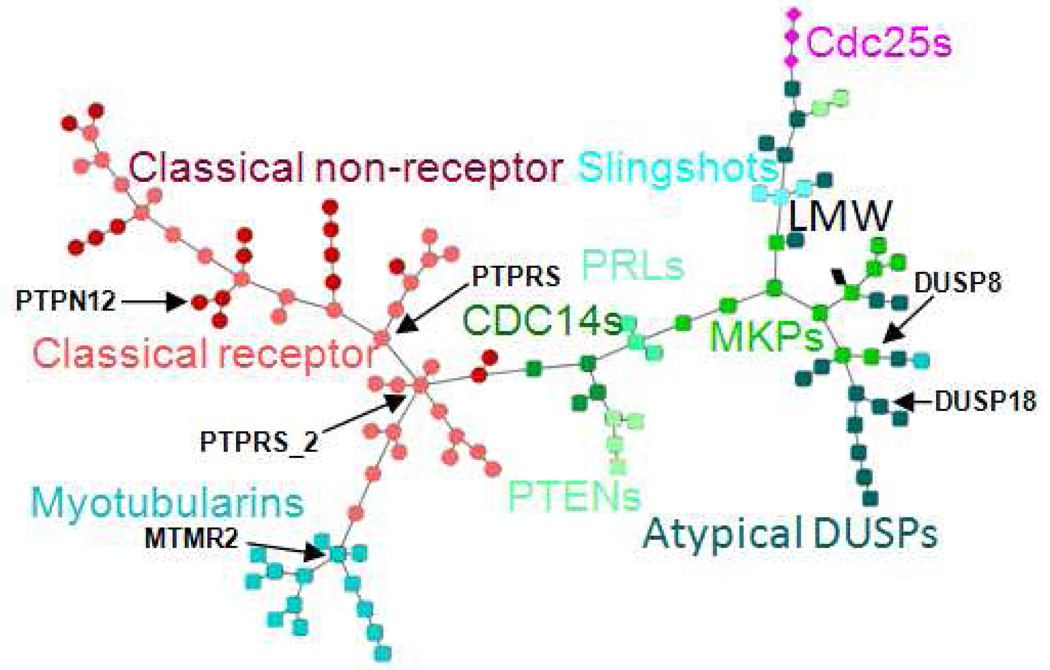
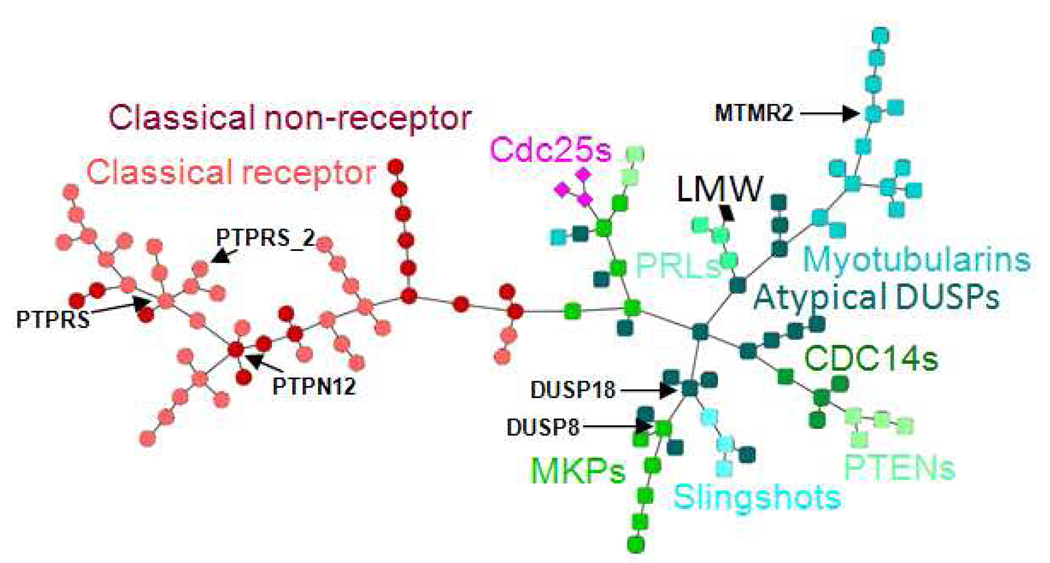
In addition to hierarchical clustering we also visualized the similarity relationships among the PTP family members as networks. MSTs for both sequence and site similarities were computed and visualized as described in the methods (Figure 5 and Figure 6). In contrast to hierarchical clustering where the distance of two PTPs is measured based on their similarities to all other PTPs, the MST is constructed based on the individual similarity of a PTP and its joining neighbor. It is therefore in particular suitable for analysis of local relationships.
Figure 5.
Sequence similarity network of human PTP domains. Nodes are colored by PTP subtypes.
Figure 6.
Site similarity network of human PTPs. Nodes are colored by PTP subtypes.
The network tree representations intuitively illustrate how the majority of the members of each of the PTP subtypes - except the atypical DUSP - group together in sequence as well as site space. Despite the similar groupings by subtype, the sequence and site similarity network trees reveal differences, which may have important implications for the development of selective inhibitors. In particular local neighborhoods, node connectivity and hubs (nodes with many neighbors) are different in sequence vs. site space. For example, there are only two nodes with at least five neighbors in the sequence MST (MTMR2 and the distal domain of PTPRS annotated by PTPRS_2); in the site MST these correspond to nodes with three and one neighbor. In contrast there are four PTPs with at least five neighbors (PTPRS, PTPN12, DUSP8, and DUSP18) in the site MST (Figure 6), but with fewer neighbors in the sequence MST (three, one, two, and one, respectively, Figure 5). Phosphatases with many neighbors - specifically in the site similarity tree - may be particularly challenging drug targets, because the development of selective inhibitors can be complicated by the presence of many closely related PTP "off-targets".
Detailed Analysis of Classical PTPs
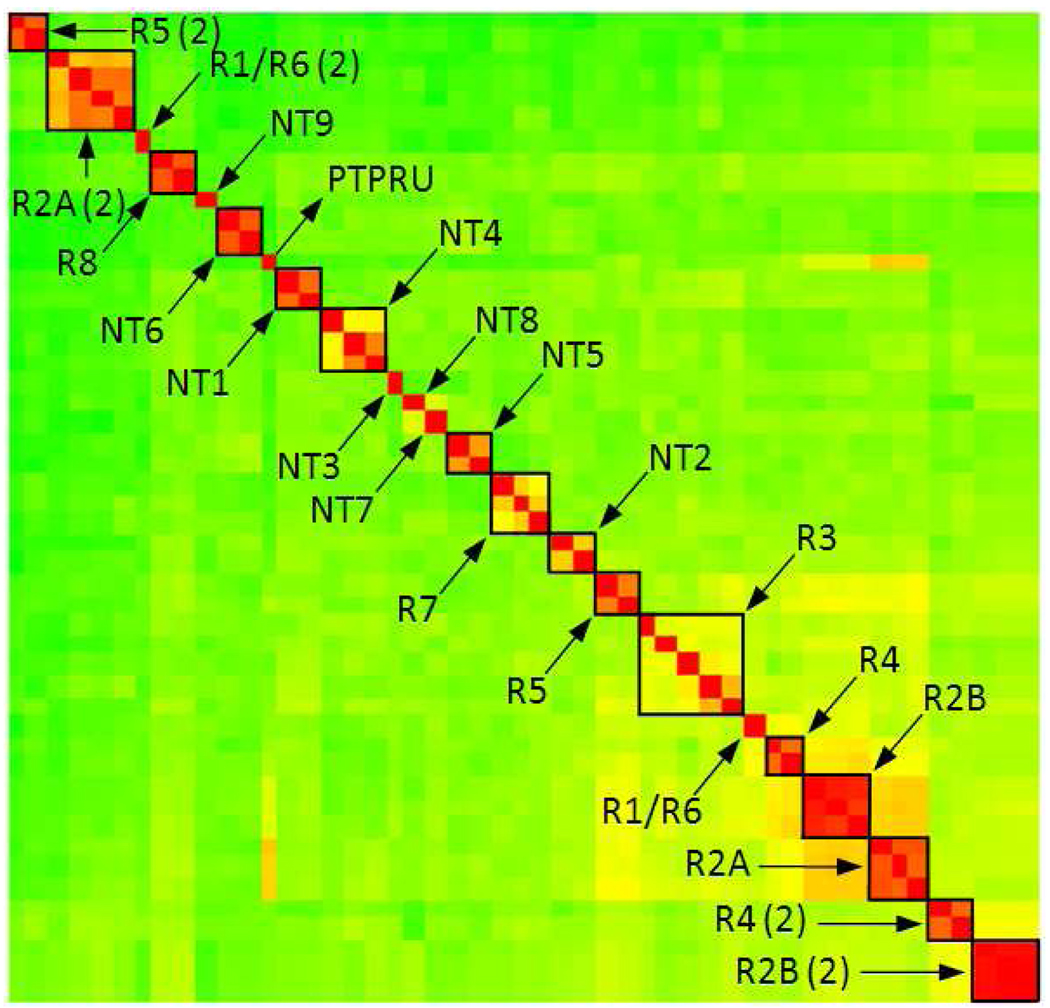
Previous studies related to PTPs were focused primarily on the classical type. Andersen et al.5 have shown clustering of vertebrate classical PTP domains into 17 subtypes based on sequence alignment. Our hierarchical clustering of the domain sequence similarity matrix of the classical PTPs reproduced the identical subtypes with only one exception. PTPRU had previously been categorized as R2A subtype, but here does not cluster within this group (Figure 7). However, the distal domains of the subtype R2B members group together into the R2B (2) cluster, which includes the distal domain of PTPRU. The other membrane-distal domains cluster in the same way as their membrane-proximate domains without any exception.
Figure 7.
Hierarchical clustering of all human classical PTP domain sequences (for both membrane proximal and distal domains). More detailed clustering presentation can be found in supporting material in Figure S7.
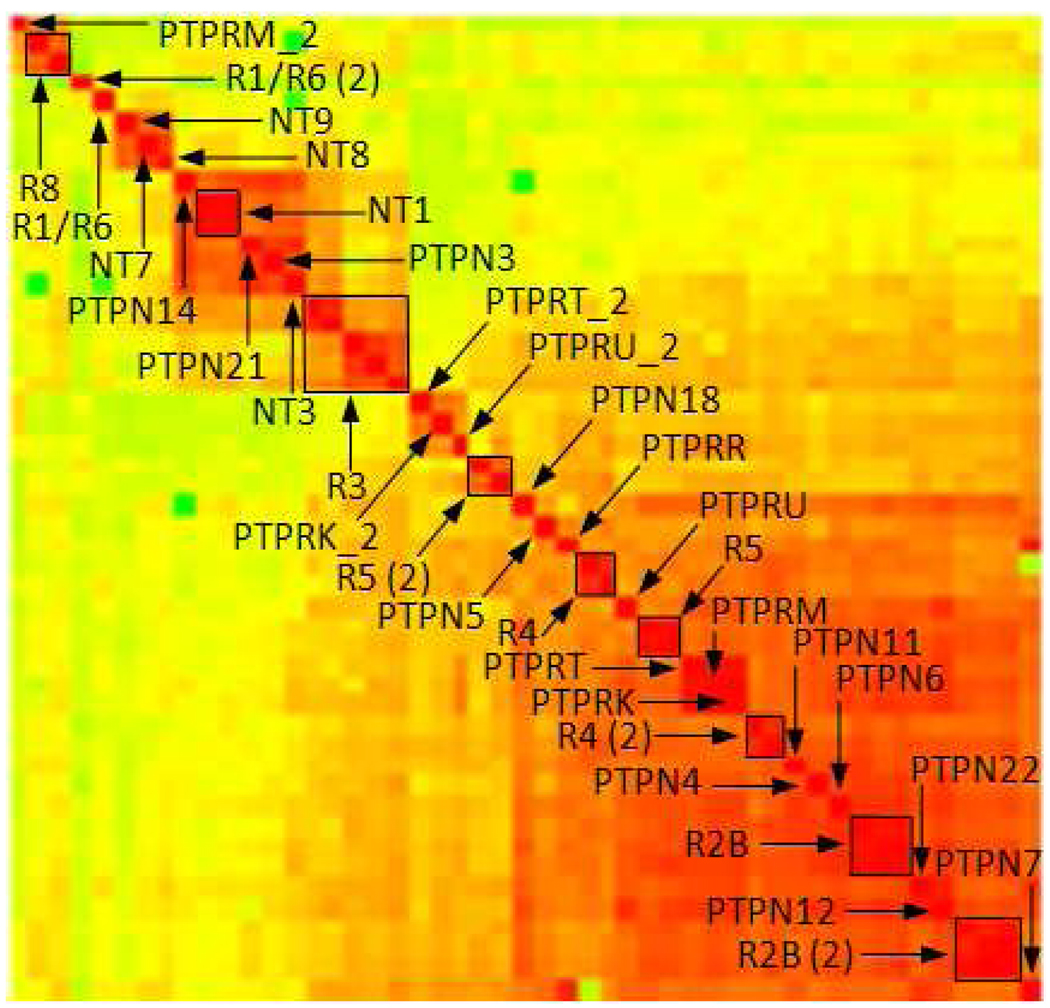
The corresponding analysis based on catalytic site similarities (Figure 8) shows a different picture.
Figure 8.
Hierarchical clustering based on catalytic site similarities of the classical PTPs. More detailed clustering presentation can be found in supporting material in Figure S8.
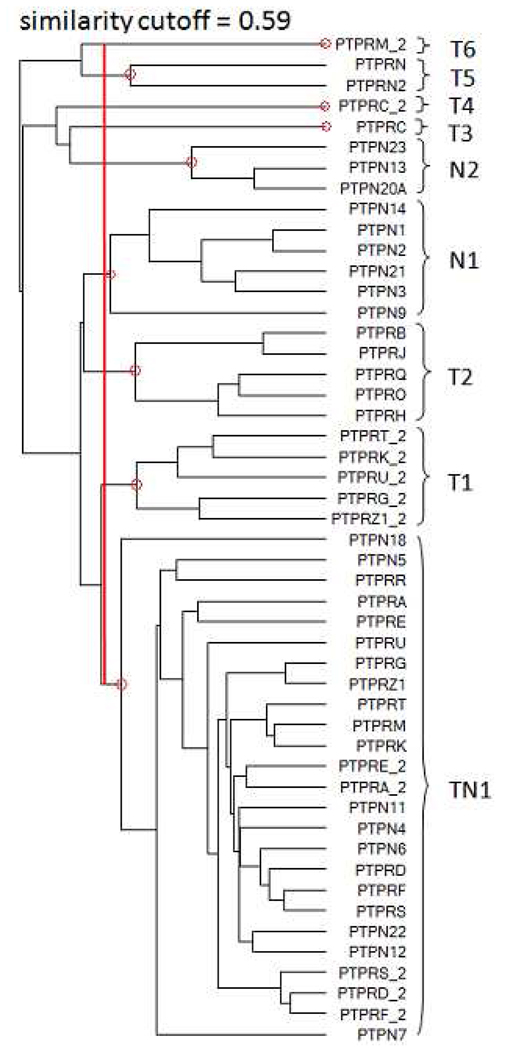
While the subtypes of classical PTPs are defined based on sequence similarity, different clustering results are obtained from site similarities. The conserved groupings are NT1, R3, R4, R4(2) (distal domains of R4 subtype), R5 and R5(2) (R5 distal domains), R8, R2B, and distal domains of R2B(2) subtype. However, in site similarity space most of the (small) sequence-based subtype groupings are not conserved and different clusters are formed. While sequence similarity clustering primarily defines numerous small groups, site similarity clustering (Figure 8) suggests a few larger groups depending on the similarity cutoff. Based on the similarities of the catalytic sites we suggest a different categorization of the classical PTPs. The dendogram (with corresponding gene annotation) and the clusters formed using a site similarity cutoff of 0.59 is shown in Figure 9. The largest group includes the majority of the transmembrane classical PTPs (22 receptor domains from subtypes R2A, R2B, R4, R5, R7). We name this group TN1 (T representing transmembrane and N non-receptor classical PTPs). The group in the center of the site similarity dendrogram includes the distal domain of subtype R5 (PTPRG_2 and PTPRZ1_2) and distal domains of three members of R2A (PTPRU_2, PTPRK_2, and PTPRT_2). This cluster is annotated as T1. Two small but distinct clusters are positioned in the upper middle part. The first one, T2, contains the R3 subtype (PTPRB, PTPRJ, PTPRQ, PTPRO, and PTPRH). The second cluster includes all members of NT1 (PTPN1 and PTPN2), NT3 (PTPN9), and NT6 (PTPN14 and PTPN21) and one member of NT5 (PTPN3) subtype and is annotated as N1 (non-receptor classical PTPs, Figure 9). Cluster N2 contains three non-receptor PTPs (PTPN13, PTPN20A, and PTPN23). Proximal and distal domains of PTPRC are singletons and denoted as T3 and T4, respectively. The last group with just two members (PTPRN and PTPRN2) is T5 while the distal domain of PTPRM_2 forms another singleton annotated as T6.
Figure 9.
Suggested main groupings of 49 classical PTP domains based on similarity of the catalytic sites.
The average proximity of the classical PTP appears much closer in site vs. sequence space (relative to the distance to all the other PTPs). The differences in grouping and in particular a few larger clusters in site similarity space are also illustrated in the PCA plots in the supporting material (Figures S9 and S10). The global trend of site vs. sequence similarity of the classical PTPs (Figure S11 supporting material) also suggests that the classical PTPs are on average much more similar by their catalytic sites compared to their domain sequences. This observation is substantiated by the experienced difficulty to develop highly selective inhibitors for classical PTPs.64,65 The comparison of the catalytic sites of one such example, PTPN1 (the most studied PTP) and PTPN3, is shown in Figure S12 in the supporting material, illustrating better evolutionary preservation of the catalytic sites compared to sequences alone.
Mapping of small molecule inhibition data to PTP site similarities
We explored the PDB in order to collect small molecule PTP inhibitors with binding modes in accordance with our site definition (active PTP form, 10 Å radius around the catalytic cysteine). As expected, the majority of published structures belong to PTPN1. We retrieved experimental activity data for PTPN1 inhibitors screened across a panel of PTPs.31,35,59–62 Selected PTPN1 ligands and their experimental activities are given in Table 3.
Table 3.
Experimental activities of PTPN1 inhibitors across different classical PTPs.
| Molecule | PTPN2 | PTPN1 | PTPRC | PTPRF | PTPN6 | PTPRB | PTPRE | PTPRA | |
|---|---|---|---|---|---|---|---|---|---|
 |
a1 | 1.3 | 3.2 | 280 | >500 | - | - | - | - |
 |
a2 | 0.026 | 0.036 | 151 | >1000 | - | - | - | - |
 |
b1 | 1 | 1.6 | 64 | >1000 | - | - | - | - |
 |
b2 | 0.68 | 0.82 | 55 | 320 | - | - | - | - |
 |
b3 | 0.32 | 0.3 | 26 | >1000 | - | - | - | - |
 |
b4 | 0.18 | 0.14 | 33 | >1000 | - | - | - | - |
 |
c1 | 4.1 | 9.2 | >1250 | 1100 | - | - | - | - |
 |
d1 | - | 23 | 160 | >2000 | 510 | 33 | 130 | 870 |
 |
d2 | - | 9.9 | 37 | 68 | 94 | 14 | 45 | 190 |
 |
d3 | - | 14 | 56 | 550 | 16 | 6 | 66 | 800 |
 |
d4 | - | 8 | 20 | 450 | 28 | 3.6 | 33 | 180 |
 |
d5 | - | 14 | 49 | 420 | 84 | 17 | 33 | 89 |
 |
e1 | - | 58 | 260 | >2000 | >2000 | 160 | 360 | >2000 |
 |
e2 | - | 62 | 210 | >2000 | 60 | 18 | 740 | 1700 |
 |
e3 | - | 8.1 | 41 | 410 | 100 | 19 | 45 | 290 |
 |
e4 | - | 0.29 | 59 | >2000 | >2000 | 560 | 1100 | >2000 |
 |
e5 | - | 14 | 53 | 360 | 350 | 11 | 20 | 170 |
 |
f1 | 1.1 | 0.6 | 489 | 176 | 289 | 21 | >500 | >500 |
Activity given as inhibition constant Ki in µM.
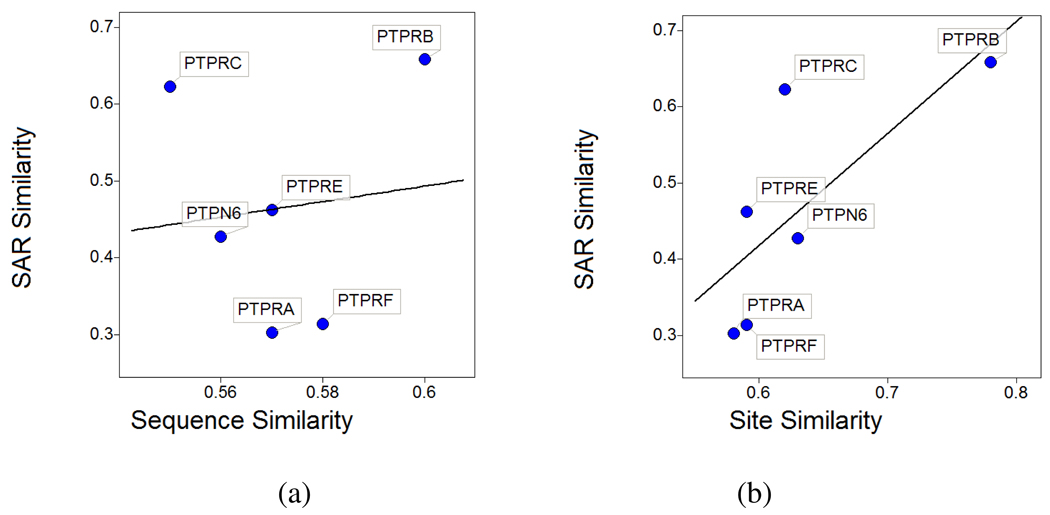
To evaluate target similarities based on these small molecule activity data we calculated pKi values and assigned pKi of 2 to inactive compounds (for example, activity >1000 in Table 3). We individually looked at the two subsets of full SAR matrices, one including selectivity data of compounds a1, a2, b1 to b4, and c1 against PTPN1, PTPN2, PTPRC and PTPRF, and the second set of compounds d1 to d5, e1 to e5, and f1 screened against PTPN1, PTPRA, PTPRB, PTPRC, PTPRE, PTPRF, and PTPN6. For each data set the small molecule activity-based similarities between PTPN1 and the other PTPs were calculated from the Euclidean distances of the corresponding activity vectors defined as the pKi values of all compounds tested against the respective PTP. The so determined activity-based similarities of PTP pairs are much better correlated to catalytic site similarities than to sequence similarities. For example Figure 10 illustrates the correlation of activity-based (SAR) similarity against sequence (a) and site similarity (b) respectively for the second data set above including PTPN1, PTPRA, PTPRB, PTPRC, PTPRE, PTPRF, and PTPN6. While SAR similarity is uncorrelated to sequences (r2 = 0.013), the square correlation coefficient to site similarity is 0.54. Correlations for the first data set including PTPN1, PTPN2, PTPRC, and PTPRF are shown in the supporting material (Figure S13). Again SAR similarity is better correlated to site similarity (r2 = 0.88) compared to sequences (r2 = 0.76).
Figure 10.
Correlation of SAR-based similarity (calculated from small molecule activity data) to sequence- (a) and catalytic site similarities (b) of PTPN1 and the PTPs shown.
SAR-based similarities among the PTPs were further evaluated by hierarchical clustering of the two experimental data sets based on the correlation of the activity vectors (Figure S14, supporting material). The proximity of each PTP to PTPN1 (activity data sets of PTPN1 inhibitors are used) based on clustering the experimental pKi values again are in better agreement with site than with sequence similarities (Table S3, supporting material). A complete list of sequence and site similarities for all classical PTPs relative to PTPN1 is given in Table S4 in the supporting material. The promiscuity of inhibitors for PTPN1 and PTPN2 can be explained by the high similarity of their catalytic sites (supporting material Figure S15). To develop (PTPN1 / PTPN2) selective inhibitors it is therefore required to utilize interactions with residues outside the binding sites considered in this analysis, for example by designing bidentate inhibitors that bind to the catalytic and a so-called second binding site.66
Since our binding sites are defined as a set of residues within 10 Å radius around the catalytic cysteine here we considered PTPN1 inhibitors that do not overextend that volume. To compare larger inhibitors that reach residues beyond 10 Å radius, the binding sites would have to be further extended to include these additional residues. As a consequence the PTP site similarities would also be different. Systematic analysis of binding site similarity relationships as a function of cut-off radii around the catalytic residues may reveal differences and similarities among PTPs that are particularly relevant in the context of ligands of specific size. However we consider the binding site definition we applied here as appropriate for most small molecule inhibitors.
In summary, the analysis of activity data of small molecule PTP inhibitors leads to the conclusion that local site similarities correspond much better to experimental observations than sequence similarities. In developing selective inhibitors, binding site similarity as described here may therefore be useful as a first order assessment to identify similar targets, which should be tested experimentally.
CONCLUSIONS
We have performed the most comprehensive analysis of the human PTP family based on domain sequences and for the first time evaluated the three-dimensional binding site similarities of the entire family. Using a parallel modeling approach we can amplify the currently existing PTP structural space covering all 113 PTP domains in their active conformation. We observe a global (and expected) trend that PTPs are generally more similar based on the functionally relevant three-dimensional sites around the catalytic residues compared to their overall domain sequences. This is in particular the case for the classical PTPs. The analysis of site vs. sequence similarity space confirms comparable major global groupings by PTP subtypes. However, clustering details and analysis of local neighborhoods reveal significant differences within the subtypes and how they are connected. Focusing on classical PTPs we suggest a novel categorization based on local site similarities as an alternative to the sequence-based categorization.
Based on available experimental data we show that cross-reactivity and selectivity, two critical criteria in lead optimization, can be better understood in the context of site similarity compared to sequence similarity alone. Examples of PTPs that are more closely related by their binding sites compared to sequences, illustrate that site similarity may be a useful measure to aid in the development of inhibitors targeting the catalytic domain. We conclude that local site similarities better than sequence similarities reflect the propensity of a PTP for promiscuity or selectivity of small molecule inhibitors.
This work is a relevant starting point to improve our understanding of substrate specificity, selectivity and cross-reactivity among PTPs and it provides a first-order structural basis for the development of specific and strongly binding PTP inhibitors. It also gives a new insight into global and local relationships among all members of human PTP family.
Supplementary Material
ACKNOWLEDGMENT
This work was in part supported by the NIH roadmap initiative (grants MLSCN U54 HG003914, MLSCN U54 MH074404, MLPCN U54 MH084512). We thank Dr. Steven Muskal at Eidogen-Sertanty for help with the TIP software system. We also acknowledge resources of the University of Miami Center for Computational Science (publication #163).
Abbreviations
- DUSP
dual-specificity phosphatase
- LMW
low-molecular weight
- MKP
map-kinase phosphatase
- MST
minimum spanning tree
- NW
Needleman-Wunsch
- PTK
protein-tyrosine kinase
- PTP
protein-tyrosine phosphatase
- TIP
informatics platform.
Footnotes
Supporting Information Available. List of human PTP gene family, sequence to model identities, global trend figures for different site and sequence similarities, additional figures for analysis of classical PTPs. Generated homology models (upcoming website). This material is available free of charge via the Internet at http://pubs.acs.org.
Contributor Information
Dušica Vidović, Email: dvidovic@med.miami.edu.
Stephan C. Schürer, Email: sschurer@med.miami.edu.
REFERENCES
- 1.Zhang ZY. Protein-tyrosine phosphatases: biological function, structural characteristics, and mechanism of catalysis. Crit Rev Biochem Mol Biol. 1998;33:1–52. doi: 10.1080/10409239891204161. [DOI] [PubMed] [Google Scholar]
- 2.Tonks NK. Introduction: protein tyrosine phosphatases. Semin Cell Biol. 1993;4:373–377. doi: 10.1006/scel.1993.1044. [DOI] [PubMed] [Google Scholar]
- 3.Barford D, Jia Z, Tonks NK. Protein tyrosine phosphatases take off. Nat Struct Biol. 1995;2:1043–1053. doi: 10.1038/nsb1295-1043. [DOI] [PubMed] [Google Scholar]
- 4.Tonks NK, Neel BG. From form to function: signaling by protein tyrosine phosphatases. Cell. 1996;87:365–368. doi: 10.1016/s0092-8674(00)81357-4. [DOI] [PubMed] [Google Scholar]
- 5.Andersen JN, Mortensen OH, Peters GH, Drake PG, Iversen LF, Olsen OH, Jansen PG, Andersen HS, Tonks NK, Moller NP. Structural and evolutionary relationships among protein tyrosine phosphatase domains. Mol Cell Biol. 2001;21:7117–7136. doi: 10.1128/MCB.21.21.7117-7136.2001. [DOI] [PMC free article] [PubMed] [Google Scholar]
- 6.Burke TR, Jr, Zhang ZY. Protein-tyrosine phosphatases: structure, mechanism, and inhibitor discovery. Biopolymers. 1998;47:225–241. doi: 10.1002/(SICI)1097-0282(1998)47:3<225::AID-BIP3>3.0.CO;2-O. [DOI] [PubMed] [Google Scholar]
- 7.Hanks SK, Quinn AM. Protein kinase catalytic domain sequence database: identification of conserved features of primary structure and classification of family members. Methods Enzymol. 1991;200:38–62. doi: 10.1016/0076-6879(91)00126-h. [DOI] [PubMed] [Google Scholar]
- 8.Hubbard SR, Till JH. Protein tyrosine kinase structure and function. Annu Rev Biochem. 2000;69:373–398. doi: 10.1146/annurev.biochem.69.1.373. [DOI] [PubMed] [Google Scholar]
- 9.Hunter T. A thousand and one protein kinases. Cell. 1987;50:823–829. doi: 10.1016/0092-8674(87)90509-5. [DOI] [PubMed] [Google Scholar]
- 10.Hunter T. Protein kinases and phosphatases: the yin and yang of protein phosphorylation and signaling. Cell. 1995;80:225–236. doi: 10.1016/0092-8674(95)90405-0. [DOI] [PubMed] [Google Scholar]
- 11.Hooft van Huijsduijnen R. Protein tyrosine phosphatases: counting the trees in the forest. Gene. 1998;225:1–8. doi: 10.1016/s0378-1119(98)00513-7. [DOI] [PubMed] [Google Scholar]
- 12.Zhang ZY. Protein tyrosine phosphatases: structure and function, substrate specificity, and inhibitor development. Annu Rev Pharmacol Toxicol. 2002;42:209–234. doi: 10.1146/annurev.pharmtox.42.083001.144616. [DOI] [PubMed] [Google Scholar]
- 13.Tonks NK. Protein tyrosine phosphatases: from genes, to function, to disease. Nat Rev Mol Cell Biol. 2006;7:833–846. doi: 10.1038/nrm2039. [DOI] [PubMed] [Google Scholar]
- 14.Tautz L, Pellecchia M, Mustelin T. Targeting the PTPome in human disease. Expert Opin Ther Targets. 2006;10:157–177. doi: 10.1517/14728222.10.1.157. [DOI] [PubMed] [Google Scholar]
- 15.Alonso A, Sasin J, Bottini N, Friedberg I, Osterman A, Godzik A, Hunter T, Dixon J, Mustelin T. Protein tyrosine phosphatases in the human genome. Cell. 2004;117:699–711. doi: 10.1016/j.cell.2004.05.018. [DOI] [PubMed] [Google Scholar]
- 16.Barr AJ, Ugochukwu E, Lee WH, King ON, Filippakopoulos P, Alfano I, Savitsky P, Burgess-Brown NA, Muller S, Knapp S. Large-scale structural analysis of the classical human protein tyrosine phosphatome. Cell. 2009;136:352–363. doi: 10.1016/j.cell.2008.11.038. [DOI] [PMC free article] [PubMed] [Google Scholar]
- 17.Lesk AM, Chothia C. How different amino acid sequences determine similar protein structures: the structure and evolutionary dynamics of the globins. J Mol Biol. 1980;136:225–270. doi: 10.1016/0022-2836(80)90373-3. [DOI] [PubMed] [Google Scholar]
- 18.Chothia C, Lesk AM. The relation between the divergence of sequence and structure in proteins. EMBO J. 1986;5:823–826. doi: 10.1002/j.1460-2075.1986.tb04288.x. [DOI] [PMC free article] [PubMed] [Google Scholar]
- 19.Bajaj M, Blundell T. Evolution and the tertiary structure of proteins. Annu Rev Biophys Bioeng. 1984;13:453–492. doi: 10.1146/annurev.bb.13.060184.002321. [DOI] [PubMed] [Google Scholar]
- 20.Sankar N, Machado J, Abdulla P, Hilliker AJ, Coe IR. Comparative genomic analysis of equilibrative nucleoside transporters suggests conserved protein structure despite limited sequence identity. Nucleic Acids Res. 2002;30:4339–4350. doi: 10.1093/nar/gkf564. [DOI] [PMC free article] [PubMed] [Google Scholar]
- 21.Kinnings SL, Jackson RM. Binding Site Similarity Analysis for the Functional Classification of the Protein Kinase Family. J Chem Inf Model. 2009;49:318–329. doi: 10.1021/ci800289y. [DOI] [PubMed] [Google Scholar]
- 22.Guan KL, Dixon JE. Evidence for protein-tyrosine-phosphatase catalysis proceeding via a cysteine-phosphate intermediate. J Biol Chem. 1991;266:17026–17030. [PubMed] [Google Scholar]
- 23.Pot DA, Woodford TA, Remboutsika E, Haun RS, Dixon JE. Cloning, bacterial expression, purification, and characterization of the cytoplasmic domain of rat LAR, a receptor-like protein tyrosine phosphatase. J Biol Chem. 1991;266:19688–19696. [PubMed] [Google Scholar]
- 24.Barford D, Flint AJ, Tonks NK. Crystal structure of human protein tyrosine phosphatase 1B. Science. 1994;263:1397–1404. [PubMed] [Google Scholar]
- 25.Jia Z, Barford D, Flint AJ, Tonks NK. Structural basis for phosphotyrosine peptide recognition by protein tyrosine phosphatase 1B. Science. 1995;268:1754–1758. doi: 10.1126/science.7540771. [DOI] [PubMed] [Google Scholar]
- 26.Zhang ZY. Chemical and mechanistic approaches to the study of protein tyrosine phosphatases. Acc Chem Res. 2003;36:385–392. doi: 10.1021/ar020122r. [DOI] [PubMed] [Google Scholar]
- 27.Yang J, Liang X, Niu T, Meng W, Zhao Z, Zhou GW. Crystal structure of the catalytic domain of protein-tyrosine phosphatase SHP-1. J Biol Chem. 1998;273:28199–28207. doi: 10.1074/jbc.273.43.28199. [DOI] [PubMed] [Google Scholar]
- 28.Yang J, Niu T, Zhang A, Mishra AK, Zhao ZJ, Zhou GW. Relation between the flexibility of the WPD loop and the activity of the catalytic domain of protein tyrosine phosphatase SHP-1. J Cell Biochem. 2001;84:47–55. doi: 10.1002/jcb.1265. [DOI] [PubMed] [Google Scholar]
- 29.Burke TR, Jr, Lee K. Phosphotyrosyl mimetics in the development of signal transduction inhibitors. Acc Chem Res. 2003;36:426–433. doi: 10.1021/ar020127o. [DOI] [PubMed] [Google Scholar]
- 30.Groves MR, Yao ZJ, Roller PP, Burke TR, Jr, Barford D. Structural basis for inhibition of the protein tyrosine phosphatase 1B by phosphotyrosine peptide mimetics. Biochemistry. 1998;37:17773–17783. doi: 10.1021/bi9816958. [DOI] [PubMed] [Google Scholar]
- 31.Andersen HS, Iversen LF, Jeppesen CB, Branner S, Norris K, Rasmussen HB, Moller KB, Moller NP. 2-(oxalylamino)-benzoic acid is a general, competitive inhibitor of protein-tyrosine phosphatases. J Biol Chem. 2000;275:7101–7108. doi: 10.1074/jbc.275.10.7101. [DOI] [PubMed] [Google Scholar]
- 32.Liu G, Xin Z, Pei Z, Hajduk PJ, Abad-Zapatero C, Hutchins CW, Zhao H, Lubben TH, Ballaron SJ, Haasch DL, Kaszubska W, Rondinone CM, Trevillyan JM, Jirousek MR. Fragment screening and assembly: a highly efficient approach to a selective and cell active protein tyrosine phosphatase 1B inhibitor. J Med Chem. 2003;46:4232–4235. doi: 10.1021/jm034122o. [DOI] [PubMed] [Google Scholar]
- 33.Klopfenstein SR, Evdokimov AG, Colson AO, Fairweather NT, Neuman JJ, Maier MB, Gray JL, Gerwe GS, Stake GE, Howard BW, Farmer JA, Pokross ME, Downs TR, Kasibhatla B, Peters KG. 1,2,3,4-Tetrahydroisoquinolinyl sulfamic acids as phosphatase PTP1B inhibitors. Bioorg Med Chem Lett. 2006;16:1574–1578. doi: 10.1016/j.bmcl.2005.12.051. [DOI] [PubMed] [Google Scholar]
- 34.Ala PJ, Gonneville L, Hillman MC, Becker-Pasha M, Wei M, Reid BG, Klabe R, Yue EW, Wayland B, Douty B, Polam P, Wasserman Z, Bower M, Combs AP, Burn TC, Hollis GF, Wynn R. Structural basis for inhibition of protein-tyrosine phosphatase 1B by isothiazolidinone heterocyclic phosphonate mimetics. J Biol Chem. 2006;281:32784–32795. doi: 10.1074/jbc.M606873200. [DOI] [PubMed] [Google Scholar]
- 35.Iversen LF, Andersen HS, Branner S, Mortensen SB, Peters GH, Norris K, Olsen OH, Jeppesen CB, Lundt BF, Ripka W, Moller KB, Moller NP. Structure-based design of a low molecular weight, nonphosphorus, nonpeptide, and highly selective inhibitor of protein-tyrosine phosphatase 1B. J Biol Chem. 2000;275:10300–10307. doi: 10.1074/jbc.275.14.10300. [DOI] [PubMed] [Google Scholar]
- 36.Yue EW, Wayland B, Douty B, Crawley ML, McLaughlin E, Takvorian A, Wasserman Z, Bower MJ, Wei M, Li Y, Ala PJ, Gonneville L, Wynn R, Burn TC, Liu PC, Combs AP. Isothiazolidinone heterocycles as inhibitors of protein tyrosine phosphatases: synthesis and structure-activity relationships of a peptide scaffold. Bioorg Med Chem. 2006;14:5833–5849. doi: 10.1016/j.bmc.2006.05.032. [DOI] [PubMed] [Google Scholar]
- 37.Eyre TA, Ducluzeau F, Sneddon TP, Povey S, Bruford EA, Lush MJ. The HUGO Gene Nomenclature Database, 2006 updates. Nucleic Acids Res. 2006;34:D319–D321. doi: 10.1093/nar/gkj147. [DOI] [PMC free article] [PubMed] [Google Scholar]
- 38.Bairoch A, Apweiler R. The SWISS-PROT protein sequence data bank and its new supplement TREMBL. Nucleic Acids Res. 1996;24:21–25. doi: 10.1093/nar/24.1.21. [DOI] [PMC free article] [PubMed] [Google Scholar]
- 39.Target Informatics Platform (TIP) Oceanside, CA: Eidogen-Sertanty, Inc; http://eidogen-sertanty.com/ [Google Scholar]
- 40.Sonnhammer EL, Eddy SR, Durbin R. Pfam: a comprehensive database of protein domain families based on seed alignments. Proteins. 1997;28:405–420. doi: 10.1002/(sici)1097-0134(199707)28:3<405::aid-prot10>3.0.co;2-l. [DOI] [PubMed] [Google Scholar]
- 41.Bateman A, Coin L, Durbin R, Finn RD, Hollich V, Griffiths-Jones S, Khanna A, Marshall M, Moxon S, Sonnhammer EL, Studholme DJ, Yeats C, Eddy SR. The Pfam protein families database. Nucleic Acids Res. 2004;32:D138–D141. doi: 10.1093/nar/gkh121. [DOI] [PMC free article] [PubMed] [Google Scholar]
- 42.Finn RD, Mistry J, Schuster-Bockler B, Griffiths-Jones S, Hollich V, Lassmann T, Moxon S, Marshall M, Khanna A, Durbin R, Eddy SR, Sonnhammer EL, Bateman A. Pfam: clans, web tools and services. Nucleic Acids Res. 2006;34:D247–D251. doi: 10.1093/nar/gkj149. [DOI] [PMC free article] [PubMed] [Google Scholar]
- 43.Thompson JD, Higgins DG, Gibson TJ. CLUSTAL W: improving the sensitivity of progressive multiple sequence alignment through sequence weighting, position-specific gap penalties and weight matrix choice. Nucleic Acids Res. 1994;22:4673–4680. doi: 10.1093/nar/22.22.4673. [DOI] [PMC free article] [PubMed] [Google Scholar]
- 44.McCleverty CJ, Lin DC, Liddington RC. Structure of the PTB domain of tensin1 and a model for its recruitment to fibrillar adhesions. Protein Sci. 2007;16:1223–1229. doi: 10.1110/ps.072798707. [DOI] [PMC free article] [PubMed] [Google Scholar]
- 45.Needleman SB, Wunsch CD. A general method applicable to the search for similarities in the amino acid sequence of two proteins. J Mol Biol. 1970;48:443–453. doi: 10.1016/0022-2836(70)90057-4. [DOI] [PubMed] [Google Scholar]
- 46.Debe DA, Danzer JF, Goddard WA, Poleksic A. STRUCTFAST: protein sequence remote homology detection and alignment using novel dynamic programming and profile-profile scoring. Proteins. 2006;64:960–967. doi: 10.1002/prot.21049. [DOI] [PubMed] [Google Scholar]
- 47.Hambly K, Danzer J, Muskal S, Debe DA. Interrogating the druggable genome with structural informatics. Mol Divers. 2006;10:273–281. doi: 10.1007/s11030-006-9035-3. [DOI] [PubMed] [Google Scholar]
- 48.Berman HM, Westbrook J, Feng Z, Gilliland G, Bhat TN, Weissig H, Shindyalov IN, Bourne PE. The Protein Data Bank. Nucleic Acids Res. 2000;28:235–242. doi: 10.1093/nar/28.1.235. [DOI] [PMC free article] [PubMed] [Google Scholar]
- 49.Kolmodin K, Aqvist J. Prediction of a ligand-induced conformational change in the catalytic core of Cdc25A. FEBS Lett. 2000;465:8–11. doi: 10.1016/s0014-5793(99)01718-4. [DOI] [PubMed] [Google Scholar]
- 50.Begley MJ, Taylor GS, Brock MA, Ghosh P, Woods VL, Dixon JE. Molecular basis for substrate recognition by MTMR2, a myotubularin family phosphoinositide phosphatase. Proc Natl Acad Sci U S A. 2006;103:927–932. doi: 10.1073/pnas.0510006103. [DOI] [PMC free article] [PubMed] [Google Scholar]
- 51.Schmitt S, Kuhn D, Klebe G. A new method to detect related function among proteins independent of sequence and fold homology. J Mol Biol. 2002;323:387–406. doi: 10.1016/s0022-2836(02)00811-2. [DOI] [PubMed] [Google Scholar]
- 52.Brint AT, Willett P. Upperbound procedures for the identification of similar three-dimensional chemical structures. J Comput Aided Mol Des. 1989;2:311–320. doi: 10.1007/BF01532992. [DOI] [PubMed] [Google Scholar]
- 53.Spotfire, version 9.0. Palo Alto, CA, USA: TIBCO; 2007. [Google Scholar]
- 54.Kruskal JB. On the Shortest Spanning Subtree of a Graph and the Traveling Salesman Problem. Proceedings of the American Mathematical Society. 1956;7:48–50. [Google Scholar]
- 55.Shannon P, Markiel A, Ozier O, Baliga NS, Wang JT, Ramage D, Amin N, Schwikowski B, Ideker T. Cytoscape: a software environment for integrated models of biomolecular interaction networks. Genome Res. 2003;13:2498–2504. doi: 10.1101/gr.1239303. [DOI] [PMC free article] [PubMed] [Google Scholar]
- 56.Schrodinger, Suite 2008. Portland, OR, USA: Schrodinger, LLC.; 2008. [Google Scholar]
- 57.The PyMOL Molecular Graphics System. Palo Alto, CA, USA: DeLano Scientific LLC; 2008. [Google Scholar]
- 58.SciTegic Pipeline Pilot, version 7.0. San Diego, CA, USA: Accelrys Software; 2008. [Google Scholar]
- 59.Wilson DP, Wan ZK, Xu WX, Kirincich SJ, Follows BC, Joseph-McCarthy D, Foreman K, Moretto A, Wu J, Zhu M, Binnun E, Zhang YL, Tam M, Erbe DV, Tobin J, Xu X, Leung L, Shilling A, Tam SY, Mansour TS, Lee J. Structure-based optimization of protein tyrosine phosphatase 1B inhibitors: from the active site to the second phosphotyrosine binding site. J Med Chem. 2007;50:4681–4698. doi: 10.1021/jm0702478. [DOI] [PubMed] [Google Scholar]
- 60.Wan ZK, Lee J, Xu W, Erbe DV, Joseph-McCarthy D, Follows BC, Zhang YL. Monocyclic thiophenes as protein tyrosine phosphatase 1B inhibitors: capturing interactions with Asp48. Bioorg Med Chem Lett. 2006;16:4941–4945. doi: 10.1016/j.bmcl.2006.06.051. [DOI] [PubMed] [Google Scholar]
- 61.Moretto AF, Kirincich SJ, Xu WX, Smith MJ, Wan ZK, Wilson DP, Follows BC, Binnun E, Joseph-McCarthy D, Foreman K, Erbe DV, Zhang YL, Tam SK, Tam SY, Lee J. Bicyclic and tricyclic thiophenes as protein tyrosine phosphatase 1B inhibitors. Bioorg Med Chem. 2006;14:2162–2177. doi: 10.1016/j.bmc.2005.11.005. [DOI] [PubMed] [Google Scholar]
- 62.Iversen LF, Andersen HS, Moller KB, Olsen OH, Peters GH, Branner S, Mortensen SB, Hansen TK, Lau J, Ge Y, Holsworth DD, Newman MJ, Hundahl Moller NP. Steric hindrance as a basis for structure-based design of selective inhibitors of protein-tyrosine phosphatases. Biochemistry. 2001;40:14812–14820. doi: 10.1021/bi011389l. [DOI] [PubMed] [Google Scholar]
- 63.Hillisch A, Pineda LF, Hilgenfeld R. Utility of homology models in the drug discovery process. Drug Discov Today. 2004;9:659–669. doi: 10.1016/S1359-6446(04)03196-4. [DOI] [PMC free article] [PubMed] [Google Scholar]
- 64.Guo XL, Shen K, Wang F, Lawrence DS, Zhang ZY. Probing the molecular basis for potent and selective protein-tyrosine phosphatase 1B inhibition. J Biol Chem. 2002;277:41014–41022. doi: 10.1074/jbc.M207347200. [DOI] [PubMed] [Google Scholar]
- 65.Wiesmann C, Barr KJ, Kung J, Zhu J, Erlanson DA, Shen W, Fahr BJ, Zhong M, Taylor L, Randal M, McDowell RS, Hansen SK. Allosteric inhibition of protein tyrosine phosphatase 1B. Nat Struct Mol Biol. 2004;11:730–737. doi: 10.1038/nsmb803. [DOI] [PubMed] [Google Scholar]
- 66.Puius YA, Zhao Y, Sullivan M, Lawrence DS, Almo SC, Zhang ZY. Identification of a second aryl phosphate-binding site in protein-tyrosine phosphatase 1B: a paradigm for inhibitor design. Proc Natl Acad Sci U S A. 1997;94:13420–13425. doi: 10.1073/pnas.94.25.13420. [DOI] [PMC free article] [PubMed] [Google Scholar]
Associated Data
This section collects any data citations, data availability statements, or supplementary materials included in this article.


