

Abstract
Influence of 12 nonpolar amino acids residues from the hydrophobic core of apomyoglobin on stability of its native state and folding intermediate was studied. Six of the selected residues are from the A, G and H helices; these are conserved in structure of the globin family, although nonfunctional, that is, not involved in heme binding. The rest are nonconserved hydrophobic residues that belong to the B, C, D, and E helices. Each residue was substituted by alanine, and equilibrium pH-induced transitions in apomyoglobin and its mutants were studied by circular dichroism and fluorescent spectroscopy. The obtained results allowed estimating changes in their free energy during formation of the intermediate state. It was first shown that the strength of side chain interactions in the apomyoglobin intermediate state amounts to 15–50% of that in its native state for conserved residues, and practically to 0% for nonconserved residues. These results allow a better understanding of interactions occurring in the intermediate state and shed light on involvement of certain residues in protein folding at different stages.
Keywords: protein folding, protein stability, apomyoglobin mutants, changes in free energy, strength of interactions, conserved residues
Introduction
Average-sized proteins (approximately 100–300 residues) usually fold in vitro via an intermediate state, as it was first reported by Tanford.1 The later studies in this field are summarized in a number of reviews.2–6 The formation of intermediate states in the course of globular protein renaturation often takes less than 10−3 s (see, e.g., reviews3,7). These intermediate states are quite compact and possess a pronounced secondary structure, but their side chains lack tight packing.8–11 The refolding of a protein may depend on the arrangement of its intermediate state. Therefore, studies of the intermediate state structure and its stability are important to shed light on relationship between the protein amino acid sequence and its spatial structure.
Apomyoglobin (apoMb) ranks classical in studies of this kind. It is a single-domain protein of 17 kDa formed by seven helices (by eight ones for holomyoglobin). Its structure differs from that of holomyoglobin by the position of its loops and helices, with one of the latter, F-helix, being completely destroyed,12–14 and the total helicity being reduced from 78% to 65%.15 Nevertheless, apoMb holds its hydrophobic core16 and a peculiar holomyoglobin-like tertiary structure.17 According to the thermodynamic criteria, when heated, both holomyoglobin and its apo-form undergo cooperative denaturing transitions accompanied by notable changes in their enthalpy and heat capacity. Of the two, the apo-form, displays a lower stability.18 At pH 4.2, it acquires the “molten globule” intermediate state characterized by a pronounced helical structure content, compactness, and the hydrophobic core which can be unfolded by a strong denaturant.19 Further acidification to pH 2.0 also provides almost complete unfolding of the intermediate.20
A number of articles report on the structures of both kinetic and equilibrium apoMb intermediates with an emphasis on the presence of intrinsic native contacts and on their contribution to stability of the intermediate state. For example, NMR studies demonstrated that the equilibrium and early (<10−3 s, formation time) kinetic intermediates have a virtually complete secondary structure, and the side chains of the A, G and H helices, and in part, of the B and E helices too, are somewhat screened from the solvent.14,21,22 Some authors23–27 used point mutagenesis to estimate contributions of various amino acids to intermediate stability. In particular, it has been shown that, with A130, F123, and S108 (responsible for A-H and G-H interactions) substituted by either hydrophobic or charged amino acids, all apoMb mutants demonstrated a change in stability of the native state relative to the intermediate state and a surprisingly small (though measured with a large error) alteration of the intermediate state stability relative to the unfolded state.23 The aforementioned articles and Bertagna and Barrick28 offer evidence both for and against involvement of the apoMb side chains in stabilization of the intermediate state.
To resolve this uncertainty, here we measure contribution of side chains of the 12 residues into interactions occurring within apoMb folding intermediate. For each mutant, we determined thermodynamic parameters of the conformational transitions U↔I and I↔N and the resulting Fersht's parameter29 φI that reflects the comparative contribution of the substituted side chain to stabilization of the intermediate state. Analysis of all these experimental data allowed concluding that the strength of side chain interactions in the apomyoglobin intermediate state does not exceed 50% of that in its native state for conserved residues, and is practically equal to 0% for nonconserved residues.
Results and Discussion
Selection of amino acid residues for point substitutions
To estimate the side chain contribution into stabilization of the apoMb intermediate state, the residues intended for point substitutions were selected on the basis of two theoretical approaches proposed previously for prediction of the protein folding nucleus. One of these was developed by Ptitsyn's team.30,31 An analysis of 728 globin sequences revealed only six residues that are conserved in globin structure but nonfunctional (i.e., not involved in heme binding): Val10 and Trp14 (A helix), Ile111 and Leu115 (G helix), Met131 and Leu135 (H helix).30 These are the first six residues selected for substitution. The other six, from the B helix (I28, F33), C helix (L40), D helix (M55) and E helix (L61, L76), are nonconserved but deeply buried in the protein structure residues that have been predicted by the “landscape” approach in modeling of protein unfolding32,33 as residues having significant influence upon the rate of apoMb folding. For short, the former will be referred to as “conserved residues” and the latter as “nonconserved residues.” All these residues are hydrophobic, and their side chains have numerous contacts with their surroundings in the native structure (Fig. 1).
Figure 1.
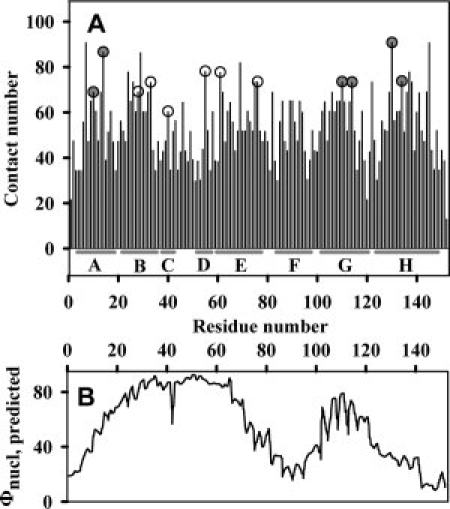
(A) Number of interatomic contacts for each residue side chain in the native myoglobin structure (contact radius is 6 Å). Filled circles denote the conserved nonfunctional residues, nonfilled circles – the nonconserved residues. α-Helices of the myoglobin structure34 are shown under the plot. (B) Predicted probability φnucl of implication in the apomyoglobin folding nucleus. Adapted from Ref. 33.
Each selected residue was substituted by Ala. These mutations met two common requirements: (i) to keep the type of amino acids unchanged (i.e., a hydrophobic amino acid was replaced by another hydrophobic one); (ii) to diminish the number of contacts of their side chains as compared with the wild type (WT) native structure.
To learn the effect of these mutations on stability of the native and intermediate states (a thorough analysis of which for apoMb was made earlier by Baldwin and coworkers),23,35 we studied pH-induced equilibrium transitions of both the mutant and WT forms using far UV CD and tryptophan (Trp) fluorescence.
Strength of side chain interactions in the intermediate and native states: estimation and comparison
Stability of the native and intermediate states of apoMb with point mutations was estimated on the basis of studying pH-induced equilibrium transitions by far UV CD and Trp fluorescence (Figs. 2 and 3). The equilibrium urea-induced denaturing transitions provide a poor evidence for existence of an intermediate state in this process,36 thus being inadequate for measuring a relative stability of the native and intermediate states of apoMb and its mutants.
Figure 2.
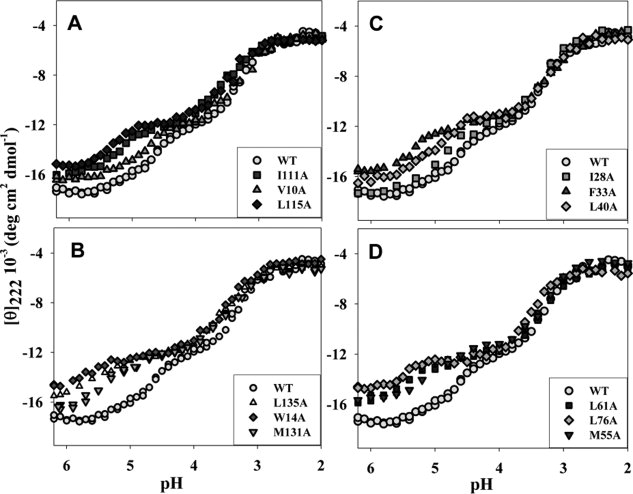
Equilibrium pH-induced denaturing transitions in WT apoMb and in its mutants as recorded by changing molar ellipticity at 222 nm, [θ]222. (A, B), proteins with substituted conserved residues within the A, G, and H helices; (C, D), proteins with substituted nonconserved residues within the B, C, D, and E helices. Insets show the mutant proteins presented. Experimental errors do not exceed the size of corresponding experimental points.
Figure 3.
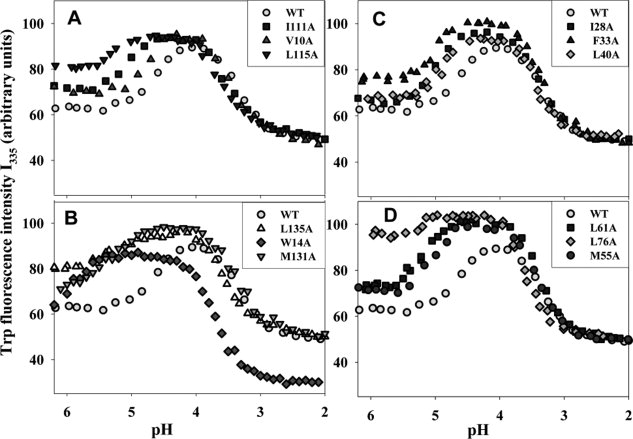
Equilibrium pH-induced denaturing transitions in WT apoMb and in its mutants as recorded by changing intensity of Trp fluorescence at 335 nm, I335. (A, B), proteins with substituted conserved residues within the A, G, and H helices; (C, D), proteins with substituted nonconserved residues within the B, C, D, and E helices. Insets show the mutant proteins presented. Experimental errors do not exceed the size of corresponding experimental points.
In WT apoMb, two pH-induced equilibrium transitions were clearly revealed by changing molar ellipticity at 222 nm ([θ]222) and by Trp fluorescence intensity at 335nm (I335).37 These were the transition from the native to intermediate state with its middle at pH 4.8 and the transition from the intermediate to unfolded state with its middle at pH 3.3. It is around pH 4.2 where accumulation of the equilibrium “molten globule” state was observed. As seen from Figures 2 and 3, for mutants, the accumulated intermediate was observed over a wider pH range than for WT apoMb. However, the U-I mid-transition of both the mutant and WT forms occurred within virtually the same pH range (pH = 3.3–3.5), unlike the I-N transition that, for mutants, was shifted towards higher pH values (from pH = 4.8 to pH = 5.2–5.8). Hence, these mutations caused a strong destabilization of the apoMb native structure and only a slight destabilization of its folding intermediate structure.
Since the mutants constructed for the current study had the unchanged number of ionized amino acids, that is, since pH dependence of the N and I (relative to U) free energies was preserved, it is possible25 to calculate the change in mutant free energy1,38 (counted off the U state one), as compared to that of the WT form, resting on the three-state model N↔I↔U and the pH-dependent equilibrium transitions in the mutants. The thermodynamic parameters were calculated from the protein unfolding curves using equations based on the three-state model N↔I↔U described earlier.1,38 The experimentally observed fluorescence intensity or molar ellipticity at a current pH value is presented as 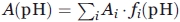 . Here Ai is the pH-independent fluorescence intensity or molar ellipticity of state i (i = N, I, U);
  is the fraction of state i (R being the gas constant and T the temperature); ΔGiU(pH) = ΔGiU(pH0)+βiU(pH − pH0) is free energy of this state relatively to that of the state U [thus, ΔGUU(pH) ≡ 0, ΔGIU(pH) = ΔGIU(pH0) + βIU(pH − pH0), and [cf. Eq. (4)] ΔGNU(pH) = (ΔGNI(pH0) + ΔGIU(pH0)) + (βNI + βIU) (pH − pH0)]; pH0 = 4.2 where the most pronounced “molten globule” state accumulation was observed, while βNI and βIU are pH-independent multipliers for the N-I and I-U transitions (since it has been shown by Baldwin and coworkers35,39 that the pH dependence of ΔGNI is close to linear in the transition region, we also assume a linear dependence of ΔGIU on pH in the corresponding region; this assumption is justified by calculations made in40). The values of
  ,
,  , and so forth, are fitted to the experimental graphs (Figs. 2 and 3) using the least-square method (see “Methods” section).
Table I gives values of ΔΔGIU, ΔΔGNU, and φI at pH0 = 4.2. They are calculated from CD and FL data using Eqs. (1)– (4) (see later). As seen, all point mutations resulted in a considerable destabilization of the native state, whereas the mutant intermediates showed a markedly less destabilization, in particular those with substitutions in the B, C, D, and E helices.
Table I.
Changes in Stability of N and I States of apoMb Mutants Upon Equilibrium Unfolding, and φI Values Estimated from Results by Different Techniques
| Circular dichroism |
Fluorescence |
||||||
|---|---|---|---|---|---|---|---|
| ΔΔGIU (kcal/mol) | ΔΔGNU (kcal/mol) | φI | ΔΔGIU (kcal/mol) | ΔΔGNU (kcal/mol) | φI |  |
|
| Conserved | |||||||
| V10A | 0.5 ± 0.5 | 0.9 ± 0.6 | 0.6 ± 0.7 | 0.6 ± 0.3 | 1.3 ± 0.7 | 0.5 ± 0.3 | 0.5 ± 0.3 |
| W14A | 1.0 ±0.4 | 3.0 ± 1.3 | 0.3 ± 0.2 | 0.6 ± 0.3 | 6.0 ± 2.2 | 0.1± 0.1 | 0.16 ± 0.06 |
| I111A | 1.2 ± 0.4 | 3.0 ± 0.6 | 0.4 ± 0.1 | 0.6 ± 0.4 | 1.9 ± 0.8 | 0.3 ± 0.2 | 0.37 ± 0.12 |
| L115A | 0.8 ± 0.4 | 2.9 ± 0.8 | 0.3 ± 0.2 | 0.7 ± 0.2 | 2.7 ± 0.7 | 0.3 ± 0.1 | 0.26 ± 0.08 |
| M131A | 1.0 ± 0.4 | 2.6 ± 0.8 | 0.4 ± 0.2 | 0.3 ± 0.2 | 1.0 ± 0.3 | 0.2 ± 0.2 | 0.32 ± 0.15 |
| L135A | 0.9 ± 0.4 | 2.1 ± 0.7 | 0.4 ± 0.2 | 0.2 ± 0.2 | 1.7 ± 0.8 | 0.1 ± 0.1 | 0.18 ± 0.12 |
| Nonconserved | |||||||
| I28A | 0.1 ± 0.7 | 0.7 ± 0.8 | 0.1 ± 1.0 | 0.0 ± 0.2 | 1.5 ± 0.4 | −0.0 ± 0.1 | −0.0 ± 0.1 |
| F33A | 0.5 ± 0.4 | 2.1 ± 0.6 | 0.2 ± 0.2 | −0.1 ± 0.2 | 1.9 ± 0.7 | −0.1 ± 0.1 | 0.0 ± 0.1 |
| L40A | −0.4 ± 0.5 | 0.2 ± 0.5 | −1.8 ± 4.8 | −0.4 ± 0.2 | 1.2 ± 0.6 | −0.4 ± 0.3 | −0.4 ± 0.3 |
| M55A | −0.3 ± 0.5 | 0.1 ± 0.6 | −2.0 ± 8.9 | −0.1 ± 0.2 | 2.2 ± 1.1 | −0.1 ± 0.1 | −0.1 ± 0.1 |
| L61A | 0.4 ± 0.5 | 1.2 ± 0.6 | 0.3 ± 0.4 | −0.4 ± 0.3 | 1.4 ± 0.4 | −0.3 ± 0.2 | −0.2 ± 0.2 |
| L76A | 0.7 ± 0.4 | 5.0 ± 1.6 | 0.1 ± 0.1 | 0.2 ± 0.2 | 10.1 ± 4.7 | 0.02 ± 0.03 | 0.03 ± 0.03 |
All values correspond to pH0 = 4.2 and 11°C in a buffer system with 0.01 M sodium acetate.
However, as seen in many cases, especially for the I-U transition, an error in ΔΔG determination by either technique exceeded ΔΔG itself. This leads to a large error in φI value calculated by each single method. To reduce this error and to obtain more accurate φI values, we averaged φI obtained by the two techniques used in such a way, that φI values obtained with smaller errors have larger weights in the averaging (see “Materials and Methods” section).
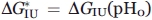
These averaged values and their errors for each of the 12 mutants are shown in Figure 4. Inset on Figure 4 presents, as an example, a decrease of error in the φI value for the I111A mutant as a result of joint usage of the two techniques.
Figure 4.
Estimated  values (with errors) for the studied side chains, averaged over the two techniques used, for the conserved (filled triangles) and nonconserved (nonfilled triangles) residues. The Inset shows φI values for I111A substitution separately calculated from CD and FL equilibrium data with their errors for each technique.
As mentioned above, the parameter φI shows29,41 the relative strength (as compared with the native state) of residue side chain contacts in the intermediate state: φI = 1 means that stabilization of the intermediate state by the given side chain is comparable with its stabilizing effect on the native state, while φI = 0 means that no stabilization of the intermediate state is produced by this side chain. As seen from Figure 4, all side chains had values below 0.5, with some of these (specifically, for nonconserved residues) being close to zero, which means that mutations of the studied residues, nonconserved in particular, only slightly (as compared with the native state) affected the strength of contacts formed by their side chains in the intermediate state. Then, the fact that substitution of large hydrophobic groups by small ones (Ala) does not result in a considerable destabilization of the intermediate state may be explained by relatively weak interactions of these side chains and in particular, by their weak hydrophobic interactions in the I state. The latter conclusion is justified by investigation28 of substitutions of Met131 of apoMb for various nonpolar residues of different hydrophobicity.
However, it is noteworthy that values were reliably higher ( approximately 0.15–0.5) for mutations in the A, G, and H helices, as compared with those in the B, C, D, and E helices ( approximately 0.0 and even negative). This occurs not only because the B – E helices are less structured in the intermediate state (as shown by H-D exchange data13), but may also depend on the side chain of the structured region. Indeed, Val17 is a part of the A helix structured in the I state, but is nonconserved in the globin family, and behavior of its side chain (as shown by37) is different from that of conserved residues and closer to nonconserved ones. This demonstrates heterogeneity in strength of side chain contacts in the intermediate state. It is noteworthy that the A, G, and H helices are not only structured but also show a native-like topology22 in the I state, which correlates with a higher contact density between these helices.
Conclusions
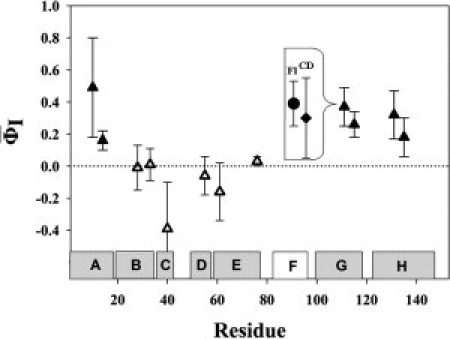
The results of the current study are summarized in Figures 4 and 5. In Figure 5, the color intensity is indicative of the extent to which the studied side chains are involved in stabilizing the apoMb intermediate state. It is evident that side chains of the conserved residues are involved in stabilizing of the intermediate state to a larger extent than those of the nonconserved conserved residues.
Figure 5.
The conserved nonfunctional residues in the A (V10, W14), G (I111, L115), and H (M131, L135) helices and the nonconserved residues in the B, C, D, and E helices are shown on the background of the sperm whale myoglobin backbone fold;34 residue numbers are indicated. In the studied residues, Cα atoms are shown as circles; the color intensity (see the scale under the figure) increases with increasing parameter for the side chain. Labels of the conserved residues of the A, G, and H helices are underlined.
Figures 4 and 5 show that the interaction strength of the side chains in the intermediate state, although sufficient for maintaining of the intermediate state structure (as follows from NMR results by13), is lower than that in the native state even for the conserved residues: it amounts to 15–50% (of the native state strength) for the conserved residues forming the A, G, H-helical complex and is equal practically to 0% for the nonconserved residues from the B, C, D, and E helices. However, it is shown (unpublished results) that the situation in the folding nucleus for the rate-limiting I↔N transition is quite the opposite to what we found in the folding intermediate: contribution of the conserved residues from the A, G, H helices to stabilization of the folding nucleus in this transition is minor, while contribution of the residues from the B, D, E helices is significant. This means that the intermediate state structure acts as a template for formation of other helices and then the native state.
Qualitatively, our results supplement theoretical31,42 and experimental13,14 studies on protein denaturation as to estimation of the strength of side chain interactions in the molten globule. Besides, they supplement the supposition by Ptitsyn43 that conserved residues are of particular importance for the intermediate of apoMb folding.
Materials and Methods
Expression and isolation
Plasmids with mutant apomyoglobin genes were constructed by PCR using pET17a plasmid (a kind gift of P.E. Wright), containing the sperm whale apomyoglobin gene, and appropriate primers, with the use of a QuikChange (“Stratagene”) kit.44 WT apoMb and its mutants were isolated and purified as described previously36 after expression of appropriate plasmids in E. coli BL21 (DE3) cells.
The protein purity was checked by SDS/PAGE electrophoresis. Protein concentration was determined spectrophotometrically from absorbance at 280 nm using the extinction coefficient  for all samples,45,46 except for one Trp-lacking mutant with substitution W14A; for this one, the used extinction coefficient was determined from nitrogen-based measurements according to46 and appeared
  .37,47
Spectroscopy techniques
Equilibrium measurements of pH-induced denaturing transitions
Equilibrium protein fluorescence (FL) measurements were taken on a Shimadzu RF-5301 PC spectrofluorimeter using standard 1-cm path length quartz cuvettes. The excitation wavelength was 293 nm. The emission spectra were recorded between 300 and 500 nm [with a special attention to the emission intensity at 335 nm (I335)] at a protein concentration of 0.03 mg/mL.
A JASCO J-600 spectropolarimeter (Japan) was used to perform circular dichroism (CD) experiments. Far UV CD spectra were measured between 200 and 250 nm using 0.1 mm path length cells. The protein concentration was 1.0 mg/mL. Molar ellipticity [θ] was calculated as previously:36  where θ is ellipticity measured (deg, 10−3); MRW is the average molecular weight of a residue calculated from the sequence; l is the path length (mm); c is protein concentration (mg/mL).
All experiments were carried out at 11°C in a buffer system with 0.01 M sodium acetate (NaAc) under conditions described previously.36
For every mutant protein, two independent experimental unfolding curves were obtained. Each such titration curve was approximated, as a whole, by a continuous bisigmoid curve using the “SigmaPlot” program (SPSS, www.sigmaplot.com) that allows finding  ,
,  and auxiliary βNI, βIU values and their standard deviations. Then the averaged , values and their standard deviations
  ,
,  were estimated for every mutant from the corresponding values found for the pair of titration curves obtained for this mutant.
Calculation of thermodynamic parameters
The thermodynamic parameters1,38 were calculated from the protein unfolding curves using equations based on the three-state model of N↔I↔U transition.
Fersht's parameter φI for the equilibrium intermediate state (I) was calculated for pH0 = 4.2. It was calculated as in,29 that is, as the ratio between mutation-induced change in stability of the protein intermediate state relative to its unfolded state (ΔΔGIU) and the change occurring in protein stability during the N↔I↔U transition (ΔΔGNU):
| (1) |
where
| (2) |
| (3) |
with the values of  of the total transition N↔I↔U calculated from the equation
| (4) |
since for each separate transition (N↔I and I↔U) its thermodynamic parameters were calculated individually.
Estimation of errors
To calculate the values of φI with all due care, we used a combination of equilibrium data on apoMb unfolding obtained as (i) equilibrium CD measurements, and (ii) equilibrium fluorescence (FL) measurements. Each gave a value of φI with a substantial error. An accurate calculation of the final (average) value of  requires not only
  values calculated by Eq. (1) from results by the above techniques (CD, i = 1; FL, i = 2) but also an optimal choice of weights pi from estimates of errors
  [see Eq. (5) below]. To have the most accurate estimate of , the contribution
  of each technique used to the averaging has to be taken, according to,48,49 as
 |
(5) |
where
 is the error of
  obtained by the i-technique, n is the number of techniques (here, n = 2).
Since obtained by each technique (i = 1, 2) was calculated by Eq. (1), its error is
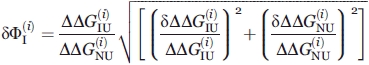 |
(6) |
The  value is calculated from Eq. (2) for the technique i, and its error is
| (7) |
while  is calculated, for the same technique, from Eqs. (3) and (4), and thus its error is
| (8) |
For each technique,  and
and  were calculated with allowance made for (a) the instrument error, (b) errors of approximation of the experimental points by the continuous bisigmoid curve.
The final, averaged from the two techniques used, parameter was obtained as the weighted sum of values (with i = 1, 2; see above)
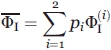 |
(9) |
where the weight pi was calculated from Eq. (5); the resultant error of is given (see Refs. 48 and49) by
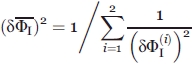 |
(10) |
Acknowledgments
The authors thank P.E. Wright for providing a plasmid with sperm whale apomyoglobin gene, I.A. Kashparov and N.B. Ilyina for their help in protein isolation and protein extinction coefficient determination, O.V. Galzitskaya, D.N. Ivankov and S.A. Garbuzynskiy for their help in modeling of myoglobin unfolding, and E.V. Serebrova for assistance in manuscript preparation.
References
- 1.Tanford C. The transition from native to denatured state. Adv Protein Chem. 1968;23:218–275. [Google Scholar]
- 2.Dobson CM. Characterization of protein folding intermediates. Curr Opin Struct Biol. 1991;1:22–27. [Google Scholar]
- 3.Matthews CR. Pathways of protein folding. Annu Rev Biochem. 1993;62:653–683. doi: 10.1146/annurev.bi.62.070193.003253. [DOI] [PubMed] [Google Scholar]
- 4.Ptitsyn OB. Molten globule and protein folding. Adv Protein Chem. 1995;47:83–229. doi: 10.1016/s0065-3233(08)60546-x. [DOI] [PubMed] [Google Scholar]
- 5.Dobson CM. The nature and significance of protein folding. In: Pain RH, editor. Mechanisms of protein folding. Oxford, UK: Oxford University Press; 2000. pp. 1–33. [Google Scholar]
- 6.Arai M, Kuwajima K. Role of the molten globule state in protein folding. Adv Protein Chem. 2001;53:209–282. doi: 10.1016/s0065-3233(00)53005-8. [DOI] [PubMed] [Google Scholar]
- 7.Roder H, Elove GA. Early stages of protein folding. In: Pain RH, editor. Mechanisms of protein folding. Oxford: Oxford University Press; 1994. pp. 26–54. [Google Scholar]
- 8.Kim PS, Baldwin RL. Intermediates in the folding reactions of small proteins. Annu Rev Biochem. 1990;59:631–660. doi: 10.1146/annurev.bi.59.070190.003215. [DOI] [PubMed] [Google Scholar]
- 9.Goto Y, Fink AL. Phase diagram for acidic conformational states of apomyoglobin. J Mol Biol. 1990;214:803–805. doi: 10.1016/0022-2836(90)90334-I. [DOI] [PubMed] [Google Scholar]
- 10.Clarke A, Waltho JP. Protein folding pathways and intermediates. Curr Opin Biotechnol. 1997;8:400–410. doi: 10.1016/s0958-1669(97)80060-2. [DOI] [PubMed] [Google Scholar]
- 11.Roder H, Colon W. Kinetic role of early intermediates in protein folding. Curr Opin Struct Biol. 1997;7:15–28. doi: 10.1016/s0959-440x(97)80004-8. [DOI] [PubMed] [Google Scholar]
- 12.Eliezer D, Wright PE. Is apomyoglobin a molten globule? Structural characterization by NMR. J Mol Biol. 1996;263:531–538. doi: 10.1006/jmbi.1996.0596. [DOI] [PubMed] [Google Scholar]
- 13.Nishimura C, Dyson HJ, Wright PE. Enhanced picture of protein-folding intermediates using organic solvents in H/D exchange and quench-flow experiments. Proc Natl Acad Sci USA. 2005;102:4765–4770. doi: 10.1073/pnas.0409538102. [DOI] [PMC free article] [PubMed] [Google Scholar]
- 14.Nishimura Ch, Dyson HJ, Wright PE. Identification of native and non-native structure in kinetic folding intermediates of apomyoglobin. J Mol Biol. 2006;355:139–156. doi: 10.1016/j.jmb.2005.10.047. [DOI] [PubMed] [Google Scholar]
- 15.Gast K, Damaschun H, Muller-Frohne M, Zirwer D, Damaschun G. Compactness of protein molten globules: temperature-induced structural changes of the apomyoglobin folding intermediate. Eur Biophys J. 1994;23:297–306. doi: 10.1007/BF00213579. [DOI] [PubMed] [Google Scholar]
- 16.Griko YV, Privalov PL. Thermodynamic puzzle of apomyoglobin unfolding. J Mol Biol. 1994;235:1318–1325. doi: 10.1006/jmbi.1994.1085. [DOI] [PubMed] [Google Scholar]
- 17.Cocco MJ, Lecomte JT. The native state of apomyoglobin described by proton NMR spectroscopy: the A-B-G-H interface of wild-type sperm whale apomyoglobin. Proteins. 1996;25:267–285. doi: 10.1002/(SICI)1097-0134(199607)25:3<267::AID-PROT1>3.0.CO;2-D. [DOI] [PubMed] [Google Scholar]
- 18.Pfeil W. Stability and cooperative features of partially folded proteins. Biochemistry (Moscow) 1998;63:294–302. [PubMed] [Google Scholar]
- 19.Griko YV, Privalov PL, Veniaminov SYu, Kutyshenko VP. Thermodynamic study of the apomyoglobin structure. J Mol Biol. 1988;202:27–35. doi: 10.1016/0022-2836(88)90525-6. [DOI] [PubMed] [Google Scholar]
- 20.Eliezer D, Yao J, Dyson HJ, Wright PE. Structural and dynamic characterization of partially folded states of apomyoglobin and implication for protein folding. Nat Struct Biol. 1998;5:148–154. doi: 10.1038/nsb0298-148. [DOI] [PubMed] [Google Scholar]
- 21.Hughson FM, Wright PE, Baldwin RL. Structural characterization of a partly folded apomyoglobin intermediate. Science. 1990;249:1544–1551. doi: 10.1126/science.2218495. [DOI] [PubMed] [Google Scholar]
- 22.Jennings PA, Wright PE. Formation of a molten globule intermediate early in the kinetic folding pathway of apomyoglobin. Science. 1993;262:892–896. doi: 10.1126/science.8235610. [DOI] [PubMed] [Google Scholar]
- 23.Hughson FM, Barrick D, Baldwin RL. Probing the stability of a partly folded apomyoglobin intermediate by site-directed mutagenesis. Biochemistry. 1991;30:4113–4118. doi: 10.1021/bi00231a001. [DOI] [PubMed] [Google Scholar]
- 24.Kay MS, Baldwin RL. Packing interactions in apomyoglobin folding intermediate. Nat Struct Biol. 1996;3:439–445. doi: 10.1038/nsb0596-439. [DOI] [PubMed] [Google Scholar]
- 25.Kay MS, Baldwin RL. Alternative models for describing the acid unfolding of the apomyoglobin folding intermediate. Biochemistry. 1998;37:7859–7868. doi: 10.1021/bi9802061. [DOI] [PubMed] [Google Scholar]
- 26.Luo Y, Kay MS, Baldwin RL. Cooperativity of folding of the apomyoglobin pH 4 intermediate studied by glycine and proline mutations. Nat Struct Biol. 1997;4:925–930. doi: 10.1038/nsb1197-925. [DOI] [PubMed] [Google Scholar]
- 27.Kay MS, Ramos CHI, Baldwin RL. Specificity of native-like interhelical hydrophobic contacts in the apomyoglobin intermediate. Proc Natl Acad Sci USA. 1999;96:2007–2012. doi: 10.1073/pnas.96.5.2007. [DOI] [PMC free article] [PubMed] [Google Scholar]
- 28.Bertagna AM, Barrick D. Nonspecific hydrophobic interactions stabilize an equilibrium intermediate of apomyoglobin at a key position within the AGH region. Proc Natl Acad Sci USA. 2004;101:12514–12519. doi: 10.1073/pnas.0404760101. [DOI] [PMC free article] [PubMed] [Google Scholar]
- 29.Fersht AR. Protein folding and stability: the pathway of folding of barnase. FEBS Lett. 1993;325:5–16. doi: 10.1016/0014-5793(93)81405-o. [DOI] [PubMed] [Google Scholar]
- 30.Ptitsyn OB, Ting K-LH. Non- functional conserved residues in globins and their possible role as a folding nucleus. J Mol Biol. 1999;291:671–677. doi: 10.1006/jmbi.1999.2920. [DOI] [PubMed] [Google Scholar]
- 31.Shakhnovich EI, Finkelstein AV. Theory of cooperative transitions in protein molecules. 1. Why denaturation of globular protein is a first-order phase transition? Biopolymers. 1989;28:1667–1680. doi: 10.1002/bip.360281003. [DOI] [PubMed] [Google Scholar]
- 32.Galzitskaya OV, Finkelstein AV. A theoretical search for folding/unfolding nuclei in three-dimensional protein structures. Proc Natl Acad Sci USA. 1999;96:11299–11304. doi: 10.1073/pnas.96.20.11299. [DOI] [PMC free article] [PubMed] [Google Scholar]
- 33.Garbuzynskiy SA, Finkelstein AV, Galzitskaya OV. On the prediction of folding nuclei in globular proteins. Mol Biol (Moscow) 2005;39:1032–1041. [PubMed] [Google Scholar]
- 34.Vojtechovsky J, Chu K, Berendzen J, Sweet RM, Schlichting I. Crystal structures of myoglobin-ligand complexes at near-atomic resolution. Biophys J. 1999;77:2153–2174. doi: 10.1016/S0006-3495(99)77056-6. [DOI] [PMC free article] [PubMed] [Google Scholar]
- 35.Barrick D, Baldwin RL. Three-state analysis of sperm whale apomyoglobin folding. Biochemistry. 1993;32:3790–3796. doi: 10.1021/bi00065a035. [DOI] [PubMed] [Google Scholar]
- 36.Baryshnikova EN, Melnik BS, Finkelstein AV, Semisotnov GV, Bychkova VE. Three-state protein folding: experimental determination of free-energy profile. Protein Sci. 2005;14:2658–2667. doi: 10.1110/ps.051402705. [DOI] [PMC free article] [PubMed] [Google Scholar]
- 37.Dyuysekina AE, Dolgikh DA, Samatova (Baryshnikova) EN, Tiktopulo EI, Balobanov VA, Bychkova VE. pH-Induced equilibrium unfolding of apomyoglobsubstitutions at conserved Trp 14 and Met 131 and nonconserved Val 17 positions. Biochemistry (Moscow) 2008;73:693–701. doi: 10.1134/s0006297908060102. [DOI] [PubMed] [Google Scholar]
- 38.Pace CN. Determination and analysis of urea and guanidine hydrochloride denaturation curves. Methods Enzymol. 1986;131:266–280. doi: 10.1016/0076-6879(86)31045-0. [DOI] [PubMed] [Google Scholar]
- 39.Jamin M, Geierstanger B, Baldwin RL. The pKa of His-24 in the folding transition state of apomyoglobin. Proc Natl Acad Sci USA. 2001;98:6127–6131. doi: 10.1073/pnas.111157998. [DOI] [PMC free article] [PubMed] [Google Scholar]
- 40.Garcia-Moreno BE, Chen LX, March KL, Gurd RS, Gurd FRN. Electrostatic interactions in sperm wale myoglobin. J Biol Chem. 1985;260:14070–14082. [PubMed] [Google Scholar]
- 41.Matouschek A, Kellis JT, Serrano L, Fersht AR. Transient folding intermediates characterized by protein engineering. Nature. 1990;346:440–445. doi: 10.1038/346440a0. [DOI] [PubMed] [Google Scholar]
- 42.Finkelstein AV, Shakhnovich EI. Theory of cooperative transitions in protein molecules. 2. Phase diagram for a protein molecule in solution. Biopolymers. 1989;28:1681–1694. doi: 10.1002/bip.360281004. [DOI] [PubMed] [Google Scholar]
- 43.Ptitsyn OB. Structures of folding intermediates. Curr Opin Struct Biol. 1995;5:74–78. doi: 10.1016/0959-440x(95)80011-o. [DOI] [PubMed] [Google Scholar]
- 44.Jennings PA, Stone MJ, Wright PE. Overexpression of myoglobin and assignment of the amid, Cα and Cβ resonances. J Biomol NMR. 1995;6:271–276. doi: 10.1007/BF00197808. [DOI] [PubMed] [Google Scholar]
- 45.Harrison SC, Blout ER. Reversible conformational changes of myoglobin and apomyoglobin. J Biol Chem. 1965;240:299–303. [PubMed] [Google Scholar]
- 46.Jaenicke L. A rapid micromethod for the determination of nitrogen and phosphate in biological material. Anal Biochem. 1974;61:623–627. doi: 10.1016/0003-2697(74)90429-1. [DOI] [PubMed] [Google Scholar]
- 47.Baryshnikova EN, Sharapov MG, Kashparov IA, Ilyina NB, Bychkova VE. Investigation of apomyoglobin stability depending on urea and temperature at two different pH values. Mol Biol (Moscow) 2005;39:292–297. [PubMed] [Google Scholar]
- 48.Madelung E. Die mathematischen Hilfsmittel des Physikers, Part 1, Section 13-C. Berlin: Springer Verlag.; 1957. [Google Scholar]
- 49.Korn GA, Korn TM. Mathematical handbook. New York: McGraw Hill Book Company; 1961. [Google Scholar]