

Abstract
Visualization of nanoparticles without intrinsic optical fluorescence properties is a significant problem when performing intracellular studies. Such is the case with titanium dioxide (TiO2) nanoparticles. These nanoparticles, when electronically linked to single stranded DNA oligonucleotides, have been proposed to be used both as gene knockout devices and as possible tumor imaging agents. By interacting with complementary target sequences in living cells, these photo-inducible TiO2-DNA nanoconjugates have the potential to cleave intracellular genomic DNA in a sequence specific and inducible manner. The nanoconjugates also become detectable by magnetic resonance imaging (MRI) with the addition of gadolinium Gd(III) contrast agents. Herein we describe two approaches for labeling TiO2 nanoparticles and TiO2-DNA nanoconjugates with optically fluorescent agents. This permits, for the first time, direct quantification of fluorescently labeled TiO2 nanoparticle uptake in a large population of living cells (>104 cells). X-Ray Fluorescence Microscopy (XFM) was combined with fluorescent microscopy to determine the relative intracellular stability of the nanoconjugates. It was also used to quantify intracellular nanoparticles. Imaging the DNA component of the TiO2-DNA nanoconjugate by fluorescent confocal microscopy within the same cell showed an overlap with the titanium signal as mapped by XFM. This strongly implies the intracellular integrity of the TiO2-DNA nanoconjugates in malignant cells.
Keywords: TiO2-DNA Nanoconjugate, Nanoparticle, X-Ray Fluorescence Microscopy, Titanium Dioxide
1. Introduction
Some of the most examined nanoparticles to date are those composed of titanium dioxide (TiO2) due to their unique photocatalytic and structural properties. TiO2 nanoparticles have been investigated for potential uses as disinfectants,[1-3] diagnostic assays,[4] biological probes,[5] tumor cell killing agents,[6-8] and even for gene targeting.[9-11] These nanoparticles make an attractive mechanism to target cancer cells since photo-activation of TiO2 (1000 μg/ml) with energies of 3.2 eV causes a release of reactive oxygen species (ROS).[12] Photo-excited TiO2 nanoparticles were shown to cause significant cell death in various cancer cell lines.[6-8] While the bulk form of TiO2 is considered generally biologically inert,[1] there is some controversy as to the extent of TiO2 nanoparticle cytoxicity.[8, 13-16] Recently, however, intravenous tail-vein injection of 5 mg/kg of TiO2 nanoparticles (<100 nm) into male Wistar rats showed no deleterious effects on organ function and caused no detectable inflammatory response in vivo.[17]
Our laboratory is investigating the use of TiO2 nanoparticles bound to single stranded DNA oligonucleotides creating TiO2-DNA nanoconjugates. Reduction of particle size below 20 nm results in TiO2 surface corner defects that can be repaired through covalent bonds with ortho-substituted enediol ligands (e.g. dopamine, alizarin) forming stable charge transfer complexes.[18-20] The TiO2-DNA nanoconjugates are being examined as potential gene targeting devices, and imaging agents for the detection of tumors. The nanoconjugate consists of a TiO2 nanoparticle covalently bound to dopamine which is itself bound to a single stranded DNA oligonucleotide (Figure 1).[9] The DNA maintains its sequence specific hybridization, while the nanoparticle component maintains its photocatalytic properties.[9, 20] When photo-activated, a charge separation occurs within the nanoparticle, resulting in the migration of an electropositive hole (h+) from the nanoparticle, through the dopamine, and onto the DNA[20, 21] finally resulting in its scission.[9] Therefore, TiO2-DNA nanoconjugates should be able to specifically cleave mutated genomic DNA in a sequence-specific and inducible manner. In this way, they have the potential to specifically and effectively target oncogenes that represent desirable therapeutic targets (e.g. ras, myc).[22-25] By conjugating dopamine modified gadolinium Gd(III) contrast agents directly to the surface of the TiO2 nanoparticle, the nanoconjugates become detectable by T1 weighted Magnetic Resonance Imaging (MRI),[26, 27] therefore possibly allowing in vivo detection of tumors.
Figure 1.
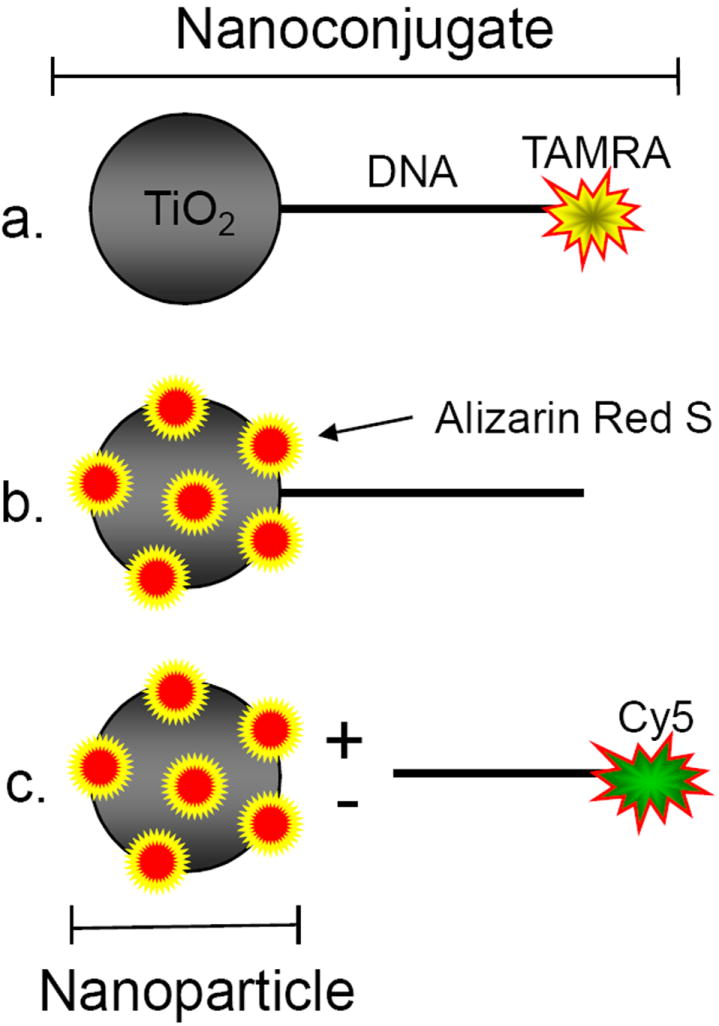
Schematic Representation of Fluorescent Labeling of TiO2-DNA Nanoconjugates. a. DNA ODNs are labeled at the 3’ end with TAMRA, while the 5’ carboxyl dT terminal ODN end is modified with dopamine (not depicted) which can subsequently bind the oxygen-depleted “surface defects” of TiO2 nanoparticles < 20 nm[cite]. This creates a TiO2-dopamine-ODN(TAMRA) nanoconjugate. b. Direct covalent conjugation of Alizarin Red S (ARS) to the undercoordinated “surface defects” of TiO2 nanoparticles creating an ARS labeled TiO2-ODN nanocomposite. c. Direct ARS labeling of nanoparticle unbound to ODN with the addition of free Cy5 labeled ODN to track both components independently.
Despite extensive research into the interaction between cells and TiO2 nanoparticles, the lack of variety in techniques to allow in vitro and in vivo TiO2 detection has hindered statistical analysis of large scale cell-TiO2 nanoparticle interaction studies. Most studies to date rely primarily on transmission electron microscopy (TEM) to determine nanoparticle internalization, and some verify this with Energy Filtering TEM (EFTEM).[13, 14, 28, 29] Despite the high spatial resolution of these techniques, they only permit analysis of relatively small cell numbers, and require sectioning of the biological samples. TiO2 nanoparticles have recently have been conjugated to 5-malmadeine fluorescein dyes,[8] but fluorescein can be quenched upon binding of the TiO2 nanoparticle with enediol ligands (e.g. dopamine).[4] It is also possible to detect a change in side scatter characteristic of cell populations using flow cytometry as a function of TiO2 nanoparticle uptake.[30] Since, however, side scatter is only an indicator of cell granularity[31] it cannot directly detect the nanoparticles themselves, and thus requires treatment with relatively high numbers of nanoparticles. Therefore additional methods for detecting intracellular TiO2 are greatly needed.
Recently, our group has used X-Ray Fluorescence Microscopy (XFM) to detect and map nanoparticles directly in whole cells based on their titanium content.[9, 10] XFM is a powerful and sensitive technique (which detects as few as several thousand atoms[32]) using bright X-rays to excite element specific Kα X-ray fluorescence and create a quantitative and qualitative elemental map of biological samples at submicron resolutions.[32-35]
Using XFM and TEM, our group has shown that the TiO2-DNA nanoconjugates can be specifically retained in subcellular compartments where complementary nuclear or mitochondrial DNA is present.[9, 10] It is crucial for further investigations of TiO2 that large populations of cells be examined rapidly and consistently. In order to achieve this goal we devised methods to modify the TiO2 nanoparticle with optical fluorescent dyes which are normally invisible by optical microscopy except at very high quantities. We have accomplished this by using fluorescently labeled DNA oligonucleotides, and by labeling the nanoparticles directly with Alizarin Red S (ARS). The ARS surface modification can be performed either before or after nanoparticles have been taken up by cells. Subsequently, this permitted the use of high throughput techniques such as flow cytometry to quantify cellular uptake of nanoparticles. It also allowed direct investigation into the cytotoxicity of nanoparticles in conjunction with nanoparticle uptake. Fluorescent modification of nanoparticles combined with XFM allowed determination of the relative intracellular TiO2-DNA nanoconjugate stability.
2. Results and Discussion
One of the limiting factors in TiO2 nanoparticles studies is the lack of diversity in available intracellular detection techniques. Taking advantage of the surface chemistry of TiO2 nanoparticles, the nanoparticle/nanoconjugates were fluorescently labeled by two separate approaches. At 20 nm or below, the metal oxide nanoparticle’s surface geometry changes from a pentacoordinated to a hexacoordinated position.[19] These undercoordinated “surface defects” have a high affinity for ortho-substituted enediol ligands (e.g. dopamine, alizarin, ascorbic acid) that restore the surface titanium atom’s coordination back to its relaxed, octahedral form upon binding.[19, 36] DNA oligonucleotides that had their 5’ dT terminal ends carboxyl modified, were bound to dopamine as described earlier.[9, 10, 20] Their 3’ terminal ends were labeled with either fluorescent tetramethylrhodamine (TAMRA) or Cy5. The 5’ dopamine modified end was then used to covalently link the DNA oligonucleotide directly to the surface of the nanoparticle creating a stable TiO2-dopamine-DNA nanoconjugate with a fluorescently labeled nucleic acid component (Figure 1).
In an attempt to establish a simple, inexpensive, and covalent process to fluorescently label the nanoparticle directly for intracellular detection, we modified the surface of the metal-oxide nanoparticles with Alizarin Red S (ARS). We suspected that binding of ARS to nanoparticles would render them highly fluorescent since locally high concentrations of ARS molecules increase their local concentration and light absorbance. ARS (a derivative of alizarin) is an ortho-substituted enediol ligand that has never been previously reported to be used as an intracellular label for TiO2 nanoparticles. ARS has been used in optical microscopy for fluorescent labeling of calcium deposits.[37, 38] Since the same hydroxyl groups of ARS are significant in the binding to both calcium and TiO2,[38] the nanoparticle bound ARS should be precluded from binding calcium. It has been reported that ARS is able to form complexes with proteins at low pH (3.6), although this was almost completely inhibited as pH values approached physiological conditions.[39] For direct surface binding to the nanoparticle, ARS was added to 5 nm TiO2 nanoparticles. The nanoparticles’ UV-VIS absorbance spectra were analyzed since surface modification of the nanoparticle will cause a change in absorbance. Results from Figure 2 show that TiO2 nanoparticles show absorption wavelengths smaller than 350 nm. Conjugation of 44% of the total surface titanium atoms with ARS (TiO2-ARS) caused a red shift and creation of a unique absorption maximum at 510 nm. This fluorescence could be excited at relatively long wavelengths (absorption peak at 510 nm is very broad) which have higher tissue/cell penetrance than the UV wavelengths. The UV-VIS absorbance spectra of the TiO2-ARS complex was very similar to those published of TiO2-Alizarin.[18, 40] This is not surprising since the two polycyclic aromatic molecules differ only in the addition of a sulfonate group on ARS (1,2 dihydroxyanthraquinone vs. 1,2 dihydroxyanthraquinone-3-sulfonate). ARS alone at the same concentration had an absorbance peak at 420 nm.
Figure 2.
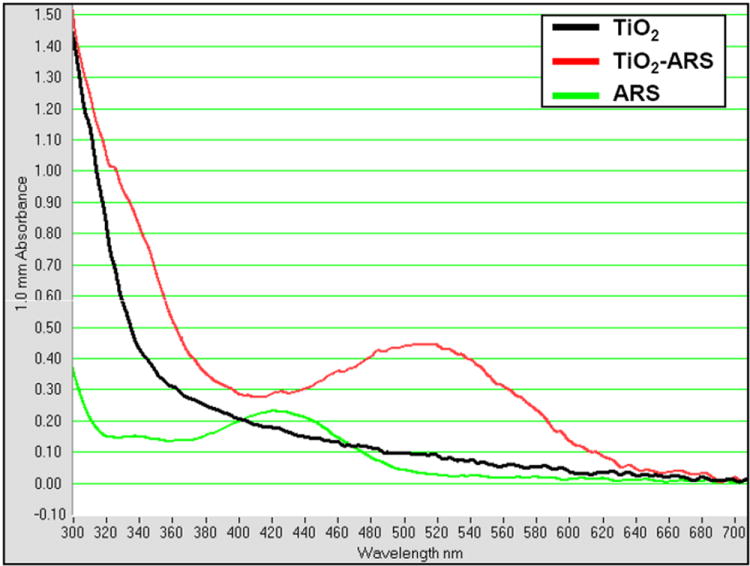
UV-VIS Absorbance Spectrum of ARS Coated TiO2 Nanoparticles. TiO2 nanoparticles at 5 mM alone cause an onset of absorption near 350 nm. The addition of ARS (0.9 mM) to TiO2 nanoparticles (TiO2-ARS) to coat approximately 5% of the total available surface titanium atoms, however, results in a distinct absorbance maximum at approximately 510 nm indicating the covalent surface modification of the nanoparticles. ARS alone at the same concentration (0.9 mM) has an absorbance peak at 420 nm.
To determine if the ARS modified nanoparticles in cells are detectable by fluorescent confocal microscopy, prostate cancer PC-3M and breast cancer MCF-7 cells were serum-starved and treated with ARS coated TiO2 nanoparticles (TiO2-ARS). As controls, cells were left untreated, treated with ARS alone, or treated with uncoated TiO2. Absolute ARS and nanoparticle concentrations were the same in each case. The treated cells were then imaged using two separate excitation lasers: 488 nm and 543 nm. A previous study claimed to have detected TiO2 nanoparticles directly using an excitation laser of 488 nm with emission filters between 505-550 nm.[30] Figure 3A, third row, shows the results when similar experimental and microscopy parameters were used. Cells were treated with the nanoparticles which lead to a significant accumulation of nanoparticles on the cell surface as well as internalized nanoparticles. It is noteworthy that further experiments used an acidic glycine wash (200 mM, pH 4.0) in order to decrease surface bound nanoparticles. Extensive washing in low pH glycine was demonstrated to reduce oligonucleotide binding to the cell surface.[41] We found that it also significantly reduced the extent of nanoparticle binding to the cell membrane (data not shown). Unlabeled TiO2 nanoparticles did not exhibit a detectable fluorescent signal using a 488 nm excitation laser and a 505-530 nm bandpass filter for signal detection. The difference compared to the previous study[30] may perhaps be caused by different properties/sizes of nanoparticles (23 nm vs. 5 nm), different degree of nanoparticle accumulation within cells, or different degree of background fluorescence. Treatment of cells with TiO2-ARS (fourth row) did, however, result in a strong fluorescent signal in the range of 560-615 nm when excited with a 543 nm laser. Thus ARS modified nanoparticles are fluorescent emitting at 560-615 nm wavelengths where little background fluorescence from can be expected. Importantly, cells treated with ARS alone did not produce a detectable fluorescent signal with either excitation laser. Non-specific retention of ARS did not occur within the cells under the conditions tested, and ARS was not able to form significant fluorescent intracellular complexes without conjugation to the TiO2 nanoparticle.
Figure 3.
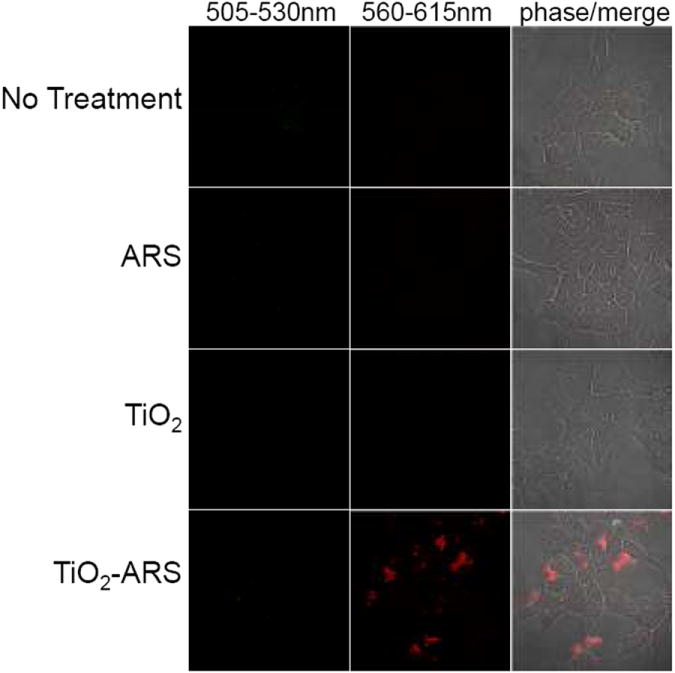
Intracellular detection of ARS modified TiO2 Nanoparticles. Prostate Carcinoma PC3-M cells were placed in serum-free medium for 1 hour and were either untreated (top), treated with 60 μM ARS alone, treated with 333 μM of undmodified TiO2 nanoparticles, or nanoparticles coated with ARS (5% nanopartile surface coating) for 1 hour. Results show that there was no detectable fluorescent signal from TiO2 directly using bandpass filters of 505-530 nm or 560-615 nm (excitation= 488 nm and 543 nm). A strong fluorescent signal was only detected for nanoparticles modified with ARS using a 560-615 nm bandpass filter (excitation= 543 nm) while unmodified nanoparticles, and ARS alone showed no signal.
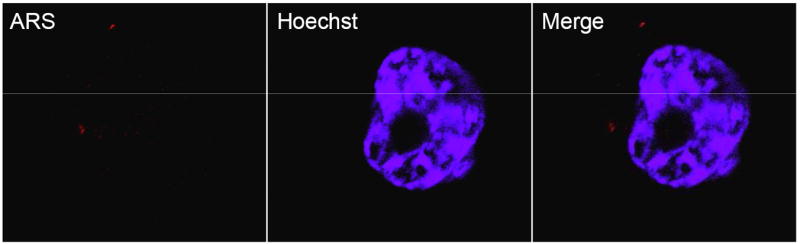
In order to determine if post-treatment fluorescent labeling of nanoparticles already internalized into cells with ARS was possible, PC-3M cells were treated with unlabeled nanoparticles, fixed, and subsequently stained with an ARS solution in phosphate buffered saline solution (PBS). Results in Figure 3B show a detectable intracellular ARS fluorescence within the cytoplasm. Fixed cells that were not previously treated with TiO2 did not exhibit a detectable fluorescent signal upon treatment with the ARS solution (Figure 3A). This suggests that internalization of nanoparticles was not due to ARS coating, and that ARS was able to bind intracellular TiO2 particles in fixed cells.
Our group has previously conjugated glycidyl isopropyl ether (GIE) to the surface of TiO2 nanoparticles (TiO2-GIE) in order to reduce bio-reactivity of the nanoparticle within cells.[9, 10] The use of uncoated TiO2 nanoparticles is also of significance since their excitation produces an abundance of reactive oxygen species which can be used for cell killing without gene specific targeting.[6, 8] Therefore, we determined the viability of cells that have taken up GIE coated or uncoated TiO2 nanoparticles. Viability assays require investigation of thousands of cells and could never be done in conjunction with TEM or XFM. Labeling the nanoparticles, however, allowed us to screen the treated cells simultaneously for nanoparticle uptake (by ARS fluorescence) and for viability (by use of fluorescent cell-impermeable dye). PC-3M cells were treated with GIE coated and uncoated TiO2 nanoparticles labeled with ARS. As a control, 20 mM hydrogen peroxide (H2O2) was used as an inducer of cell death.[42] Flow cytometry was then used to quantify both the extent of nanoparticle uptake within the cell population, and the cells’ ability to exclude cell-impermeable DAPI as an indicator of cell viability. Results show that when treated with ARS alone, virtually the entire population of cells was viable and capable of dye exclusion (Figure 4A). Both of the TiO2 nanoparticles treated cells (TiO2-GIE-ARS and TiO2-ARS) showed no significant decrease in viability, with the number of dead cells averaging 5% and 2%, respectively (n=3). H2O2 treated cells, on the other hand, showed an approximately 54% reduction in viability. This suggested that neither TiO2-ARS nor TiO2-GIE-ARS nanoparticles had a significant effect on cell viability at the concentration used in the experiments described herein. These results were confirmed in MCF-7 cells (data not shown).
Figure 4.
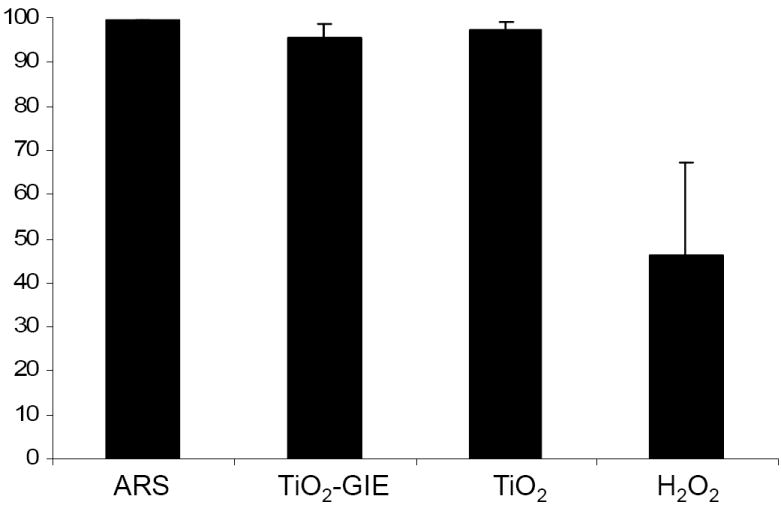
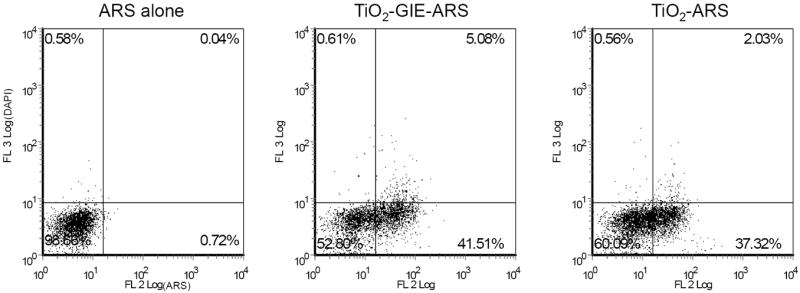
A. Effect of TiO2 Nanoparticles on Cell Viability. PC3-M cells were treated with 333 μM of ARS labeled Glycidyl Isopropyl Ether (GIE) coated TiO2, uncoated TiO2 nanoparticles, or 200 mM hydrogen peroxide (H2O2) as a cell death control for 24 hours. Then cells were washed, collected, and analyzed by flow cytometry for their ability to exclude fluorescent DAPI as a marker for cell viability. Results show that neither TiO2 treated cell population showed a decrease in ability to exclude DAPI, while hydrogen peroxide treated cells showed an approximately 54% reduction in cell viability.
B. Quantification of TiO2-ARS Nanoparticle Uptake. Uptake of TiO2-ARS nanoparticles by PC3-M cells was also analyzed in the same cells from Figure 4A based on their extent of ARS fluorescence. Above is a representative plot of the results obtained from three independent experiments. Cells treated with ARS alone do not exhibit significant fluorescence in the FL2 channel (excitation at 543 nm), while cells treated with ARS modified nanoparticles show a significant increase in the number of cells which internalize the fluorescently labeled metal-oxide nanoparticle.
While simultaneously detecting cell viability, samples were also analyzed for ARS fluorescence as an indicator of nanoparticle uptake. Internalization of nanoparticles was shown by the number of cells excited to fluoresce using similar parameters to those performed during microscopy. Figure 4B is a representative plot of several experiments performed (n=3), showing that cells treated with ARS alone exhibited very low auto-fluorescence (excitation with 543 nm laser, emission in 560-615 nm range). Cells treated with TiO2-GIE-ARS showed an average nanoparticle uptake of 36% within the cell population, while TiO2 nanoparticles lacking GIE had a similar nanoparticle internalization of 32%. This suggested that GIE did not significantly aid in the internalization of the nanoparticle, nor did it affect viability of cells. Importantly, ARS could be used by both confocal microscopy and flow cytometry to detect intracellular TiO2 nanoparticles.
To determine the subcellular localization of the separate components of the TiO2-DNA nanoconjugates, cells were treated simultaneously with both TiO2-ARS nanoparticles and free Cy5 labeled unbound DNA oligonucleotides. After treatment and washes, the cells were imaged by confocal microscopy. Results in Figure 5 show that there was a strong accumulation of the ARS labeled nanoparticles in endosomal vesicles within the cytoplasm. Although it is possible that the endocytic mechanisms of TiO2 nanoparticles change due to ARS labeling, the subcellular distribution was similar to that seen when the Alizarin Red S was used for post-treatment staining (Figure 3B); in addition work by others with unlabeled nanoparticles using transmission electron microscopy showed similar nanoparticle distribution.[14] This would suggest that the uptake mechanism was not altered due to Alizarin Red S surface labeling. The free oligonucleotides, on the other hand, showed a strong localization within the nuclei, and more strikingly within the nucleoli. This was similar to the results previously obtained with free oligonucleotides[43-45] and by our group with complete nanoconjugates.[9, 10] These results demonstrated that the separate components of the nanoconjugates (the nanoparticle and DNA oligonucleotide) accumulated in separate subcellular organelles and did not co-localize within the same cell if not covalently bound together. This suggests that the separate components enter the cell via unique internalization mechanisms, or are distinctly trafficked within the cell. Although these mechanisms have been extensively studied for oligonucleotides in various cell lines,[46-49] this is not the case for TiO2 nanoparticles. Further experiments aimed at determining these mechanisms are vitally needed since the modes of trafficking and internalization have a direct impact on subcellular localization and potential cytotoxicity.
Figure 5.
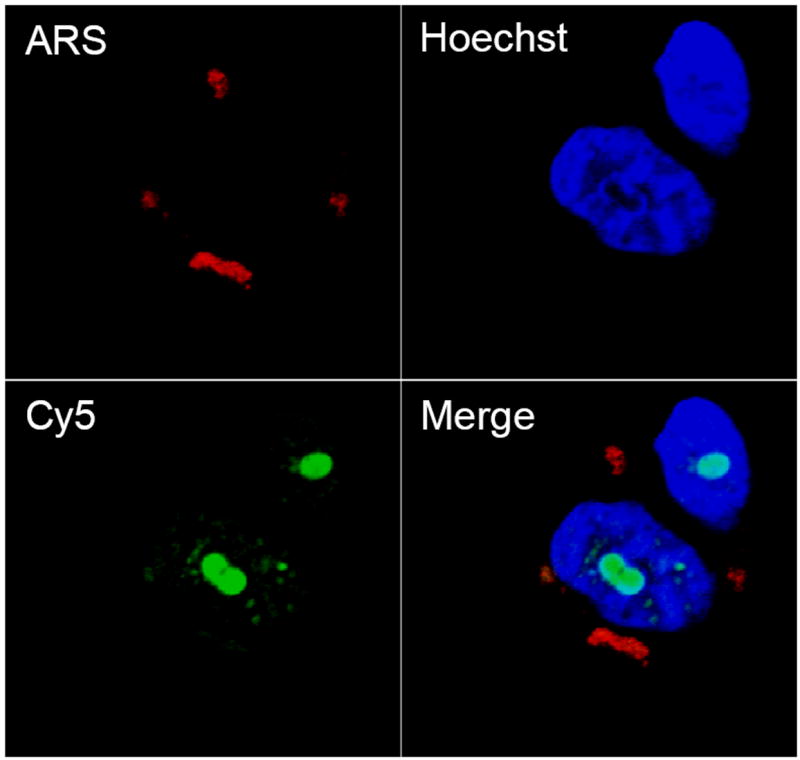
A. Localization of TiO2 Nanoparticle uptake versus free unbound ODN in PC3M cells. Serum starved cells were treated for 1 hr. with 333 μM of ARS coated TiO2 nanoparticles and with 160 μM of free unbound Cy5 labeled ODN to determine the subcellular localization of each component separately. Results show that the nanoparticles themselves accumulate within endosomal/lysosomal vesicles in the cytoplasm while the ODNs localize with the nucleus and nucleoli.
B. Labeling Intracellular TiO2 in fixed cells. PC3-M cells were treated with unlabeled TiO2 and washed as described above. After fixing in 4% paraformaldehyde, cells were treated with 0.9 mM ARS in PBS for 30 minutes to label the already internalized nanoparticles. Results showed that internalization of TiO2 is not dependent on ARS surface modification, and that it is possible to label intracellular nanoparticles in fixed cells.
Since the functionality and targeting of the nanoconjugates are greatly dependent on their integrity, we combined confocal microscopy with X-Ray Fluorescent Microscopy (XFM) to track both components independently within the same cell. Confocal microscopy was used to detect the DNA oligonucleotide component, while XFM was used to directly detect titanium (and thereby the nanoparticles). XFM was performed at the 2-ID-D beamline at the Advanced Photon Source at Argonne National Laboratories. XFM mapped the location and concentration of elements ranging from phosphorus to zinc on the periodic table (including titanium) using raster scanning with step sizes of 0.3 μm.
Figure 6A shows the results from confocal microscopy compared to that obtained from XFM. Confocal microscopy revealed several small accumulations of the TAMRA labeled DNA oligonucleotides within the cytoplasm and a stronger signal aligned with the nucleus. XFM analysis revealed a distribution of titanium that was very similar to that of TAMRA. The phosphorus map also revealed a strong co-localization with titanium and TAMRA. This is probably an artifact due to the fixing, staining, and mounting techniques involved in sample preparation. Titanium concentration, however, was determined only by the presence of nanoparticles. Figure 6B shows quantification of the number of nanoparticles located within the specified regions of interest (ROI). ROI 1 corresponds to a detectable XFM titanium signal (3.1×10⁴ nanoparticles) although the TAMRA signal of this nanoparticle accumulation was only very weakly visible. Each nanoparticle was modified by approximately 2 TAMRA labeled oligonucleotides so that the optically fluorescent signal corresponds to 6.2 ×10⁴ TAMRA molecules. The strongest titanium signal came from ROI 3 and showed the presence of approximately 1.3 × 10⁶ nanoparticles. Confocal microscopy also showed a clearly detectable TAMRA signal within the same relative subcellular area. There are several titanium distributions obtained by XFM that were not imaged by confocal microscopy. This is likely due to the fact that the hard X-rays used in XFM are able to penetrate the entire cell, while confocal microscopy imaged optical cell slices of 0.13 μm thickness. To verify this, multiple planes of cells treated with ARS labeled TiO2-DNA nanoconjugates were visualized by confocal microscopy and subsequently imaged by XFM. Results showed that accumulations of the ARS labeled TiO2-DNA nanoconjugates were not visible in one plane of microscopy, but were visible in different planes. At the same time, however, both of the aggregates were shown to overlap with titanium (Figure 7). As few as 7.9×10⁴ nanoparticles were detectable by fluorescence microscopy when 44% of the total surface of the TiO2 nanoparticle was coated with ARS (Figure 7, ROI 1). The overall similarity in the distributions of both TAMRA labeled DNA oligonucleotide and titanium nanoparticle strongly suggest that the integrity of the TiO2-DNA nanoconjugates remains intact at the time point examined (12 hours).
Figure 6. Combining X-Ray Fluorescence Microscopy and Fluorescent Confocal Microscopy.
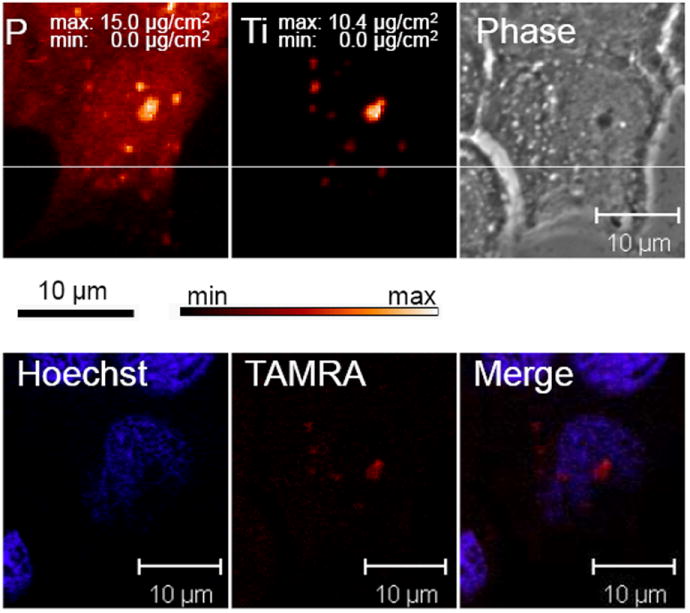
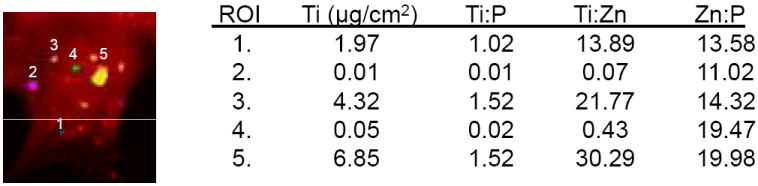
A. Combined Use of XFM and fluorescent microscopy to determine relative Nanoconjugate Stability. Breast cancer MCF-7 cells were transfected with 333 μM of TAMRA labeled TiO2-DNA nanoconjugates, sorted by FACS, seeded on formvar coated EM grids, and allowed to adhere. Next, cells were placed in anti-fade mounting medium and visualized by fluorescent confocal microscopy for the presence of Hoechst and TAMRA. Following microscopy, the EM grids were washed in PBS, and dehydrated in 100% ethanol. Finally same cells were located and analyzed at the 2-ID-D beamline at the Advanced Photon Source at Argonne National Laboratories for the location and concentration of elements from phoshorus to zinc on the periodic table. Top left/center are the images of phosphorus (P) and titanium (Ti) obtained by XRF. Black bar= 10 um for XFM images while white bar= 10 um for confocal images.
B. Quantitative Analysis of Regions of Interest (ROI). Several regions of interest were further analyzed to quantify levels of titanium. Regions 1-3 are cytoplasmic locations, while 4-5 overlap with the nucleus. There was a strong detectable titanium signal in ROIs 1,3, and 5. The ratio of titanium to phosphorus suggests that there is an increase in titanium levels since the Zn:P ratio is consistent within all ROIs.
3. Conclusions
These results demonstrate that it is possible to fluorescently label TiO2 nanoparticles in a simple and specific manner using ARS. Most excitingly, this labeling can be used both prior to nanoparticle treatment of cells, and after nanoparticle internalization and fixation. To our knowledge, this is the first report of fluorescently labeled TiO2 uptake quantification in a large cell population (with assays using at least 104 cells per sample). This approach will allow for extensive study into the exact mechanisms by which these nanoparticles enter living cells, and the effects of potential future surface modifications. A similarly simple Alizarin Red S labeling should also be feasible for other semiconducting metal-oxide nanoparticles (e.g. FeO3, ZrO2)[18] Application of Alizarin Red S as a fluorescent label to other types of nanoparticles (e.g. carbon based nanoparticles) would require more extensive conjugation chemistry. Localization of nanoparticles in tissues of treated animals should become optically visible using the ARS staining. In addition, we also showed that transfected TiO2-DNA nanoconjugates remain stable in malignant cells for at least 12 hours. The high sensitivity of XFM and the full sample penetration of the X-rays allowed detection of nanoparticles not visualized by microscopy. The combination of both techniques, however, did allow for validation of the ARS modification of the nanoparticles within cells, and it determined that as few as 7.9 ×10⁴ ARS modified nanoparticles or as few as 3.1 × 10⁴ nanoparticles modified by 6.2 × 10⁴ TAMRA labeled oligonucleotides were detectable by fluorescent microscopy.
4. Experimental
Nanoconjugate Preparation
All reagents were purchased from Sigma Aldrich unless otherwise specified. TiO2 nanoparticles with mean diameter of around 5-6 nm were synthesized at Northwestern University’s Nanofabrication Core of NU-Center for Cancer Nanotechnology Excellence, applying low-temperature alkaline hydrolysis route, dialyzed, and stored in Na2HPO4 buffer (10 mM) at 4°C. Surface coating with glycidyl isopropyl ether was performed as described previously.[9] Conjugation of single stranded 5’ carboxyl deoxythymidine modified DNA oligonucleotides (ttccttggatgtggt) (The Midland Certified Reagent Co.) to dopamine, and subsequent conjugation to TiO2 nanoparticles was performed as described previously.[9, 10, 20] The oligonucleotides were also purchased with either tetramethylrhodamine (TAMRA) or Cy5 3’ end modification.
Alizarin Red S Surface Coating and UV-VIS Absorbance Spectrum Analysis
For determination of covalent surface modification, TiO2 nanoparticles (5 μM) were dialyzed and stored in Na2HPO4 buffer (10 mM) and mixed with Alizarin Red S (0.9 mM). The samples were then analyzed by the Nanodrop ND-1000 Spectrophotometer (NanoDrop Technologies Inc.,) for absorbances ranging from 200-750 nm.
Cell Culture and Treatment with Nanoparticles/Nanoconjugates
All cell culture reagents were purchased from Mediatech Inc. unless otherwise specified. PC-3M metastatic prostate cancer cells were a gift from Dr. Raymond Bergan, Northwestern University. MCF-7/WS8 cells were obtained from American Type Culture Collection (ATCC). Both cell lines were maintained at 37°C with 5% CO2 in RPMI 1640 media supplemented with fetal bovine serum (10%), L-glutamine (2 mM), HEPES (10 mM), penicillin (100 I.U./ml), streptomycin (100 μg/ml). MCF-7 cells were further supplemented with non-essential amino acids (1X), amphoterecin B (0.25 μg/ml), and insulin (0.1 mg/ml) (Sigma-Aldrich). PC-3M cells were further supplemented with G418 sulfate (0.15 mg/ml). For treatment, cells were washed with phosphate buffered saline solution (PBS) and placed in serum free RPMI 1640 for 1-2 hours. Then cells were treated with TiO2 nanoparticles (333 nM) coated with or without ARS (60 μM), and/or ODN (160 μM) for one hour. After treatment, cells were washed with PBS, and then in glycine (200 mM, pH 4) (Sigma Aldrich). After more washing in PBS, the cells were further prepared as described below, depending on the technique performed. Transfection of cells was carried out using Superfect (Qiagen) according to manufacturer’s suggestions.
Flow Cytometry and Cell Sorting
Cells to be analyzed by flow cytometry were grown until approximately 60% confluence. After treatment and washing, cells were trypsinized, collected in FBS supplemented medium, and brought to a single cell suspension. To determine cell viability, cell samples were treated with DAPI (5 μg/ml) (Molecular Probes, Invitrogen) prior to analysis. Samples were then taken to the Northwestern University Flow Cytometry Core Facility of the Robert H. Lurie Cancer Center to be analyzed or sorted on the DakoCytomation MoFlo Flow Cytometer (Dako). Excitation lasers of 350 nm and 543 nm were used to excite DAPI and TAMRA/ARS, respectively. Debris was excluded based on the forward and side scatter characteristics of the cell populations. Analysis of flow cytometry data was performed using the FCS Express V3 program (De Novo Software).
Confocal Microscopy
For visualization by confocal microscopy, cells were cultured on glass coverslips. Cells at approximately 60% confluence were treated and washed as described above. The cells were then fixed in paraformaldehyde (4%), and stained with Hoechst 33343 (Molecular Probes, Invitrogen). After washing the cells were placed in anti-fade mounting medium (Molecular Probes, Invitrogen) and visualized using the LSM 510 UV Meta Microscope (Carl Zeiss, Inc.) at the Northwestern University Cell Imaging Facilities using 405 nm, 488 nm, and 543 nm lasers with bandpass filters of 420-480 nm, 505-530 nm, 560-615 nm, respectively.
X-Ray Fluorescence Microscopy (XFM)
Cells transfected with TiO2-DNA (TAMRA) nanoconjugates were sorted for the presence of TAMRA, seeded on formvar coated gold EM grids (Electron Microscopy Sciences) and allowed to adhere. The samples were then fixed in cold methanol (-20°C), and stained with Hoechst 33342 dye. The samples were placed in anti-fade mounting medium between a glass coverslip and slide, and imaged by confocal microscopy. Next, the cells were washed in glycine and PBS, dehydrated in ethanol (100%), and allowed to air dry. Before XFM analysis, the presence of the cells was verified, and coordinates for their locations were obtained by the Leica DMXRE light microscope and a motorized x/y stage (Ludl Electronic Products). XFM was performed at the 2-ID-D beamline at the Advanced Photon Source at Argonne National Laboratories where an undulator source was used to create hard X-Rays with energies of 10 keV and focused using Fresnel zone plate optics. Emitted X-Ray fluorescence was detected using an energy dispersive germanium detector (LEGe Detector, Canberra). Elemental quantification and localizations were calculated using the MAPS program.[50]
Supplementary Material
Multi-planar Comparison of Confocal Microscopy and XFM. ARS labeled TiO2-DNA nanoconjugates were transfected in PC3-M cells. Confocal Microscopy reveals in one plane the presence of ARS labeled nanoconjugates within the nucleus (1 top row) and another plane reveals localization in the cytoplasm (2 middle row). XFM (bottom) reveals two strong intracellular titanium signals (1,2), as well as several other smaller aggregates. Comparison suggests that these overlap with the distributions visualized by XFM. The high phosphorus signal is due to the presence of the EM grid to which the cell had adhered.
Acknowledgments
The authors would like to thank James Marvin, Jeffrey Nelson, and Paul Mehl of the Northwestern University Flow Cytometry Core Facility of the Robert H. Lurie Cancer Center. Northwestern University’s Center for Cancer Nanotechnology Excellence (CCNE) Nanofabrication Core facility is thanked for preparation of nanoparticles. Use of the Advanced Photon Source was supported by the U.S. Department of Energy, Basic Energy Sciences, Office of Science, under Contract number DE-AC02-06CH11357. Work was supported by NIH Grants: CA107467, EB002100, P50 CA89018, U54CA119341.
References
- 1.Blake DM, Maness PC, Huang Z, Wolfrum EJ, Huang J, Jacoby WA. Separation and Purification Methods. 1999;28(1):1–50. [Google Scholar]
- 2.Gogniat G, Thyssen M, Denis M, Pulgarin C, Dukan S. FEMS Microbiol Lett. 2006;258(1):18–24. doi: 10.1111/j.1574-6968.2006.00190.x. [DOI] [PubMed] [Google Scholar]
- 3.Tsuang YH, Sun JS, Huang YC, Lu CH, Chang WH, Wang CC. Artif Organs. 2008;32(2):167–174. doi: 10.1111/j.1525-1594.2007.00530.x. [DOI] [PubMed] [Google Scholar]
- 4.Wu HP, Cheng TL, Tseng WL. Langmuir. 2007;23(14):7880–7885. doi: 10.1021/la700555y. [DOI] [PubMed] [Google Scholar]
- 5.Ashcroft JM, Gu W, Zhang T, Hughes SM, Hartman KB, Hofmann C, Kanaras AG, Kilcoyne DA, Le Gros M, Yin Y, Alivisatos AP, Larabell CA. Chem Commun (Camb) 2008;21:2471–2473. doi: 10.1039/b801392f. [DOI] [PMC free article] [PubMed] [Google Scholar]
- 6.Zhang AP, Sun YP. World J Gastroenterol. 2004;10(21):3191–3193. doi: 10.3748/wjg.v10.i21.3191. [DOI] [PMC free article] [PubMed] [Google Scholar]
- 7.Cai R, Kubota Y, Shuin T, Sakai H, Hashimoto K, Fujishima A. Cancer Res. 1992;52(8):2346–2348. [PubMed] [Google Scholar]
- 8.Seo JW, Chung H, Kim MY, Lee J, Choi IH, Cheon J. Small. 2007;3(5):850–853. doi: 10.1002/smll.200600488. [DOI] [PubMed] [Google Scholar]
- 9.Paunesku T, Rajh T, Wiederrecht G, Maser J, Vogt S, Stojicevic N, Protic M, Lai B, Oryhon J, Thurnauer M, Woloschak G. Nat Mater. 2003;2(5):343–346. doi: 10.1038/nmat875. [DOI] [PubMed] [Google Scholar]
- 10.Paunesku T, Vogt S, Lai B, Maser J, Stojicevic N, Thurn KT, Osipo C, Liu H, Legnini D, Wang Z, Lee C, Woloschak GE. Nano Lett. 2007;7(3):596–601. doi: 10.1021/nl0624723. [DOI] [PMC free article] [PubMed] [Google Scholar]
- 11.Liu J, Saponijc Z, Dimitrijevic NM, Luo S, Preuss D, Rajh T. Proc of SPIE. 2006;6096:60960F60961–60960F60910. [Google Scholar]
- 12.Huang N-p, Min-hua X, Yuan C-w, Rui-rong Y. Journal of Photochemistry and Photobiology A: Chemistry. 1997;108(23):229. [Google Scholar]
- 13.Long TC, Tajuba J, Sama P, Saleh N, Swartz C, Parker J, Hester S, Lowry GV, Veronesi B. Environ Health Perspect. 2007;115(11):1631–1637. doi: 10.1289/ehp.10216. [DOI] [PMC free article] [PubMed] [Google Scholar]
- 14.Singh S, Shi T, Duffin R, Albrecht C, van Berlo D, Hohr D, Fubini B, Martra G, Fenoglio I, Borm PJ, Schins RP. Toxicol Appl Pharmacol. 2007;222(2):141–151. doi: 10.1016/j.taap.2007.05.001. [DOI] [PubMed] [Google Scholar]
- 15.Jeng HA, Swanson J. J Environ Sci Health A Tox Hazard Subst Environ Eng. 2006;41(12):2699–2711. doi: 10.1080/10934520600966177. [DOI] [PubMed] [Google Scholar]
- 16.Peters K, Unger RE, Kirkpatrick CJ, Gatti AM, Monari E. J Mater Sci Mater Med. 2004;15(4):321–325. doi: 10.1023/b:jmsm.0000021095.36878.1b. [DOI] [PubMed] [Google Scholar]
- 17.Fabian E, Landsiedel R, Ma-Hock L, Wiench K, Wohlleben W, van Ravenzwaay B. Arch Toxicol. 2008;82(3):151–157. doi: 10.1007/s00204-007-0253-y. [DOI] [PubMed] [Google Scholar]
- 18.Rajh T, Chen LX, Lukas K, Liu T, Thurnauer MC, Tiede DM. J Phys Chem B. 2002;106(41):10543–10552. [Google Scholar]
- 19.Rajh T, Nedeljkovic JM, Chen LX, Poluektov O, Thurnauer MC. J Phys Chem B. 1999;103(18):3515–3519. [Google Scholar]
- 20.Rajh T, Saponjic Z, Liu J, Dimitrijevic NM, Scherer NF, Vega-Arroyo M, Zapol P, Curtiss LA, Thurnauer MC. Nano Lett. 2004;4(6):1017–1023. [Google Scholar]
- 21.Liu J, de la Garza L, Zhang L, Dimitrijevic NM, Zuo X, Tiede DM, Rajh T. Chem Phys. 2007;339(13):154. [Google Scholar]
- 22.Weinstein IB, Joe AK. Nat Clin Pract Oncol. 2006;3(8):448–457. doi: 10.1038/ncponc0558. [DOI] [PubMed] [Google Scholar]
- 23.Wang YH, Liu S, Zhang G, Zhou CQ, Zhu HX, Zhou XB, Quan LP, Bai JF, Xu NZ. Breast Cancer Res. 2005;7(2):R220–228. doi: 10.1186/bcr975. [DOI] [PMC free article] [PubMed] [Google Scholar]
- 24.Felsher DW. Nat Rev Cancer. 2003;3(5):375–380. doi: 10.1038/nrc1070. [DOI] [PubMed] [Google Scholar]
- 25.Chin L, Tam A, Pomerantz J, Wong M, Holash J, Bardeesy N, Shen Q, O’Hagan R, Pantginis J, Zhou H, Horner JW, 2nd, Cordon-Cardo C, Yancopoulos GD, DePinho RA. Nature. 1999;400(6743):468–472. doi: 10.1038/22788. [DOI] [PubMed] [Google Scholar]
- 26.Endres PJ, Paunesku T, Vogt S, Meade TJ, Woloschak GE. J Am Chem Soc. 2007;129(51):15760–15761. doi: 10.1021/ja0772389. [DOI] [PubMed] [Google Scholar]
- 27.Paunesku T, Ke T, Dharmakumar R, Mascheri N, Wu A, Lai B, Vogt S, Maser J, Thurn K, Szolc-Kowalska B, Larson A, Bergan RC, Omary R, Li D, Lu Z-R, Woloschak GE. Nanomedicine: Nanotechnology, Biology and Medicine. 2008 doi: 10.1016/j.nano.2008.04.004. In Press, Corrected Proof. [DOI] [PMC free article] [PubMed] [Google Scholar]
- 28.Rothen-Rutishauser BM, Schurch S, Haenni B, Kapp N, Gehr P. Environ Sci Technol. 2006;40(14):4353–4359. doi: 10.1021/es0522635. [DOI] [PubMed] [Google Scholar]
- 29.Geiser M, Casaulta M, Kupferschmid B, Schulz H, Semmler-Behnke M, Kreyling W. Am J Respir Cell Mol Biol. 2008;38(3):371–376. doi: 10.1165/rcmb.2007-0138OC. [DOI] [PubMed] [Google Scholar]
- 30.Suzuki H, Toyooka T, Ibuki Y. Environ Sci Technol. 2007;41(8):3018–3024. doi: 10.1021/es0625632. [DOI] [PubMed] [Google Scholar]
- 31.Haynes JL. Cytometry Suppl. 1988;3:7–17. doi: 10.1002/cyto.990090804. [DOI] [PubMed] [Google Scholar]
- 32.Fahrni CJ. Curr Opin Chem Biol. 2007;11(2):121–127. doi: 10.1016/j.cbpa.2007.02.039. [DOI] [PubMed] [Google Scholar]
- 33.Paunesku T, Vogt S, Maser J, Lai B, Woloschak G. J Cell Biochem. 2006;99(6):1489–1502. doi: 10.1002/jcb.21047. [DOI] [PubMed] [Google Scholar]
- 34.McRae R, Lai B, Vogt S, Fahrni CJ. J Struct Biol. 2006;155(1):22–29. doi: 10.1016/j.jsb.2005.09.013. [DOI] [PubMed] [Google Scholar]
- 35.Yang L, McRae R, Henary MM, Patel R, Lai B, Vogt S, Fahrni CJ. Proc Natl Acad Sci U S A. 2005;102(32):11179–11184. doi: 10.1073/pnas.0406547102. [DOI] [PMC free article] [PubMed] [Google Scholar]
- 36.Rajh T, Poluektov O, Dubinski AA, Wiederrecht G, Thurnauer MC, Trifunac AD. Chem Phys Lett. 2001;344(12):31. [Google Scholar]
- 37.Papalexiou V, Novaes AB, Jr, Grisi MF, Souza SS, Taba M, Jr, Kajiwara JK. Clin Oral Implants Res. 2004;15(1):44–53. doi: 10.1111/j.1600-0501.2004.00995.x. [DOI] [PubMed] [Google Scholar]
- 38.Puchtler H, Meloan SN, Terry MS. J Histochem Cytochem. 1969;17(2):110–124. doi: 10.1177/17.2.110. [DOI] [PubMed] [Google Scholar]
- 39.Zhong H, Li N, Zhao F, Li Ka. Talanta. 2004;62(1):37. doi: 10.1016/S0039-9140(03)00406-5. [DOI] [PubMed] [Google Scholar]
- 40.Huber R, Sporlein S, Moser JE, Gratzel M, Wachtveitl J. J Phys Chem B. 2000;104(38):8995–9003. [Google Scholar]
- 41.Morassutti C, Scaggiante B, Dapas B, Xodo L, Tell G, Quadrifoglio F. Biochimie. 1999;81(12):1115. doi: 10.1016/s0300-9084(99)00350-8. [DOI] [PubMed] [Google Scholar]
- 42.Whittemore ER, Loo DT, Watt JA, Cotmans CW. Neuroscience. 1995;67(4):921. doi: 10.1016/0306-4522(95)00108-u. [DOI] [PubMed] [Google Scholar]
- 43.Laktionov PP, Dazard JE, Vives E, Rykova EY, Piette J, Vlassov VV, Lebleu B. Nucleic Acids Res. 1999;27(11):2315–2324. doi: 10.1093/nar/27.11.2315. [DOI] [PMC free article] [PubMed] [Google Scholar]
- 44.Nestle FO, Mitra RS, Bennett CF, Chan H, Nickoloff BJ. J Invest Dermatol. 1994;103(4):569–575. doi: 10.1111/1523-1747.ep12396876. [DOI] [PubMed] [Google Scholar]
- 45.Noonberg SB, Garovoy MR, Hunt CA. J Invest Dermatol. 1993;101(5):727–731. doi: 10.1111/1523-1747.ep12371683. [DOI] [PubMed] [Google Scholar]
- 46.de Diesbach P, N’Kuli F, Berens C, Sonveaux E, Monsigny M, Roche AC, Courtoy PJ. Nucleic Acids Res. 2002;30(7):1512–1521. doi: 10.1093/nar/30.7.1512. [DOI] [PMC free article] [PubMed] [Google Scholar]
- 47.Garcia-Chaumont C, Seksek O, Grzybowska J, Borowski E, Bolard J. Pharmacol Ther. 2000;87(23):255–277. doi: 10.1016/s0163-7258(00)00062-0. [DOI] [PubMed] [Google Scholar]
- 48.Lysik MA, Wu-Pong S. J Pharm Sci. 2003;92(8):1559–1573. doi: 10.1002/jps.10399. [DOI] [PMC free article] [PubMed] [Google Scholar]
- 49.Khalil IA, Kogure K, Akita H, Harashima H. Pharmacol Rev. 2006;58(1):32–45. doi: 10.1124/pr.58.1.8. [DOI] [PubMed] [Google Scholar]
- 50.Vogt S. J Phys IV. 2003;104:635–638. [Google Scholar]
Associated Data
This section collects any data citations, data availability statements, or supplementary materials included in this article.
Supplementary Materials
Multi-planar Comparison of Confocal Microscopy and XFM. ARS labeled TiO2-DNA nanoconjugates were transfected in PC3-M cells. Confocal Microscopy reveals in one plane the presence of ARS labeled nanoconjugates within the nucleus (1 top row) and another plane reveals localization in the cytoplasm (2 middle row). XFM (bottom) reveals two strong intracellular titanium signals (1,2), as well as several other smaller aggregates. Comparison suggests that these overlap with the distributions visualized by XFM. The high phosphorus signal is due to the presence of the EM grid to which the cell had adhered.