Abstract
Methylation and acetylation of lysines are crucial posttranslational modifications that regulate gene transcription and have been shown to be misregulated in many forms of cancers. Western blot, immunoprecipitation, and immunofluorescence are commonly used to characterize histone acetylation and methylation. However, these approaches are limited by the availability, site specificity, and cross-reactivity of antibodies. Mass spectrometry is emerging as an additional powerful tool for histone characterization. The isobaric nature of trimethylation and acetylation (TriMe = 42.0470 Da, Ac = 42.0106 Da) confounds histone characterization by means other than high-resolution / high-mass accuracy mass spectrometry. In this paper we adapted methodology that exploits difference in the relative retention time of acetylated and methylated peptides to unequivocally distinguish these two modifications even with low-mass accuracy mass spectrometers. The approach was tested on tryptic digest of S. cerevisiae histones. We found that acetylation resulted in increased retention in reversed-phase chromatography, while methylation, including trimethylation, showed little change in retention. For example, the acetylated forms of peptide 27KSAPSTGGVKKPHR40 eluted at 15.63 min whereas the methylated forms eluted at 13.89 min. In addition, the effect of acetylation was cumulative as observed in the case of peptide 9KSTGGKAPR17 , whose un-, mono-, and diacetylated isoforms eluted at 7.43, 10.47, and 16.49 min, respectively. The modification patterns of the peptides in question were subsequently verified by high-mass accuracy tandem mass spectrometry.
Keywords: retention, high-mass accuracy, acetylation, methylation, trimethylation
INTRODUCTION
Methylation and acetylation of lysines in histones are two crucial posttranslational modifications that regulate gene transcription [1] and have been shown to be misregulated in many forms of cancers [2; 3]. In histone H3, K4, K9, K27, K36, and K79 can be methylated and is related to diverse transcription states [4]. Acetylation on histone H3 K9, K14, K18, K23, and K27 is generally associated with gene activation [5; 6]. It is noteworthy that histone H3 K9 methylation (H3K9Me) participates in heterochromatin formation and gene silencing, whereas acetylation of histone H3 K9 (H3K9Ac) has been reported to be associated with gene activation [7]. The identification and quantitation of acetylation and methylation is therefore of high significance for understanding the role of histone modifications in gene regulation. The differentiation between trimethylation (ΔM = 42.0470 Da) and acetylation (ΔM = 42.0106 Da) is challenging since they are isobaric modifications that differ by 0.0364 Da, which requires a mass resolving power of 27,472 for a 1,000 Da peptide.
Traditional immunoassay methods, such as western blot and immunoprecipitation, are widely used to characterize histone modifications due to their high sensitivity. However, site specificity of antibodies is affected by adjacent modifications leading to poor specificity for epitopes with concomitant modifications [8; 9; 10]. In addition, these approaches are also limited by the availability of site specific antibodies for known modifications and not readily applicable for discovery and rapid characterization of novel modifications.
In recent years, mass spectrometry (MS) has been demonstrated to be very successful in the study of histone posttranslational modifications [11; 12; 13; 14; 15; 16; 17]. The high-mass resolving power and high-mass accuracy of FT-ICR mass spectrometers allow for distinction between acetylation and trimethylation by peptide mass fingerprinting [18]. Tandem mass spectrometry is also a powerful tool for distinguishing these two modifications. By collision induced dissociation acetylated peptides usually generate an ammonium ion at 126+ Da while trimethylated peptides generate a neutral loss of trimethyl amine (N(CH3)3) [19], therefore, acetylation and trimethylation can be distinguished by the presence of these diagnostic peaks. However, these peaks are not always observed, especially for low abundant species. Another approach to distinguish trimethylation and acetylation is to introduce heavy isotopes to the acetyl or methyl groups so that trimethylation and acetylation will no longer be isobaric and then can be distinguished easily by mass alone [20; 21; 22]. However, the labeling method is time consuming.
Liquid chromatography mass spectrometry (LC-MS) and LC tandem mass spectrometry (LC-MS/MS) are also important tools in the identification of lysine acetylation. For example, the unambiguous identification of lysine acetylation of in NAD-dependent histone deacetylase Sir2 was performed by use of LC-MS and LC-MS/MS [23; 24]. Furthermore, relative retention in reversed-phase liquid chromatography (RPLC) has long been used as a supplement to MS for peptide identification [25; 26; 27; 28; 29]. A number of models have been proposed to calculate peptide hydrophobicities [30; 31; 32; 33; 34; 35; 36]. Posttranslational modification in turn can also significantly alter peptide hydrophobicity. For example, phosphorylation was believed to increase peptide hydrophobicity due to the addition of anionic/acidic phosphate groups, resulting in reduced retention. However, recent work by Steen and coworkers showed that this effect was not always born out. In some cases the increase of hydrophobicity was compensated for by charge neutralization when the peptide contains basic amino acids that are positively charged under standard LC-MS conditions [37]. In their study, the phosphorylated peptides eluted about the same time or later than the unmodified due to the presence of basic residues. Only peptides with a larger number of the phospho moieties than that of basic residues showed shorter elution times than their unmodified forms. Their work demonstrated that modifications that result in reduction of the net charge would reduce the overall hydrophobicity and increase the retention time on RPLC. For modifications with no introduction of charges such as mono-, di-, and trimethylation, we would expect no significant change of retention time. However, modifications that alter the number of basic sites would see a change in relative retentions.
N-terminal acetylation of the alpha-amino group results in a substantial change in hydrophobicity and retention. Guo and Mant reported that N-terminal acetylated peptides eluted 1.5 ~ 3.5 min later than the isoforms of the same peptides with free N-terminus [32; 38]. Likewise, acetylation of lysine side-chains can neutralize the positive charge and lead to an increase in peptide hydrophobicity [39; 40]. Thus acetylated peptides in general would be expected to elute later in reversed-phase chromatography than their unmodified isoforms. For example, Hunt showed that the peptides 9KSTGGKAcAPR17 and 9KMe3STGGKAPR17 were separated by 17 min [15]. Hunt and coworkers have also reported the increase of histone peptide hydrophobicity by incubating histones with propionic anhydride before in-solution trypsin digestions. The formation of a propionyl amide effectively neutralizes the charges of unmodified or endogenously monomethylated lysine [41]. Propionic anhydride derivatization has also been applied to in-gel trypsin digestion of histones [42]. Acetic anhydride is another derivatization reagent of lysine, which will add one acetyl group to unmodified lysine residues resulting in an increased hydrophobicity of histone peptides [43].
Herein we report the general observation that acetylation of ε-amino groups of lysine results in shifted retention time whereas methylation does not. The combination of relative retention shifts with tandem mass spectrometry allows for the unequivocal determination of trimethylation vs. acetylation.
EXPERIMENTAL
YEAST HISTONE EXTRACTION AND H3 IN-GEL DIGESTION
S. cerevisiae strain BY4743 was obtained from Open Biosystems. Cell growth and histone purification were performed as previously described [44; 45]. Histone H3 of S. cerevisiae was separated from other histones by use of SDS-PAGE with pre-cast 16.5% Tris-Tricine gels (BioRad Laboratories, Hercules, CA). H3 gel bands were in-gel digested with trypsin as previously described [29]. In brief, the H3 gel bands were excised into small pieces and washed twice (one hour each) with freshly made 50% methanol/5% acetic acid solution. The gel pieces were then dehydrated in 200 µl of acetonitrile for 5 min followed by a 5-min rehydration in 200 µl of 100 mM NH4CO3. This dehydration-rehydration procedure was repeated once, followed by another 5-min rehydration in acetonitrile. 30 µl of freshly prepared trypsin (20 ng/µl in 25 mM NH4CO3) were added and rehydrated on ice for 10 min, then digested at 37 °C for one hour. Tryptic digested peptides were extracted with 50% acetonitrile/5% formic acid three times and dried to about 10 µl in a vacuum concentrator.
NANO-LC-MS/MS
The digested peptides were subject to nano-LC-MS/MS analysis by use of either an LTQ FT-ICR mass spectrometer (Thermo Fisher, San Jose, CA) or an LCQ DECA XP+ ion trap mass spectrometer (Thermo Fisher) coupled with a Shimadzu LC 10ADvp capillary system (Columbia, MD, USA) [14; 46]. Peptide separations were carried out with a commercial C18 column (5 cm, 5 µm, I.D. 75 µm, New Objective, MA) using a gradient and working conditions as previously described [47]. The peptides were separated using a 120-min gradient of mobile phase A (0.1% formic acid in water) and mobile phase B (0.1% formic acid in acetonitrile). Mobile phase B was increased linearly from 5 to 60% in 80 min, held at 60% for 5 min, then increased to 95% in 5 min, held for 5 min and then returned to 5% to equilibrate the column for 15 minutes. The column was washed between each run to minimize carryover. One microliter of the digest was injected onto the column. The electrospray voltage was maintained at 1.3 kV and capillary temperature was set at 200 °C. The mass spectrometric detection range was 200–2000 (m/z). Three (LCQ) or five (LTQ-FT) data-dependent MS/MS scans with dynamic exclusion were carried out between each full MS scan. The product ion mass spectra were analyzed by use of in-house developed software, MassMatrix [48]. The search parameters included the following variable modifications: acetylation of lysine and N-terminus; methylation of lysine and arginine. Each of the tandem mass spectra matched by the database search was manually validated.
RESULTS AND DISCUSSION
POSTTRANSLATIONAL MODIFICATION PATTERNS OF YEAST HISTONE H3
Acetylation and trimethylation are isobaric posttranslational modifications that differ in mass by 0.0364 Da. High-resolution / high-mass accuracy mass spectrometers, such as FT-ICR or Orbitraps, can readily distinguish these modifications by mass alone. All initial experiments were carried out on a hybrid LTQ-FT in order to establish with high confidence the pattern of histone modifications for yeast histone H3. The full MS spectra were collected via the FT-ICR MS and product ion mass spectra were obtained in the LTQ. The high-mass accuracy precursor ion spectra were used to establish the presence of trimethylation vs. acetylation as described previously [18]. All peptide assignments were supported by MS/MS spectra with manually validated database search matches. The peptides identified with the LTQ-FT are listed in Table 1.
Table 1.
Peptides of yeast H3 detected by LTQ-FTMS (Me: Monomethylation; Me2: Dimethylation; Me3: Trimethylation; Ac: Acetylation; RT: Retention time)
| Measured (m/z) |
Calculated (m/z) |
RT (min) |
Sequence | Error (ppm) |
|---|---|---|---|---|
| 337.71232+ | 337.71412+ | 8.16 | 18KQLASK23 | −5.33 |
| 358.71792+ | 358.71942+ | 16.15 | 18KAcQLASK23 | −4.18 |
| 358.73752+ | 18KMe3QLASK23 | −54.64 | ||
| 358.73752+ | 117VTIQKK122 | −54.64 | ||
| 352.70562+ | 352.70682+ | 6.10 | 3TKQTAR8 | −3.40 |
| 359.71312+ | 359.71462+ | 6.91 | 3TKMeQTAR8 | −4.17 |
| 366.72082+ | 366.72242+ | 7.13 | 3TKMe2QTAR8 | −4.36 |
| 373.72872+ | 373.73032+ | 6.99 | 3TKMe3QTAR8 | −4.28 |
| 373.71212+ | 3TKAcQTAR8 | 44.42 | ||
| 387.21562+ | 387.21752+ | 8.20 | 10STGGKAPR17 | −4.91 |
| 408.22132+ | 408.22282+ | 15.48 | 10STGGKAcAPR17 | −3.67 |
| 408.24102+ | 10STGGKMe3APR17 | −48.26 | ||
| 451.26352+ | 451.26502+ | 7.43 | 9KSTGGKAPR17 | −3.32 |
| 472.26872+ | 472.27032+ | 10.47 | 9KSTGGKAcAPR17 | −3.38 |
| 472.28852+ | 9KSTGGKMe3APR17 / 9KMe3STGGKAPR17 | −41.92 | ||
| 493.27352+ | 493.27562+ | 16.49 | 9KAcSTGGKAcAPR17 | −4.26 |
| 493.29382+ | 9KMe3STGGKAcAPR17 / 9KAcSTGGKMe3APR17 | −41.15 | ||
| 493.31192+ | 9KMe3STGGKMe3APR17 | −77.84 | ||
| 528.81052+ | 528.81232+ | 20.80 | 18KAcQLASKAcAAR26 | −3.40 |
| 528.83052+ | 18KAcQLASKMe3AAR26 / 18KMe3QLASKAcAAR26 | −37.82 | ||
| 528.84872+ | 18KMe3QLASKMe3AAR26 | −72.23 | ||
| 366.71614+ | 366.71724+ | 13.89 | 27KSAPSTGGVKMeKPHR40 | −3.00 |
| 370.21994+ | 370.22114+ | 13.89 | 27KSAPSTGGVKMe2KPHR40 | −3.24 |
| 373.72374+ | 373.72504+ | 13.89 | 27KSAPSTGGVKMe3KPHR40 | −3.48 |
| 373.71594+ | 27KSAPSTGGVKAcKPHR40 | 20.87 | ||
| 373.71414+ | 373.71594+ | 15.63 | 27KAcSAPSTGGVKKPHR40 | −4.82 |
| 373.72504+ | 27KMe3SAPSTGGVKKPHR40 | −29.17 | ||
| 377.21794+ | 377.21984+ | 15.63 | 27KAcSAPSTGGVKMeKPHR40 | −5.04 |
| 380.72184+ | 380.72374+ | 15.63 | 27KAcSAPSTGGVKMe2KPHR40 | −4.99 |
| 384.22564+ | 384.22764+ | 15.63 | 27KAcSAPSTGGVKMe3KPHR40 | −5.21 |
| 384.19364+ | 27KAcSAPSTGGVKAcKPHR40 | 83.29 | ||
| 497.94933+ | 497.95193+ | 15.63 | 27KAcSAPSTGGVKKPHR40 | −5.22 |
| 497.9859 3+ | 27KMe3SAPSTGGVKKPHR40 | −73.50 | ||
| 502.62133+ | 502.62373+ | 15.63 | 27KAcSAPSTGGVKMeKPHR40 | −4.77 |
| 507.29333+ | 507.2956 3+ | 15.73 | 27KAcSAPSTGGVKMe2KPHR40 | −4.53 |
| 511.96513+ | 511.96753+ | 15.63 | 27KAcSAPSTGGVKMe3KPHR40 | −4.69 |
| 695.90892+ | 695.91262+ | 27.47 | 53RFQKSTELLIR63 | −5.32 |
| 716.91482+ | 716.91782+ | 29.35 | 53RFQKAcSTELLIR63 | −4.18 |
| 716.93602+ | 53RFQKMe3STELLIR63 | −29.57 | ||
| 638.86592+ | 638.86712+ | 32.58 | 54FQKAcSTELLIR63 | −1.88 |
| 638.90112+ | 54FQKMe3STELLIR63 | −55.09 | ||
| 568.65103+ | 568.65333+ | 29.92 | 70LVREIAQDFKTDLR83 | −4.04 |
| 573.32313+ | 573.32513+ | 30.02 | 70LVREIAQDFKMeTDLR83 | −3.49 |
| 577.99463+ | 577.99703+ | 30.07 | 70LVREIAQDFKMe2TDLR83 | −4.15 |
| 582.66663+ | 582.66893+ | 29.92 | 70LVREIAQDFKMe3TDLR83 | −3.95 |
| 582.63493+ | 70LVREIAQDFKAcTDLR83 | 54.41 | ||
| 668.34862+ | 668.34952+ | 26.85 | 73EIAQDFKTDLR83 | −1.35 |
| 668.37892+ | 28SAPSTGGVKMeKPHR40 | −45.33 | ||
| 675.35602+ | 675.35732+ | 27.25 | 73EIAQDFKMeTDLR83 | −1.92 |
| 675.38672+ | 28SAPSTGGVKMe2KPHR40 | −45.45 | ||
| 682.36292+ | 682.36512+ | 27.35 | 73EIAQDFKMe2TDLR83 | −3.22 |
| 682.37632+ | 28SAPSTGGVKAcKPHR40 | −19.64 | ||
| 689.37112+ | 682.39452+ | 26.92 | 28SAPSTGGVKMe3KPHR40 | −46.31 |
| 689.37292+ | 73EIAQDFKMe3TDLR83 | −2.61 | ||
| 689.35472+ | 73EIAQDFKAcTDLR83 | 23.79 | ||
| 689.38422+ | 28SAPSTGGVKAcKMePHR40 | −19.00 | ||
| 689.40242+ | 28SAPSTGGVKMe3KMePHR40 | −45.40 | ||
| 335.53393+ | 335.53513+ | 20.96 | 41YKPGTVALR49 | −3.58 |
| 534.32113+ | 534.32333+ | 31.44 | 57STELLIRKLPFQR69 | −4.12 |
Note: False assignments are italicized.
High-mass accuracy is a proven approach to discriminate between isobaric peptides. For example, a precursor ion was observed at m/z = 358.7179. Based on nominal mass the peptide could be either the acetylated or trimethylated peptides 18KQLASK23 or 117VTIQKK122. Based on accurate mass the trimethylated 18KQLASK23 or 117VTIQKK122 would have mass errors as high as 50 ppm. Such mass errors are highly improbable given a properly calibrated FT-ICR mass spectrometer. The more likely assignment is the acetylated peptide 18KQLASK23 with a mass error of −4.04 ppm. The assignment of the backbone peptide sequence was corroborated by MS/MS. In this manner we confirmed K4, K36, and K79 were (tri)methylated and K9, K14, K18, K23, K27, and K56 were acetylated on yeast histone H3. As indicated in Table 1, each modification had a resulting error less than 6 ppm. These observed modification patterns determined by mass spectrometry are consistent with those obtained from other techniques [6; 49; 50; 51; 52; 53].
In addition to the absolute mass, peptide mass shifts between different isoforms can also be used to corroborate modification identifications [54]. As shown in Figure 1, mass shifts of 42.0104 and 42.0096 Da between isoforms of peptide 9KSTGGKAPR17 suggested K9 and K14 in the peptide were both acetylated rather than trimethylated. The tandem MS spectra shown in Figure 2 establish the predominant acetylation first occurring at K14 followed by K9. In the case of peptide 73EIAQDFKTDLR83 , a mass shift of 42.0450 Da (shown in Figure 3) between the isoforms suggested that the peptide was trimethylated. More importantly, the presence of isoforms at m/z = 675.3560, 682.3629, and 689.3711 correspond in mass to the mono-, di-, and trimethylated species. The tandem MS spectra shown in Figure 4 indicate K79 as the site of mono-, di-, and trimethylation. In the figure for trimethylation of K79, tandem mass spectra of the triply charged precursor ion at m/z = 460.2520 is shown instead of the doubly charged precursor ion at m/z = 689.3711 because the former showed better fragmentation.
Figure 1.
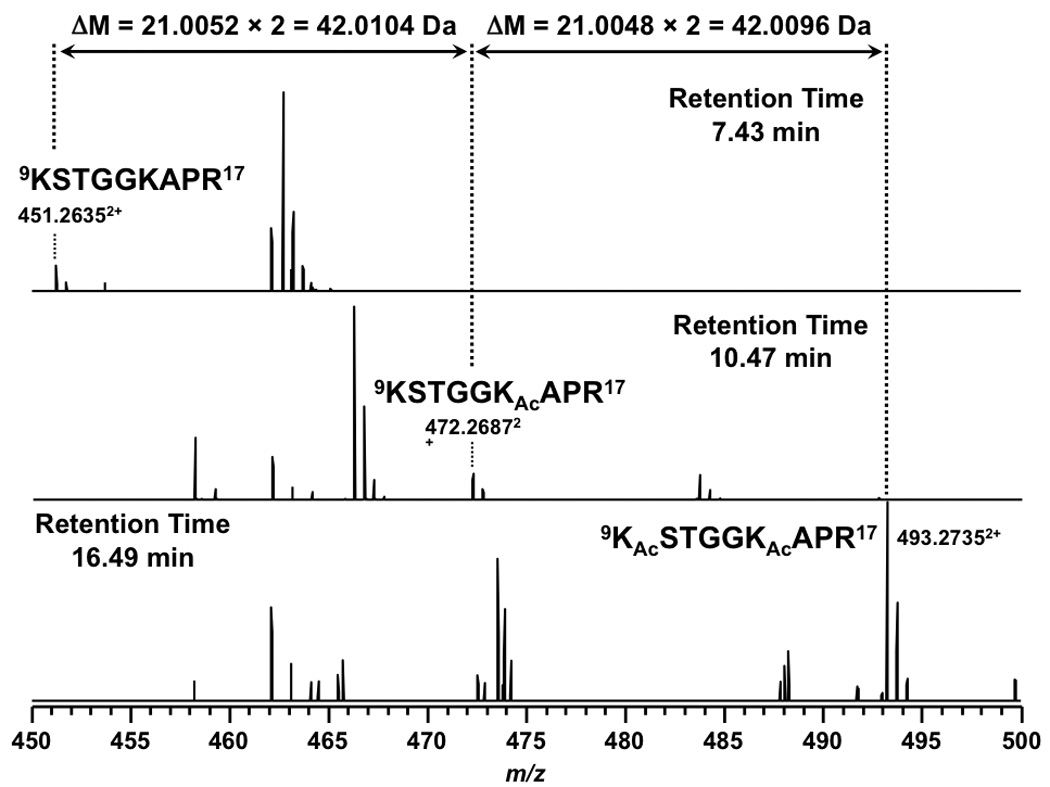
Full MS results of peptide 9KSTGGKAPR17 from an LTQ FT-ICR mass spectrometer. The unmodified and modified isoforms are doubly charged.
Figure 2.
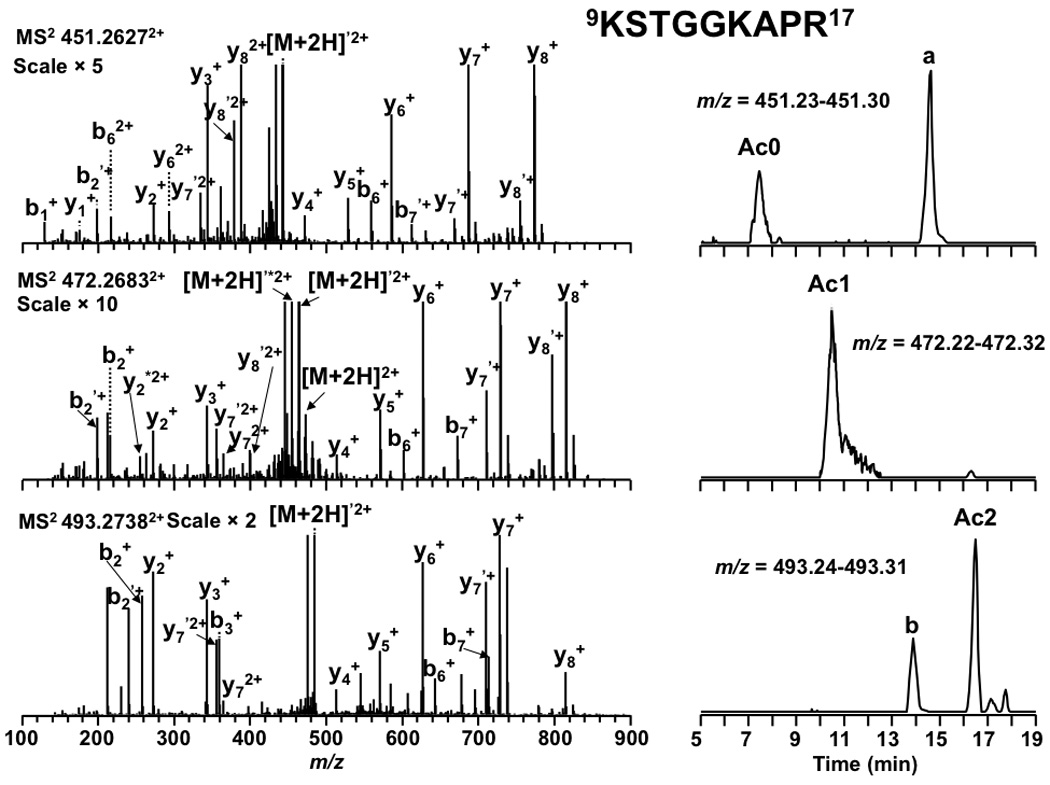
Tandem MS results and LC-extracted ion chromatograms of peptide 9KSTGGKAPR17 from an LTQ FT-ICR mass spectrometer. Product ions resulting from neutral loss of H2O or NH3 are indicate by ‘ and * respectively. The peak labeled a was from the second isotopic peak of +3 charged peak at 450.5921 m/z and b was from an unidentified +3 charged peak at m/z 493.2911. Their MS/MS spectra were obtained but not matched by the database search. Lower charge states were not observed for peaks a and b.
Figure 3.
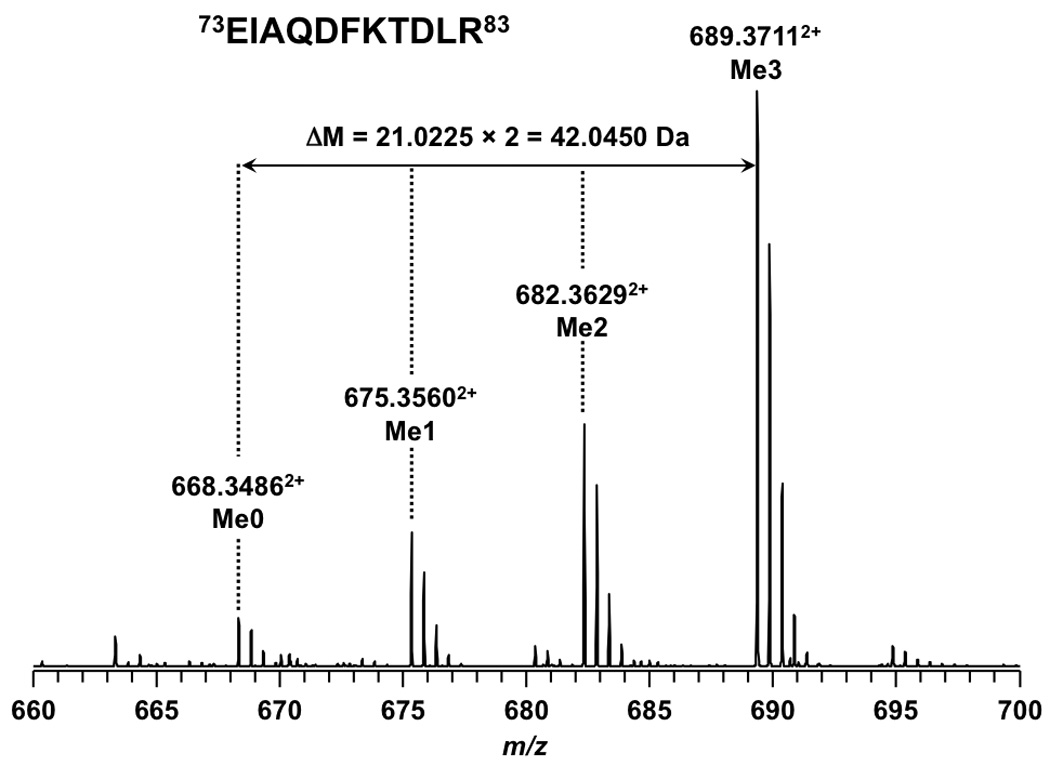
Full MS results of peptide 73EIAQDFKTDLR83 from an LTQ FT-ICR mass spectrometer. The unmodified and modified isoforms are doubly charged.
Figure 4.
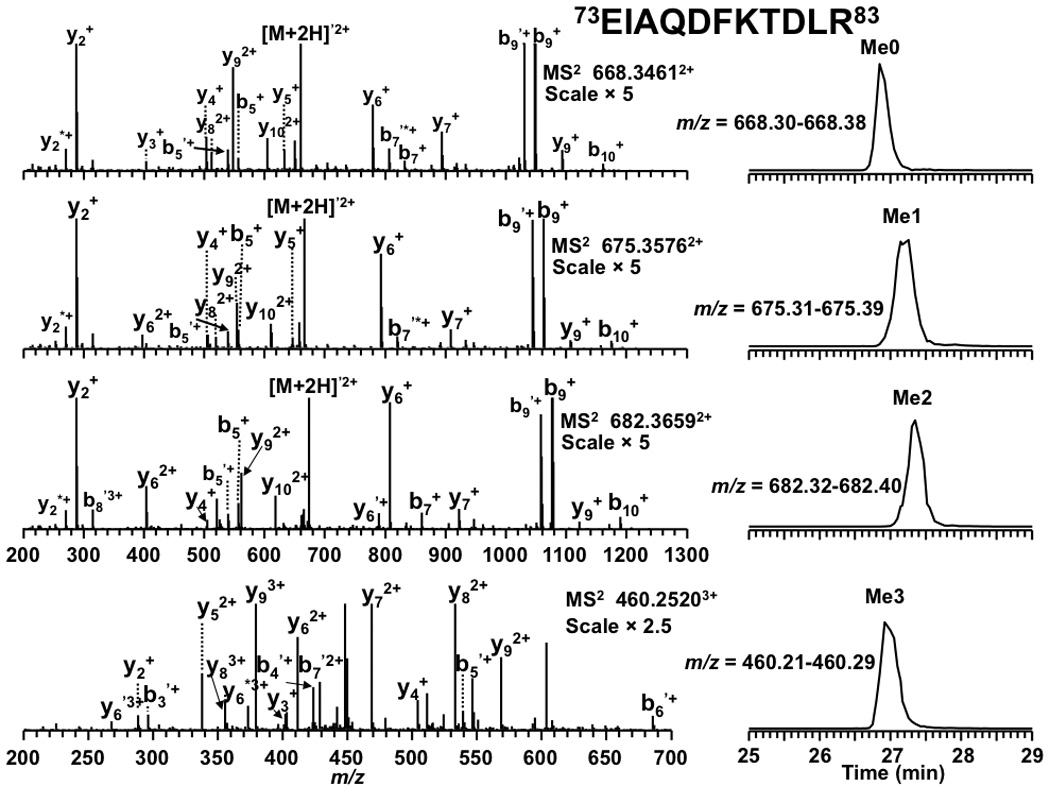
Tandem MS results and LC-extracted ion chromatograms of peptide 73EIAQDFKTDLR83 from an LTQ FT-ICR mass spectrometer. Product ions resulting from neutral loss of H2O or NH3 are indicate by ‘ and * respectively.
In summary the data from accurate mass, relative mass shifts and tandem MS spectra support the conclusion that yeast histone H3 K4, K36 and K79 were methylated while H3 K9, K14, K18, K23, K27, and K56 were acetylated. These results, as summarized in Table 2, serve as the well validated standards that will be used in our examination of relative retention time shifts between acetylation and trimethylation.
Table 2.
Posttranslational modification sites in histone H3 of S. cerevisiae
| Residue | Posttranslational Modification |
|---|---|
| K4 | Me1, Me2, Me3 |
| K9 | Ac |
| K14 | Ac |
| K18 | Ac |
| K23 | Ac |
| K27 | Ac |
| K36 | Me1, Me2, Me3 |
| K56 | Ac |
| K79 | Me1, Me2, Me3 |
RETENTION TIME SHIFTS
As demonstrated above, accurate absolute mass and accurate relative mass shifts are powerful approaches to distinguish between trimethylation and acetylation. For data obtained on low-mass accuracy instruments additional corroborative data, such as the presence of supporting MS/MS reporter ions, are required. As previously reported [44], relative retention can also be used to distinguish between sequence assignments for isobaric peptides: 73EIAQDFKTDLR83 vs. 28SAPSTGGVKMeKPHR40 , 73EIAQDFKMeTDLR83 vs. 28SAPSTGGVKMe2KPHR40, and 73EIAQDFKMe2TDLR83 vs. 28SAPSTGGVKMe3KPHR40 . This approach can also be extended to effectively distinguish between trimethylation and acetylation.
Acetylation of lysine effectively neutralizes the lysine’s positive charge under acidic reversed-phase separation conditions. The change in charge results in increased retention time relative to the unmodified peptide isoform. This effect was observed for all acetylated peptide isoforms of yeast histone H3. As shown in Figure 2, unmodified fragment 9KSTGGKAPR17 eluted at 7.4 min, whereas the K14 acetylated isoform eluted at 10.5 min and the K9 and K14 acetylated isoform eluted at 16.5 min. The effect of acetylation on retention time was also observed for peptides 18KQLASK23 , 10STGGKAPR17, and 53RFQKSTELLIR63 (listed in Table 1). From these peptides we conclude that the increase in retention is cumulative and of similar magnitude as N-terminal acetylation [32].
Unlike the addition of the acetyl group, the addition of methyl groups to lysine does not neutralize the lysine’s charge. Therefore, it was expected that methylation would not dramatically alter retention time. As shown in Figure 4, the unmodified form of peptide 73EIAQDFKTDLR83 eluted at 26.9 min whereas its mono-, di-, and trimethylated isoforms eluted at 27.2, 27.4, and 26.9 min, respectively. The similarity in retention time for the unmodified and methylated forms indicates that the addition of methyl groups to lysine has only a small effect on peptide retention time. The same effect was observed for the peptides 3TKQTAR8 and 70LVREIAQDFKTDLR83 , which are also listed in Table 1.
Based on the above observation that acetylation has a significant effect on retention time while methylation has little, we hypothesize that a peptide subject to both acetylation and trimethylation would have its acetylated isoforms eluted several minutes later than the unmodified/methylated isoforms. Given this assertion, we propose that trimethylation and acetylation are easily distinguished based on relative retention times and supporting MS/MS. This hypothesis is supported by observations for the peptide 27KSAPSTGGVKKPHR40 in which K27 and K36 are subject to concomitant acetylation and methylation, respectively. As seen in Figure 5, the methylated K36 isoforms eluted around 13.8 min whereas the isoforms in which K27 is acetylated (along with K36 methylations) eluted around 15.7 min. We should note that the unmodified form of this peptide was not observed. The top trace of Figure 5 corresponds to background noise. This assignment is further supported by the peptide assignments based on accurate mass in Table 1 and the mass spectra shown in Figure 6 and Figure 7. Thus the group of peptides eluting earlier are methylated isoforms of K36 and the later group is the same isoforms but with K27 acetylated. Figure 5 clearly shows the effect of acetylation vs. methylation of lysine on retention time. Given the supporting data of MS/MS and retention time it should be possible to unambiguously distinguish between these isobaric modifications without the need for accurate mass. To test this assertion the same analysis of acetylation and trimethylation was carried out on a common ion trap mass spectrometer.
Figure 5.
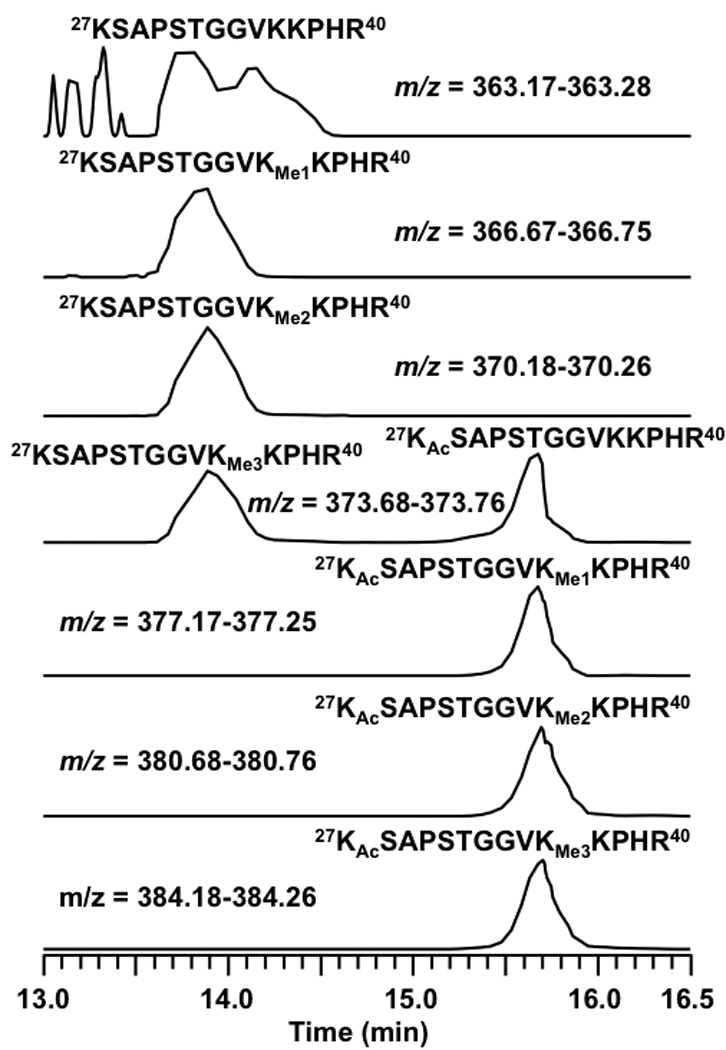
LC-extracted ion chromatograms of peptide 27KSAPSTGGVKKPHR40 from an LTQ FT-ICR mass spectrometer.
Figure 6.
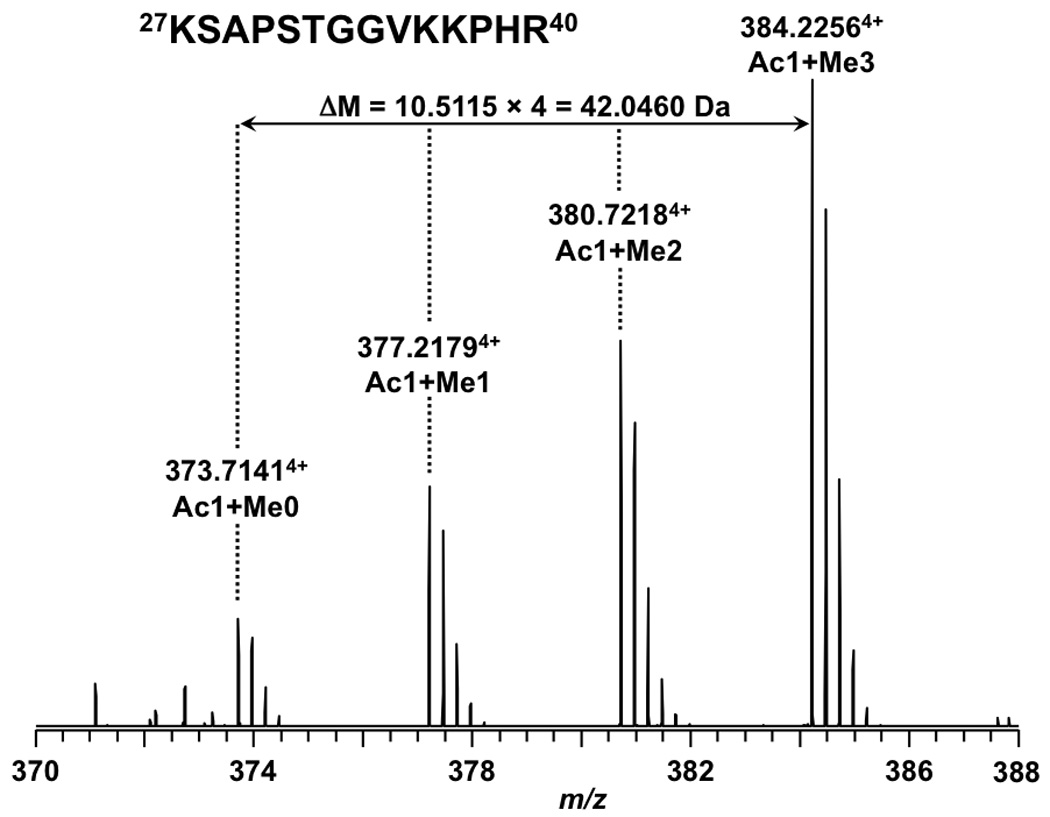
Full MS results of peptide 27KSAPSTGGVKKPHR40 from an LTQ FT-ICR mass spectrometer. All the isoforms are +4 charged.
Figure 7.
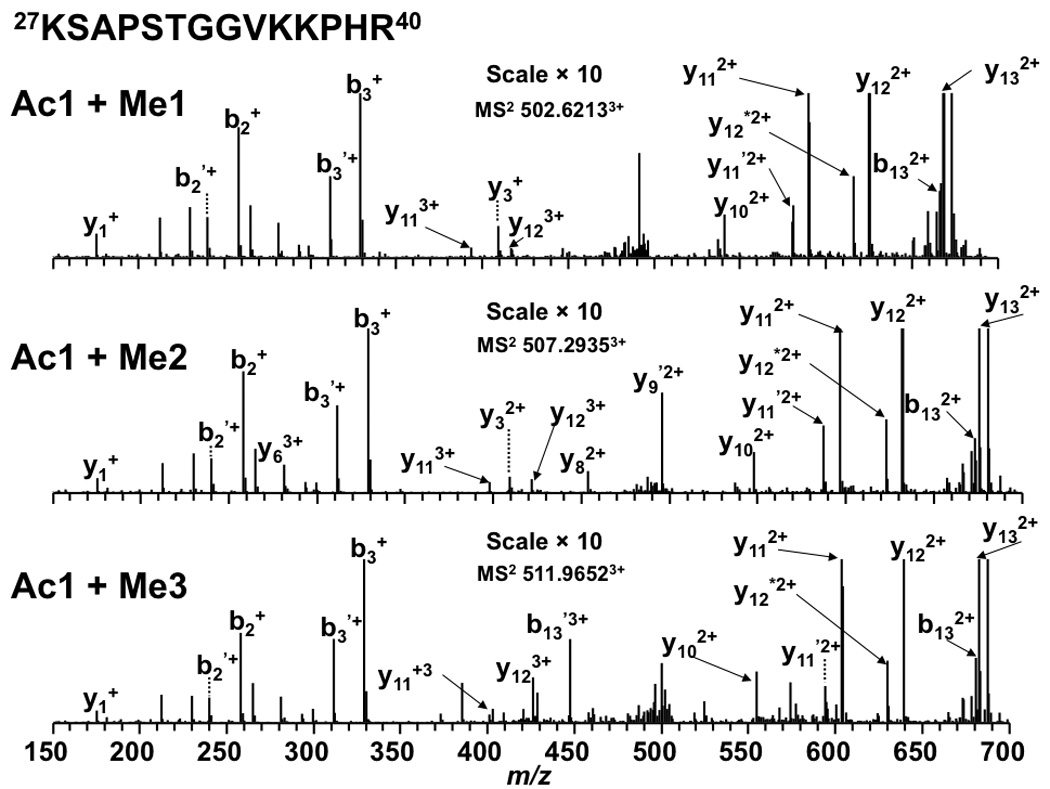
Tandem MS results of peptide 27KSAPSTGGVKKPHR40 from an LTQ FT-ICR mass spectrometer. Product ions resulting from neutral loss of H2O or NH3 are indicate by ‘ and * respectively.
UNAMBIGUOUS DETERMINATION OF ACETYLATION AND TRIMETHYLATION AT LOW- MASS ACCURACY
Results from the FT-ICR mass spectrometer demonstrated convincingly that acetylated isoforms elute later than the corresponding unmodified and methylated isoforms. This observation suggests that retention time can be used effectively to support MS/MS data for determining the presence of either acetylation or trimethylation. The nano-LC-MS/MS experiments were then performed on an LCQ DECA XP+ ion trap mass spectrometer.
To illustrate the power of the combined approach, peptide 27KSAPSTGGVK36 , in which K27 and K36 are subject to acetylation or trimethylation, was examined. With the low-mass accuracy of the ion trap mass spectrometer it was impossible to conclude whether K27/K36 was either acetylated or trimethylated. However, based on the relative retention time shift we can confidently conclude that the isoform eluting at 10.8 min was acetylated not trimethylated because it eluted 4 min later than its unmodified form, Figure 8. Using retention time, we also identified the modification patterns of K18 and K23 in peptide 18KQLASKAAR26 . As shown in Table 3, the isoform of peptide 18KQLASKAAR26 eluting at 25.5 min was believed to be the isoform with K18 acetylated not trimethylated because it eluted 5.9 min later than the other isoform. Methylated peptides showed similar retention times as expected (Table 3). Peptide 73EIAQDFKTDLR83 could be acetylated or trimethylated on K79. With the low-mass accuracy of ion traps, as with other peptides it is difficult to define the modification between acetylation and trimethylation. However, with retention time it is safe to conclude that K79 is subject to trimethylation instead of acetylation. As shown in Figure 9, the four isoforms of peptide 73EIAQDFKTDLR83 eluted within 0.5 min. The fourth isoform (the bottom panel) eluted closely with the unmodified form. This observation is consistent with that from high-mass accuracy mass spectrometer FT-ICR (Figure 4).
Figure 8.
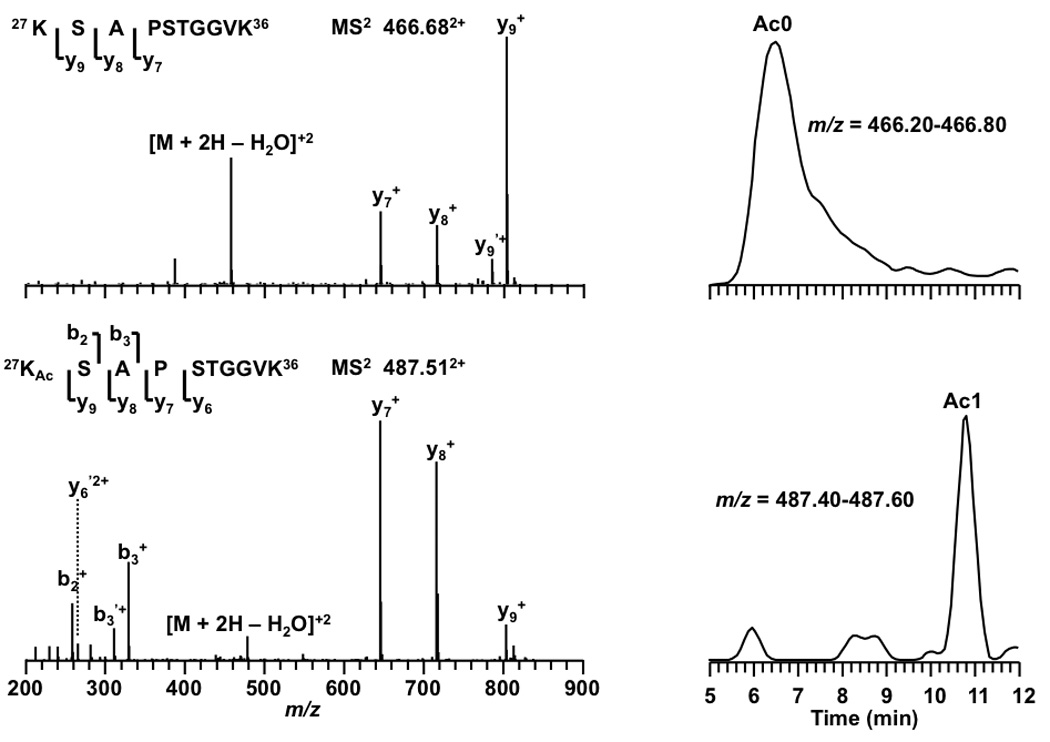
Tandem MS results and LC-extracted ion chromatograms of peptide 27KSAPSTGGVK36 from an LCQ DECA XP+ ion trap mass spectrometer. Product ions resulting from neutral loss of H2O or NH3 are indicate by ‘ and * respectively.
Table 3.
Peptides detected by LCQ DECA XP+ MS (Me: Monomethylation; Me2: Dimethylation; Me3: Trimethylation; Ac: Acetylation; RT: Retention time)
| Measured (m/z) |
Calculated (m/z) |
RT (min) |
Sequence |
|---|---|---|---|
| 446.313+ | 445.903+ | 32.40 | 73EIAQDFKTDLR83 |
| 675.882+ | 675.362+ | 32.74 | 73EIAQDFKMeTDLR83 |
| 455.763+ | 455.253+ | 32.89 | 73EIAQDFKMe2TDLR83 |
| 460.563+ | 459.923+ | 32.54 | 73EIAQDFKMe3TDLR83 |
| 669.072+ | 668.382+ | 15.38 | 28SAPSTGGVKMeKPHR40 |
| 675.762+ | 675.392+ | 16.09 | 28SAPSTGGVKMe2KPHR40 |
| 683.042+ | 682.392+ | 15.68 | 28SAPSTGGVKMe3KPHR40 |
| 466.682+ | 466.262+ | 6.52 | 27KSAPSTGGVK36 |
| 487.512+ | 487.272+ | 10.83 | 27KAcSAPSTGGVK36 |
| 508.152+ | 507.812+ | 16.73 | 18KQLASKAcAAR26 |
| 529.182+ | 528.812+ | 25.50 | 18KAcQLASKAcAAR26 |
| 538.593+ | 538.323+ | 79.04 | 1 AcSGRGKGGKGLGKGGAKR17 |
| 828.092+ | 827.982+ | 82.17 | 1 AcSGRGKGGKGLGKGGAKAcR17 |
Figure 9.
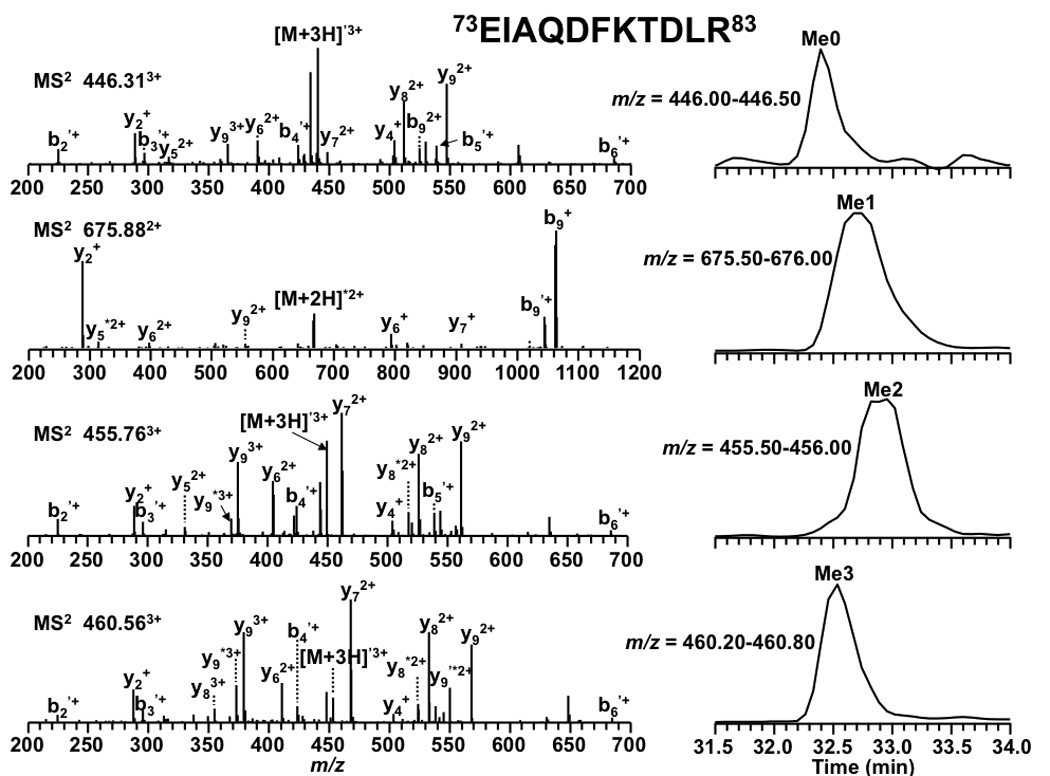
Tandem MS results and LC-extracted ion chromatograms of peptide 73EIAQDFKTDLR83 from an LCQ DECA XP+ ion trap mass spectrometer. Product ions resulting from neutral loss of H2O or NH3 are indicate by ‘ and * respectively.
Based on our observations we conclude that relative retention time from RPLC plays a powerful supporting role in distinguishing between the isobaric modifications, acetylation and trimethylation, especially when the unmodified peptide is observed as a reference for RPLC retention time. The mono- and dimethylated isoforms can also be used as reference when the unmodified form is not present. Thus, using either the unmodified, mono-or dimethylated isoforms as references one can distinguish between trimethylation and acetylation (see Figure 5 for an example). In the case that no reference ion is observed, a high-mass accuracy mass spectrometer would be required.
CONCLUSION
The present study was undertaken to explore the feasibility of distinguishing acetylation from trimethylation of lysine by using retention time on RPLC. To address the question, histone H3 of S. cerevisiae was characterized by shotgun proteomics, nano-LC-MS/ on FT-ICR and ion trap mass spectrometers. The data convincingly demonstrate acetylation resulted in substantial changes in retention time, whereas methylation not. Thus relative retention plays a powerful supporting role in distinguishing between these isobaric modifications.
ACKNOWLEDGEMENTS
The study was funded by The Ohio State University, National Institutes of Health CA107106 and CA101956, Leukemia and Lymphoma Society, and AACR V-Foundation. The authors thank Dr. Hua Xu for helpful discussion and development the software analysis program, MassMatrix. Thanks are also given to Dr. Xiaodan for assistance with histone extraction.
Footnotes
Publisher's Disclaimer: This is a PDF file of an unedited manuscript that has been accepted for publication. As a service to our customers we are providing this early version of the manuscript. The manuscript will undergo copyediting, typesetting, and review of the resulting proof before it is published in its final citable form. Please note that during the production process errors may be discovered which could affect the content, and all legal disclaimers that apply to the journal pertain.
REFERENCES
- 1.Margueron R, Trojer P, Reinberg D. The key to development: interpreting the histone code? Curr Opin Genet Dev. 2005;15:163–176. doi: 10.1016/j.gde.2005.01.005. [DOI] [PubMed] [Google Scholar]
- 2.Espino PS, Drobic B, Dunn KL, Davie JR. Histone modifications as a platform for cancer therapy. J Cell Biochem. 2005;94:1088–1102. doi: 10.1002/jcb.20387. [DOI] [PubMed] [Google Scholar]
- 3.Archer SY, Hodin RA. Histone acetylation and cancer. Curr Opin Genet Dev. 1999;9:171–174. doi: 10.1016/s0959-437x(99)80026-4. [DOI] [PubMed] [Google Scholar]
- 4.Martin C, Zhang Y. The diverse functions of histone lysine methylation. Nat Rev Mol Cell Biol. 2005;6:838–849. doi: 10.1038/nrm1761. [DOI] [PubMed] [Google Scholar]
- 5.Sterner DE, Berger SL. Acetylation of histones and transcription-related factors. Microbiol Mol Biol Rev. 2000;64:435–459. doi: 10.1128/mmbr.64.2.435-459.2000. [DOI] [PMC free article] [PubMed] [Google Scholar]
- 6.Millar CB, Grunstein M. Genome-wide patterns of histone modifications in yeast. Nat Rev Mol Cell Biol. 2006;7:657–666. doi: 10.1038/nrm1986. [DOI] [PubMed] [Google Scholar]
- 7.Lachner M, O'Sullivan RJ, Jenuwein T. An epigenetic road map for histone lysine methylation. J Cell Sci. 2003;116:2117–2124. doi: 10.1242/jcs.00493. [DOI] [PubMed] [Google Scholar]
- 8.Cheung P, Tanner KG, Cheung WL, Sassone-Corsi P, Denu JM, Allis CD. Synergistic coupling of histone H3 phosphorylation and acetylation in response to epidermal growth factor stimulation. Mol Cell. 2000;5:905–915. doi: 10.1016/s1097-2765(00)80256-7. [DOI] [PubMed] [Google Scholar]
- 9.Lo WS, Trievel RC, Rojas JR, Duggan L, Hsu JY, Allis CD, Marmorstein R, Berger SL. Phosphorylation of serine 10 in histone H3 is functionally linked in vitro and in vivo to Gcn5-mediated acetylation at lysine 14. Mol Cell. 2000;5:917–926. doi: 10.1016/s1097-2765(00)80257-9. [DOI] [PubMed] [Google Scholar]
- 10.Edmondson DG, Davie JK, Zhou J, Mirnikjoo B, Tatchell K, Dent SY. Site-specific loss of acetylation upon phosphorylation of histone H3. J Biol Chem. 2002;277:29496–29502. doi: 10.1074/jbc.M200651200. [DOI] [PubMed] [Google Scholar]
- 11.Zhang K, Williams KE, Huang L, Yau P, Siino JS, Bradbury EM, Jones PR, Minch MJ, Burlingame AL. Histone acetylation and deacetylation: identification of acetylation and methylation sites of HeLa histone H4 by mass spectrometry. Mol Cell Proteomics. 2002;1:500–508. doi: 10.1074/mcp.m200031-mcp200. [DOI] [PubMed] [Google Scholar]
- 12.Galasinski SC, Resing KA, Ahn NG. Protein mass analysis of histones. Methods. 2003;31:3–11. doi: 10.1016/s1046-2023(03)00082-3. [DOI] [PubMed] [Google Scholar]
- 13.Medzihradszky KF, Zhang X, Chalkley RJ, Guan S, McFarland MA, Chalmers MJ, Marshall AG, Diaz RL, Allis CD, Burlingame AL. Characterization of Tetrahymena histone H2B variants and posttranslational populations by electron capture dissociation (ECD) Fourier transform ion cyclotron mass spectrometry (FT-ICR MS) Mol Cell Proteomics. 2004;3:872–886. doi: 10.1074/mcp.M400041-MCP200. [DOI] [PubMed] [Google Scholar]
- 14.Freitas MA, Sklenar AR, Parthun MR. Application of mass spectrometry to the identification and quantification of histone post-translational modifications. J Cell Biochem. 2004;92:691–700. doi: 10.1002/jcb.20106. [DOI] [PMC free article] [PubMed] [Google Scholar]
- 15.Syka JE, Marto JA, Bai DL, Horning S, Senko MW, Schwartz JC, Ueberheide B, Garcia B, Busby S, Muratore T, Shabanowitz J, Hunt DF. Novel linear quadrupole ion trap/FT mass spectrometer: performance characterization and use in the comparative analysis of histone H3 post-translational modifications. J Proteome Res. 2004;3:621–626. doi: 10.1021/pr0499794. [DOI] [PubMed] [Google Scholar]
- 16.Zhang L, Su X, Liu S, Knapp AR, Parthun MR, Marcucci G, Freitas MA. Histone H4 N-terminal acetylation in Kasumi-1 cells treated with depsipeptide determined by acetic acid-urea polyacrylamide gel electrophoresis, amino acid coded mass tagging, and mass spectrometry. J Proteome Res. 2007;6:81–88. doi: 10.1021/pr060139u. [DOI] [PMC free article] [PubMed] [Google Scholar]
- 17.Huq MD, Tsai NP, Khan SA, Wei LN. Lysine Trimethylation of Retinoic Acid Receptor-{alpha}: A Novel Means To Regulate Receptor Function. Mol Cell Proteomics. 2007;6:677–688. doi: 10.1074/mcp.M600223-MCP200. [DOI] [PubMed] [Google Scholar]
- 18.Zhang L, Eugeni EE, Parthun MR, Freitas MA. Identification of novel histone post-translational modifications by peptide mass fingerprinting. Chromosoma. 2003;112:77–86. doi: 10.1007/s00412-003-0244-6. [DOI] [PubMed] [Google Scholar]
- 19.Zhang K, Yau PM, Chandrasekhar B, New R, Kondrat R, Imai BS, Bradbury ME. Differentiation between peptides containing acetylated or tri-methylated lysines by mass spectrometry: an application for determining lysine 9 acetylation and methylation of histone H3. Proteomics. 2004;4:1–10. doi: 10.1002/pmic.200300503. [DOI] [PubMed] [Google Scholar]
- 20.Smith CM, Gafken PR, Zhang Z, Gottschling DE, Smith JB, Smith DL. Mass spectrometric quantification of acetylation at specific lysines within the amino-terminal tail of histone H4. Anal Biochem. 2003;316:23–33. doi: 10.1016/s0003-2697(03)00032-0. [DOI] [PubMed] [Google Scholar]
- 21.Ong SE, Mittler G, Mann M. Identifying and quantifying in vivo methylation sites by heavy methyl SILAC. Nat Methods. 2004;1:119–126. doi: 10.1038/nmeth715. [DOI] [PubMed] [Google Scholar]
- 22.Ren C, Liu S, Ghoshal K, Hsu PH, Jacob ST, Marcucci G, Freitas MA. Simultaneous metabolic labeling of cell with multiple amino acids: localization and dynamics of histone acetylation and methylation. Proteomics: Clinical Applications. 2007;1:130–142. doi: 10.1002/prca.200600631. [DOI] [PubMed] [Google Scholar]
- 23.Fu M, Liu M, Sauve AA, Jiao X, Zhang X, Wu X, Powell MJ, Yang T, Gu W, Avantaggiati ML, Pattabiraman N, Pestell TG, Wang F, Quong AA, Wang C, Pestell RG. Hormonal control of androgen receptor function through SIRT1. Mol Cell Biol. 2006;26:8122–8135. doi: 10.1128/MCB.00289-06. [DOI] [PMC free article] [PubMed] [Google Scholar]
- 24.Bouras T, Fu M, Sauve AA, Wang F, Quong AA, Perkins ND, Hay RT, Gu W, Pestell RG. SIRT1 deacetylation and repression of p300 involves lysine residues 1020/1024 within the cell cycle regulatory domain 1. J Biol Chem. 2005;280:10264–10276. doi: 10.1074/jbc.M408748200. [DOI] [PubMed] [Google Scholar]
- 25.Shevchenko A, Jensen ON, Podtelejnikov AV, Sagliocco F, Wilm M, Vorm O, Mortensen P, Shevchenko A, Boucherie H, Mann M. Linking genome and proteome by mass spectrometry: large-scale identification of yeast proteins from two dimensional gels. Proc Natl Acad Sci U S A. 1996;93:14440–14445. doi: 10.1073/pnas.93.25.14440. [DOI] [PMC free article] [PubMed] [Google Scholar]
- 26.Yates JR., 3rd Mass spectrometry and the age of the proteome. J Mass Spectrom. 1998;33:1–19. doi: 10.1002/(SICI)1096-9888(199801)33:1<1::AID-JMS624>3.0.CO;2-9. [DOI] [PubMed] [Google Scholar]
- 27.Garcia MC, Hogenboom AC, Zappey H, Irth H. Effect of the mobile phase composition on the separation and detection of intact proteins by reversed-phase liquid chromatography-electrospray mass spectrometry. J Chromatogr A. 2002;957:187–199. doi: 10.1016/s0021-9673(02)00345-x. [DOI] [PubMed] [Google Scholar]
- 28.Strittmatter EF, Ferguson PL, Tang K, Smith RD. Proteome analyses using accurate mass and elution time peptide tags with capillary LC time-of-flight mass spectrometry. J Am Soc Mass Spectrom. 2003;14:980–991. doi: 10.1016/S1044-0305(03)00146-6. [DOI] [PubMed] [Google Scholar]
- 29.Ren C, Zhang L, Freitas MA, Ghoshal K, Parthun MR, Jacob ST. Peptide mass mapping of acetylated isoforms of histone H4 from mouse lymphosarcoma cells treated with histone deacetylase (HDACs) inhibitors. J Am Soc Mass Spectrom. 2005;16:1641–1653. doi: 10.1016/j.jasms.2005.06.001. [DOI] [PMC free article] [PubMed] [Google Scholar]
- 30.Meek JL. Prediction of peptide retention times in high-pressure liquid chromatography on the basis of amino acid composition. Proc Natl Acad Sci U S A. 1980;77:1632–1636. doi: 10.1073/pnas.77.3.1632. [DOI] [PMC free article] [PubMed] [Google Scholar]
- 31.Guo D, Mant CT, Taneja AK, Hodges RS. Prediction of peptide retention times in reversed-phase high-performance liquid chromatography. II. Correlation of observed and predicted peptide retention times and factors influencing the retention times of peptides. J Chromatogr. 1986;359:519–532. [Google Scholar]
- 32.Guo D, Mant CT, Taneja AK, Parker JMR, Hodges RS. Prediction of peptide retention times in reversed-phase high-performance liquid chromatography. I. Determination of retention coefficients of amino acid residues of model synthetic peptides. J Chromatogr. 1986;359:499–518. [Google Scholar]
- 33.Mant CT, Burke TW, Black JA, Hodges RS. Effect of peptide chain length on peptide retention behaviour in reversed-phase chromatography. J Chromatogr. 1988;458:193–205. doi: 10.1016/s0021-9673(00)90564-8. [DOI] [PubMed] [Google Scholar]
- 34.Palmblad M, Ramstrom M, Markides KE, Hakansson P, Bergquist J. Prediction of chromatographic retention and protein identification in liquid chromatography/mass spectrometry. Anal Chem. 74;2002:5826–5830. doi: 10.1021/ac0256890. [DOI] [PubMed] [Google Scholar]
- 35.Petritis K, Kangas LJ, Ferguson PL, Anderson GA, Pasa-Tolic L, Lipton MS, Auberry KJ, Strittmatter EF, Shen Y, Zhao R, Smith RD. Use of artificial neural networks for the accurate prediction of peptide liquid chromatography elution times in proteome analyses. Anal Chem. 2003;75:1039–1048. doi: 10.1021/ac0205154. [DOI] [PubMed] [Google Scholar]
- 36.Krokhin OV. Sequence-specific retention calculator. Algorithm for peptide retention prediction in ion-pair RP-HPLC: application to 300- and 100-A pore size C18 sorbents. Anal Chem. 2006;78:7785–7795. doi: 10.1021/ac060777w. [DOI] [PubMed] [Google Scholar]
- 37.Steen H, Jebanathirajah JA, Rush J, Morrice N, Kirschner MW. Phosphorylation analysis by mass spectrometry: myths, facts, and the consequences for qualitative and quantitative measurements. Mol Cell Proteomics. 2006;5:172–181. doi: 10.1074/mcp.M500135-MCP200. [DOI] [PubMed] [Google Scholar]
- 38.Sereda TJ, Mant CT, Quinn AM, Hodges RS. Effect of the alpha-amino group on peptide retention behaviour in reversed-phase chromatography. Determination of the pK(a) values of the alpha-amino group of 19 different N-terminal amino acid residues. J Chromatogr. 1993;646:17–30. doi: 10.1016/s0021-9673(99)87003-4. [DOI] [PubMed] [Google Scholar]
- 39.Thorne AW, Kmiciek D, Mitchelson K, Sautiere P, Crane-Robinson C. Patterns of histone acetylation. Eur J Biochem. 1990;193:701–713. doi: 10.1111/j.1432-1033.1990.tb19390.x. [DOI] [PubMed] [Google Scholar]
- 40.Zhang K, Sridhar VV, Zhu J, Kapoor A, Zhu J-K. Distinctive Core Histone Post-Translational Modification Patterns in Arabidopsis thaliana. PLoS ONE. 2007;2:e1210. doi: 10.1371/journal.pone.0001210. [DOI] [PMC free article] [PubMed] [Google Scholar]
- 41.Garcia BA, Mollah S, Ueberheide BM, Busby SA, Muratore TL, Shabanowitz J, Hunt DF. Chemical derivatization of histones for facilitated analysis by mass spectrometry. Nat Protoc. 2007;2:933–938. doi: 10.1038/nprot.2007.106. [DOI] [PMC free article] [PubMed] [Google Scholar]
- 42.Peters AH, Kubicek S, Mechtler K, O'Sullivan RJ, Derijck AA, Perez-Burgos L, Kohlmaier A, Opravil S, Tachibana M, Shinkai Y, Martens JH, Jenuwein T. Partitioning and plasticity of repressive histone methylation states in mammalian chromatin. Mol Cell. 2003;12:1577–1589. doi: 10.1016/s1097-2765(03)00477-5. [DOI] [PubMed] [Google Scholar]
- 43.Bonaldi T, Imhof A, Regula JT. A combination of different mass spectroscopic techniques for the analysis of dynamic changes of histone modifications. Proteomics. 2004;4:1382–1396. doi: 10.1002/pmic.200300743. [DOI] [PubMed] [Google Scholar]
- 44.Tu S, Bulloch EM, Yang L, Ren C, Huang WC, Hsu PH, Chen CH, Liao CL, Yu HM, Lo WS, Freitas MA, Tsai MD. Identification of Histone Demethylases in Saccharomyces cerevisiae. J Biol Chem. 2007;282:14262–14271. doi: 10.1074/jbc.M609900200. [DOI] [PMC free article] [PubMed] [Google Scholar]
- 45.Lo WS, Henry KW, Schwartz MF, Berger SL. Histone modification patterns during gene activation. Methods Enzymol. 2004;377:130–153. doi: 10.1016/S0076-6879(03)77007-4. [DOI] [PubMed] [Google Scholar]
- 46.Su X, Ren C, Freitas MA. Mass spectrometry-based strategies for characterization of histones and their post-translational modifications. Expert Rev Proteomics. 2007;4:211–225. doi: 10.1586/14789450.4.2.211. [DOI] [PMC free article] [PubMed] [Google Scholar]
- 47.Su X, Naduparambil J, Amunugama R, Lucas DM, Knapp A, Ren C, Davis ME, Marcucci G, Parthun MR, Byrd JC, Fishel R, Freitas MA. Liquid Chromatography Mass Spectrometry Profiling of Histones. J Chrom B. 2007 January;7 doi: 10.1016/j.jchromb.2006.12.037. In Press, Corrected Proof, Available online. [DOI] [PMC free article] [PubMed] [Google Scholar]
- 48.Xu H, Freitas MA. A mass accuracy sensitive probability based scoring algorithm for database searching of tandem mass spectrometry data. BMC Bioinformatics. 2007;8:133. doi: 10.1186/1471-2105-8-133. [DOI] [PMC free article] [PubMed] [Google Scholar]
- 49.Keogh MC, Kurdistani SK, Morris SA, Ahn SH, Podolny V, Collins SR, Schuldiner M, Chin K, Punna T, Thompson NJ, Boone C, Emili A, Weissman JS, Hughes TR, Strahl BD, Grunstein M, Greenblatt JF, Buratowski S, Krogan NJ. Cotranscriptional set2 methylation of histone H3 lysine 36 recruits a repressive Rpd3 complex. Cell. 2005;123:593–605. doi: 10.1016/j.cell.2005.10.025. [DOI] [PubMed] [Google Scholar]
- 50.Kurdistani SK, Tavazoie S, Grunstein M. Mapping global histone acetylation patterns to gene expression. Cell. 2004;117:721–733. doi: 10.1016/j.cell.2004.05.023. [DOI] [PubMed] [Google Scholar]
- 51.Pokholok DK, Harbison CT, Levine S, Cole M, Hannett NM, Lee TI, Bell GW, Walker K, Rolfe PA, Herbolsheimer E, Zeitlinger J, Lewitter F, Gifford DK, Young RA. Genome-wide map of nucleosome acetylation and methylation in yeast. Cell. 2005;122:517–527. doi: 10.1016/j.cell.2005.06.026. [DOI] [PubMed] [Google Scholar]
- 52.Xu F, Zhang K, Grunstein M. Acetylation in histone H3 globular domain regulates gene expression in yeast. Cell. 2005;121:375–385. doi: 10.1016/j.cell.2005.03.011. [DOI] [PubMed] [Google Scholar]
- 53.Zhang K. Qualitative and quantitative analysis of lysine acetylation and methylation in yeast histone H3. International Journal of Mass Spectrometry. 2008;269:101–111. [Google Scholar]
- 54.Zhang L, Freitas MA. Comparison of peptide mass mapping and electron capture dissociation as assays for histone posttranslational modifications. International J Mass Spctrome. 2004;234:213–225. [Google Scholar]


