

Abstract
Discovering small-molecule modulators for thousands of gene products requires multiple stages of biological testing, specificity evaluation, and chemical optimization. Many cellular profiling methods, including cellular sensitivity, gene-expression, and cellular imaging, have emerged as methods to assess the functional consequences of biological perturbations. Cellular profiling methods applied to small-molecule science provide opportunities to use complex phenotypic information to prioritize and optimize small-molecule structures simultaneously against multiple biological endpoints. As throughput increases and cost decreases for such technologies, we see an emerging paradigm of using more information earlier in probe- and drug-discovery efforts. Moreover, increasing access to public datasets makes possible the construction of “virtual” profiles of small-molecule performance, even when multiplexed measurements were not performed or when multidimensional profiling was not the original intent. We review some key conceptual advances in small-molecule phenotypic profiling, emphasizing connections to other information, such as protein-binding measurements, genetic perturbations, and cell states. We argue that to maximally leverage these measurements in probe and drug discovery requires a fundamental connection to synthetic chemistry, allowing the consequences of synthetic decisions to be described in terms of changes in small-molecule profiles. Mining such data in the context of chemical structure and synthesis strategies can inform decisions about chemistry procurement and library development, leading to optimal small-molecule screening collections.
Introduction
High-throughput screening (HTS) is an established avenue for small-molecule probe and drug discovery. Cell-based assay measurements are increasingly used as starting points because they are thought to better reflect the cellular context of protein and pathway function than screens with purified proteins [1,2]. On the other hand, cell-based screening presents challenges in determining the precise targets or mechanisms of action for active compounds [3–5]. Multidimensional phenotypic profiling attempts to leverage the information content associated with making multiple measurements of compound action on cells, either in parallel or in multiplexed assay formats, such as gene-expression arrays or image-based methods. Small molecule-based phenotypic profiling approaches have recently been reviewed in detail [6]. Here, we discuss phenotypic profiling of small molecules in the context of connections between such profiles and other data types, including protein binding, cell states or genotypes, and small-molecule structure.
The conceptual aims of small-molecule profiling are different than those of small-molecule screening. Screening is a hierarchical process, where the goal is to move quickly from a large number of compounds to a small number of “interesting” compounds. In contrast, phenotypic profiling relies on information content and pattern matching or discovery, and therefore benefits from collecting rich datasets on all compounds tested. Because of this difference in perspective, screening and profiling approaches are often applied successively in the drug-discovery process [7], with profiling applied only to those compounds deemed active in primary screens. However, this division often means that many of the chemical connections between small molecules are filtered out before profiling begins, since the vast majority of compounds originally screened do not go through profiling.
While it is understandable that more expensive and time-consuming approaches be applied to fewer compounds, we believe that selection of compounds for profiling generally benefits from including groups of related compounds in order to illuminate structure-activity relationships (SAR), rather than only testing compounds called active in a primary screen. In the limit of this logic, complete compound collections reflecting skeletal, stereochemical, and appendage diversity [8] could be evaluated by multidimensional phenotypic profiling. Such an approach would allow quantitative structural (or synthetic history) connections between compounds to inform future chemistry decisions based on their impact on profiling endpoints. While lead series of related compounds from HTS have been exposed to target-based profiling to determine selectivity and SAR, the use of multidimensional phenotypic profiling for such analyses is rare [9] (see also [10] for a recent example involving image-based micronuclei analysis). Furthermore, this approach has not been routinely extended to multiple rounds of library development directed at optimizing small-molecule screening collections. Indeed, many of the most illustrative examples of the utility of phenotypic profiling have been reported as proof-of-concept works involving “known bioactive” compounds (sometimes called “landmarks” [6]). In such cases, activity annotations for these known compounds can provide mechanistic validation of pathways and targets, but such molecules do not usually emerge from shared synthetic pathways or have sufficient chemical similarity to provide useful connections to synthetic decisions (Figure 1). Below, we review some key conceptual advances in phenotypic profiling and connecting these profiles to cell states, protein-binding, and genetic perturbations. We then highlight two studies that make a direct connection between phenotypic profiles and synthetic chemistry, and propose methods to generalize these approaches to larger compound collections.
Figure 1. General conceptual framework for phenotypic profiling of small molecules.
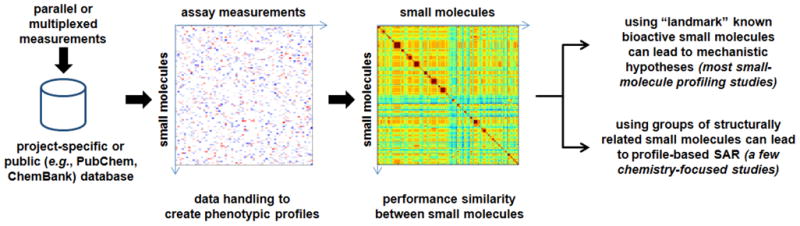
Measurement data are integrated (details depending on the measurement types) to afford computational vector representations of each compound in the measurement “space”, after which similarities between profiles can be computed for each pair of compounds. Most profiling studies rely on “landmark” compounds to connect new compounds to compounds with known mechanisms of action. Some chemistry-centric studies, highlighted in this review, attempt to uncover relationships between profile similarities and decisions made during small-molecule library synthesis.
Key milestones in phenotypic profiling
Cellular sensitivity analysis
An important body of work in the history of phenotypic profiling is the assessment of 60 cell lines (NCI60) for differential sensitivity to chemotherapeutic agents by the National Cancer Institute s Developmental Therapeutics Program [11]. Weinstein and colleagues used multiple parallel measurements of cell death and a common compound collection to generate profiles and develop hypotheses for retesting. By representing the data as matrices of values representing small molecules by cell lines, and cell lines by molecular targets (i.e., 113 cellular “features”), the authors were able to use matrix algebra to connect small molecules and molecular targets (Figure 2).
Figure 2. Connectivity of small molecules with molecular targets using the NCI-60 cell lines [11].
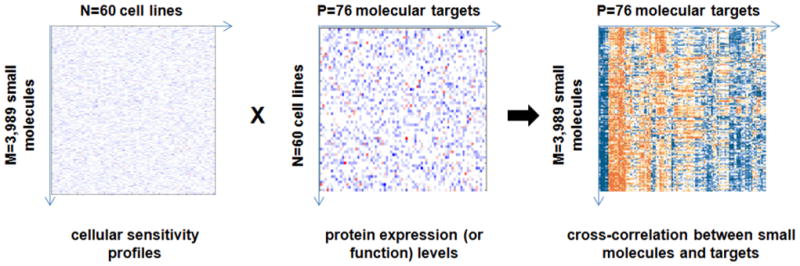
Matrix algebra was adapted to produce clustered correlations between 3,989 small molecules and 76 molecular targets (represented by 113 cellular “features”) using the “common language” of 60 cancer cell lines in which both small-molecule sensitivity and protein expression (or function) levels were measured.
This study was among the first small-molecule profiling efforts using multidimensional cell-based assays, and also addressed analysis of molecular target similarities. The authors generated a 113×113 similarity matrix of targets, based on protein expression across 60 cell lines. Clusters of similarity validated known pathways and indicated that this clustering yields relationships of significance. A second 113×113 similarity matrix of targets was also generated, this one based on correlation of compound activities for 3,989 compounds of interest. This kind of analysis leads to hypothesis generation linking cell lines, molecular targets, and small molecules. More recent work has made these datasets and analyses searchable and easily accessible via the Internet [12].
A key conceptual advance in the NCI60 studies was to use cell lines as a “common language” in which cross-correlation enabled “connectivity” between small molecules and molecular targets. Many subsequent phenotypic profiling efforts have used an analogous “language” in which to express connections between profiles. Importantly, the authors commented on the potential to use the compound collection in a similar fashion to link the cell lines and chemical substructure features. In this way, calculated molecular descriptors for each small molecule could be used to establish relationships between structure features and cell-line sensitivity, or indeed between such features and molecular targets. These initial efforts to identify relationships between structure descriptors and targets were difficult to interpret, and the authors suggested that other methods may be more appropriate for chemical structure analysis. As we shall discuss, our own efforts to identify substructure features correlated with biological performance similarity revealed that including all descriptors can increase noise, resulting in a diminished ability to decipher patterns [13]. Systematically limiting the chemical description to subsets of features, and the number of biological outcomes simultaneously interpreted, more successfully identified features correlated with phenotypic profile similarity.
Gene-expression analysis
A study in 2000 [14] introduced the concept that gene-expression profiles [15,16] can represent small molecule-induced phenotypes. Using two-color cDNA microarrays, these authors measured transcriptional responses in S. cerevisiae to 276 genetic deletion mutants, 11 tetracycline-regulated alleles, and 13 small molecules. This dataset enabled hierarchical clustering and comparison across various treatments. Because annotated genes were included in the data compendium, it could be used in a predictive capacity on ORFs of unknown function and compounds with unknown protein targets, allowing determination of cellular functions for eight unknown ORFs, as well as the target of the anesthetic dyclonine.
This work represented an early effort to integrate genomic and chemical data to uncover mechanisms of action. One requirement for the success of this approach is the inclusion of “landmark” profiles from known pathways, a potentially limiting prerequisite. Further, all perturbations were performed at a single growth condition; as a result, additional growth conditions may be necessary to uncover responses. These hindsight conclusions do not, however, detract from the forward-looking nature of this study. A number of ensuing profiling experiments use similar guiding principles as features of their analyses [17,18].
More recently, this general principle of connecting small molecules through the “common language” of gene expression was applied to mammalian cells to establish the Connectivity Map [19]. Using human cancer cells, this study measured responses to 164 compounds after six-hour treatment. Unlike Hughes et al., the Connectivity Map did not hierarchically cluster the gene-expression data, instead using a rank-parametric method to represent the degree of similarity with which compounds up- or down-regulate the same genes. The Connectivity Map was established as a reference database of “landmark” signatures that can be queried with new signatures.
Like the yeast gene-expression compendium, the Connectivity Map relies on reference profiles for matching to novel compounds. A significant advantage of this system, however, is the ability to simultaneously retrieve both positively and negatively correlated signatures. Further, because of the analytical method, any number of genes and sources of expression data can be used as a query signature, enabling hypothesis tests from literature sources. Similar profiling methods using a gene signature-based method include direct measurements of selected genes using barcoded beads [20,21], which have the potential to increase throughput at the expense of genome-wide coverage. The relative utility of such methods to resolve small differences in compound-induced phenotypes remains to be seen, as their use is expanded to routine testing of novel compound collections.
Image-based methods
Over time, researchers have gained appreciation for the power of phenotypic profiling, and cellular phenotypic responses to small-molecule perturbation have been expanded beyond cell death and gene expression. The increased availability of image-based assays has enabled the use of visual phenotypes to profile responses to compound treatment [22–24]. Perlman and colleagues [25] used cellular features obtained by microscopy to address compound treatment and concentration effects. They used HeLa cells treated with thirteen concentrations of each of 90 compounds with known activities, one non-specific compound, and three molecules of unknown function. Cells were treated with a nuclear dye and five pairs of cellular dyes, effectively “painting” the various cell compartments. Statistical measures were used to compare experimental and control distributions; to account for differences in chemical affinity or potency, the authors developed a scoring system that allowed assignment of profile similarity independent of differences in effective compound concentrations. Significantly, this effort incorporated miniaturization principles of high-throughput screening in a profiling experiment. Thus, the work proves the principle that large-scale datasets from microtiter plates, even comprising complex imaging readouts, can be leveraged to perform profiling and predict the function of uncharacterized compounds.
More recently, image-based profiling has moved toward more sophisticated phenotypes [26–28], including those based on shape and intensity measurements to which machine-learning approaches have been applied [29–31]. In one such study [32], unbiased phenotypes were used to identify underlying biological traits; that is, rather than using visual features that are directly biologically interpretable by humans, groups of features are found that together constitute a phenotypic “trait”. This method of factor analysis was used to score a set of nuclear features in cells treated with more than 6,500 compounds using an analysis method on data from individual cells to select features that were important to each trait.
Importantly, this work began to address the role of chemical structure in the similarity between phenotypic profiles, using a common set of chemical substructure features (ECFPs [33]) and Tanimoto similarity coefficients [34] to analyze chemical similarity. By comparing phenotypic profile similarity with chemical structure similarity, the authors uncovered some SAR among clusters of similarly performing compounds. In contrast to many profiling studies, these authors used not only bioactive “landmark” compounds, but also natural products and proprietary synthetic compounds. In principle, compounds in this case might have more structural similarities than among “landmark” compounds. However, in this study the chemical representation was not varied as part of the analysis. As we discuss below, a major determinant in chemical similarity is the choice of features used to represent a compound collection.
Profiling across different measurement types
In principle, there is no reason one must use a single readout type to generate phenotypic profiles, and several such studies have emerged in recent years [9,35,36]. Conceptually, as long as the scoring system allows assay results to be combined so that an overall similarity score between pairs of compounds can be calculated, cross-assay profiling is a feasible strategy. To that end, one of us (BKW) used a combination of five cell-based phenotypic assays and a gene-expression signature-based assay in skeletal muscle cells to identify small molecules with effects on mitochondrial biology [37]. The integration of several plate reader-based readouts with the profiles afforded by gene expression-based assays enabled both identification of small molecules that may act as disease modifiers, and the classification of drug toxicity based on common members of a drug class. This type of approach demonstrates the power of small-molecule profiling by assembling multiple readouts versus performing individual assays. However, even in this effort, known “landmark” compounds were used, and profiles were examined in a fairly ad-hoc fashion.
Similar methods of aggregating data collected on a common compound collection underlie data-mining approaches that leverage growing public databases of small-molecule screening and follow-up data, such as PubChem [38] and ChemBank [39]. Each of these resources attempts to render the results of different assays formally comparable, as was done in the case of the NCI60 cell-line analyses using GI50 measurements [11]. PubChem provides both binary and standardized scaled scores (1–100) to indicate compound performance in assays. ChemBank provides a standardized score based on compound perturbations relative to the DMSO control distributions for a given assay. Furthermore, ChemBank also houses raw HTS data for most assays, allowing data analysts the opportunity to download data and apply their own data-handling methods to compute a mathematical similarity between small-molecule profiles (see Figure 1).
Connections to genomics, proteomics, and synthetic chemistry decisions
Gene compensation methods
The genetic tractability of S. cerevisiae has made yeast-based small-molecule profiling attractive for testing chemical-genetic interactions. One of us (PAC) was involved in an early study using sensitivity to combinations of small molecules to discriminate yeast strains with small genetic differences [40]. Whereas our study focused on 11 genes in one biological pathway, Parsons et al. [41] used a similar approach on a genome-wide scale to tackle the question of target identification. This group tested twelve compounds against a yeast deletion set of ~4,700 mutants to identify hypersensitive mutants by scoring colony formation. In this case, hypersensitivity of particular deletion mutants to a semi-inhibitory compound concentration indicates a chemical-genetic interaction between the gene and compound. In turn, clustering of the chemical-genetic interactions can be compared with synthetic lethal gene-gene interactions to infer the involvement of the molecular target of the small molecule in particular cellular pathways. This approach was used, for example, to confirm existing and suggest novel mechanisms of multi-drug resistance, and laid the foundation for using chemical-genetic interaction information to infer small-molecule targets.
As experimental methods have become more sophisticated, groups have been better able to address some of the shortcomings of earlier approaches [42,43]. Ho and colleagues [44] recently developed a complementation-based approach to more rapidly identify small-molecule mechanisms of action. Recessive drug-resistant yeast strains were transformed with a molecularly barcoded ORF library [45]; introduction of a wild-type copy of the gene responsible for resistance renders the strain sensitive. As a result, cells that received that gene are depleted from the pool of transformants, which can be deconvoluted by microarray.
In order to demonstrate that comparative profiling can be effective in animal cells, parallel screening of small-molecule and RNAi libraries [46,47] for the same phenotype was performed [48]. Cultured Drosophila cells were exposed to 51,000 compounds and nearly 20,000 double-stranded RNAs for inhibition of cytokinesis. Regardless of perturbation format, cytoplasm and nuclei were stained and imaged using automated microscopy. As a result, 50 compounds and 214 genes were identified as important for cytokinesis. Of note, small-molecule treatment resulted in more phenotype classifications than genetic manipulation. This work represents an important example of combining small-molecule and genetic perturbations to effect target identification in mammalian cells.
Protein-binding profiles
Almost fifteen years ago, Kauvar and coworkers [49] published a method termed “affinity fingerprinting.” This seminal work in small-molecule profiling (albeit not cell-based) represents one of the earliest attempts to characterize small-molecule performance across multiple assays, and to use this information to make predictions about the performance of new compounds. The authors recognized a central tenet of profiling experiments: that the patterns they observed might have been missed in a more conventional “one-protein-at-a-time” screening approach [49]. They evaluated the information content of their empirical profiles to reveal feature patterns corresponding to general ligand-binding properties of proteins. This finding suggests that general rules corresponding to classes of protein small-molecule interaction might emerge from larger target-based datasets more recently collected using enzyme inhibition [50–52] or binding measurements, such as obtained using small-molecule microarrays (SMM) [53,54].
Today, several sets of protein-binding and -inhibition data are available publicly, including databases devoted to binding measurements [55–57], activities against purified enzymes in PubChem [38], and a large number of SMM data in ChemBank [58]. One can imagine a data-mining approach connecting phenotypic profiles to protein binding that relies on the exposure of sets of proteins and sets of assays to common compound collections (Figure 3). As Weinstein used 60 cell lines as a common language to connect small molecules to protein targets [11], one could use a collection of small molecules to connect proteins with cell-based assays. The advent of a national compound collection holds promise for ensuring that sufficient data are available on a single structurally characterized [59] collection to explore such methods more fully.
Figure 3. Conceptual framework for connecting protein-binding measurements with cell-based assay measurements using small molecules as the connecting dimension.
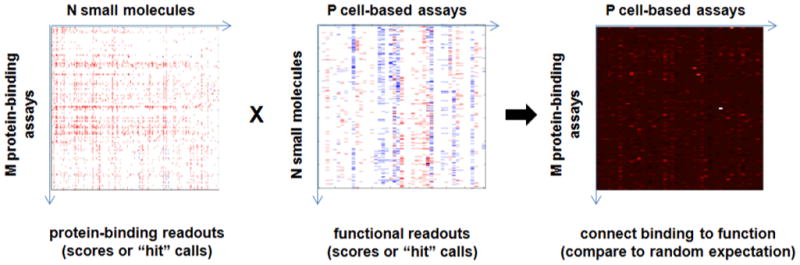
Compounds might be used to directly connect protein-binding assays to cell-based assay measurements when each has been exposed to a common compound collection. A simple implementation would entail comparing the number of shared “hits” to random expectation.
Connecting to synthetic chemistry
What most of the efforts described above have not yet tackled is the role of chemical structure on the biological outcomes observed. This is particularly important if small-molecule profiling is to inform decisions in compound procurement and library development toward optimized screening collections. While some calculation of chemical similarity can be performed on any collection of small molecules with known structures, it is not always clear which structure representation to use, nor what level of similarity should be considered significant [60]. Ideally, a chemical focus should go beyond structure alone and include a description that reflects synthetic history among related members of small-molecule collections.
For libraries of molecules derived from split-pool or diversity-oriented synthesis (DOS) [8,61], chemical similarity can be analyzed using “unbiased” descriptors (as in the image-based study described above [32]), or could be described in terms of chemical decisions resulting in different skeletons, appendages, or even stereochemistry. One effort to understand such chemical information in terms of phenotypic profiling data was performed in 2004, when one of us (PAC) assessed the effects of stereochemistry and ring closure on phenotypic profiles [62]. Using one cell line, four phenotypic readouts, and a set of 17 known bioactive small-molecule modulators, a matrix of multidimensional screening data was generated and evaluated as a 40-dimensional profile for each compound (Figure 4).
Figure 4. Example of applying phenotypic profiling to understanding consequences of synthetic chemistry decisions [62].
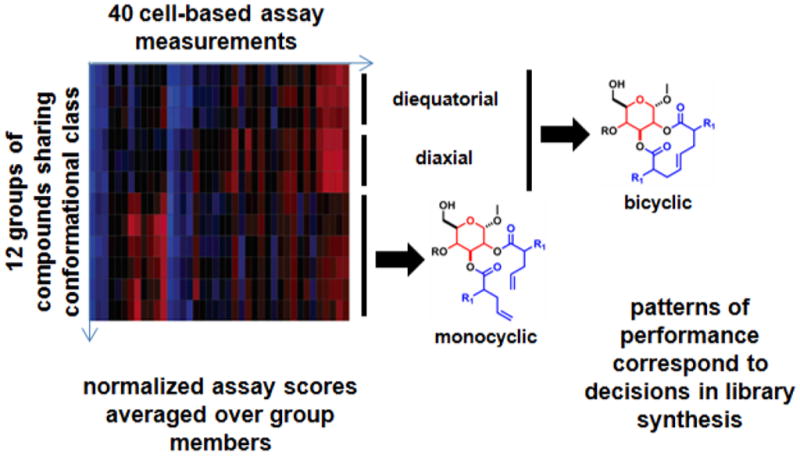
Forty cell-based assay measurements were made on each member of a library of compounds with specific variation in skeletal and stereochemical elements, revealing that patterns of performance correspond to decisions in library synthesis (see text). Images were reproduced in modified form with permission from the J. Am. Chem. Soc.
The small-molecule library tested consisted of 122 carbohydrate-derived bicycles and 122 paired monocycles, using two substitution patterns, three carbohydrate templates, and two α-substitution relationships. Because the objective was to assess effects of stereochemistry and ring size on biological activity, the design of this small collection was directed toward matched-pair analysis. As a result, we observed that as a class, the monocyclic compounds were called positive in a larger number of the 40 assays than were the bicyclic compounds. Hierarchical clustering of average profiles revealed that membership of the skeletal class was the primary determinant of performance similarity between compounds. The stereochemistry on the macrocycle dominated the phenotypic profile among bicyclic compounds, while the stereochemistry on the smaller carbohydrate was dominant in monocyclic compounds. This result demonstrated the ability to use phenotypic profiling to learn about the consequences of synthetic decisions on patterns of biological activity. Importantly, this study made no attempt at biological interpretation of the activity patterns; the assays themselves were simply a surrogate “common language” used to assess the relative performance of compounds with different synthetic histories.
This approach to connect profiling to structure information used simple chemical features (e.g., number of rings, carbohydrate identity) to identify biological differences accessed by different chemist choices. To expand such methods to additional chemical features, we recently developed a similarity-matching method to identify stereochemical features correlated with patterns of performance among phenotypic profiles [13]. We started with a small set (64) of disaccharides with highly constrained differences between compounds. The glycosidic linkage was systematically varied by the anomeric bond configuration, the linkage on the reducing-end sugar, the chirality of sugar monomers, and the stereochemistry of the acceptor hydroxyl group. We subjected these compounds in eight concentrations to ten parallel cell-based assays using brown and white adipocytes. Analysis of the similarities of the resulting phenotypic profiles again revealed groups of compounds sharing patterns of biological performance (Figure 5).
Figure 5. Example of applying phenotypic profile similarity to select subsets of stereochemical features correlated with patterns of biological performance [13].
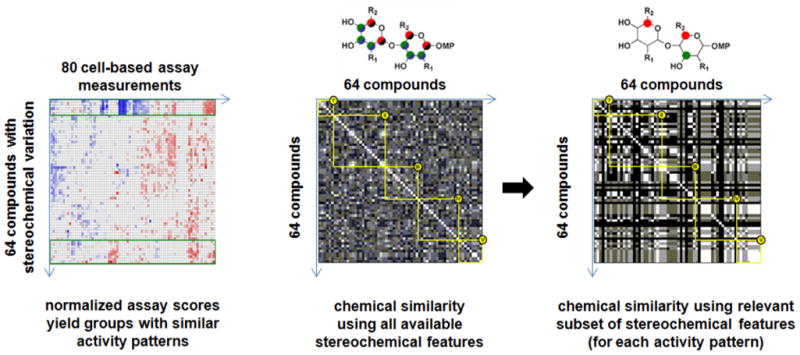
Ten cell-based assay measurements were made at eight concentrations on each member of a library of compounds with specific variations in stereochemical elements. Whereas stereochemical similarity defined by all possible stereocenters showed little relationship to profile similarity, selecting a subset of descriptors identified those stereocenters correlated with particular patterns of biological performance (see text). Images were reproduced in modified form with permission from the J. Am. Chem. Soc.
To map performance similarity to specific chemical features, we focused on the stereochemical centers in the molecules and constructed for each small molecule a fingerprint of binary descriptors representing the relative or absolute configuration at each of 10 stereocenters. With these “custom” structure fingerprints, we could then build a 64×64 matrix of chemical similarity. When we computed such similarities using all descriptors, we observed little relationship between chemical similarities and profile performance similarities. We reasoned that a subset of these descriptors, however, might correlate with performance similarity, particularly if we performed an optimization that considered each pattern of biological performance separately. We developed a method to iteratively test subsets of descriptors for their ability to maximize chemical similarity among compounds within a particular cluster of phenotypic profiles. For example, by focusing on one profiling cluster containing 9 compounds, we identified specific configurations at 3 of the 10 stereocenters that were significantly enriched in all members sharing that phenotypic profile. This result represents a profile-based SAR that could be used to inform additional rounds of synthesis for similar compounds to be tested in similar assays (e.g., which stereocenters to hold constant versus which to vary in a second-generation library). Importantly, this method is agnostic to the biology interrogated. If a different cluster of phenotypic profiles were of greater interest, a second optimization could attempt to identify the (likely different) stereofingerprint correlated with that performance pattern. The important lesson from this study is that the computational description of chemical structure is a variable whose optimization is context-dependent.
In both of these studies, the chemical description was “customized” to the small-molecule library being studied; the descriptors used were only applicable to compounds emerging from the same or very similar chemistry. Generalizing this approach to larger sets of compounds from diverse synthetic origins will require approaches that allow discovery of candidate substructures from the compound collection. Some modern chemical fingerprints (including the ECFPs used by Young et al. [32]) permit precise association of substructure features with individual “bits” in fingerprints. Recalling the limitations addressed by Weinstein in associating chemical descriptors with phenotypic profiles [11], additional methods may be required to prioritize chemical features for relevance before attempting their association with phenotype profiles. With such methods, however, direct applications of the “common language” notion may yet afford significant and informative connections between chemical features, descriptors, or synthetic history information and phenotypic profiles by considering compounds as the basis of “connectivity” (Figure 6). For example, chemical features found to be significantly enriched among “hits” in multiple diverse cell-based assays might be avoided in the future, being likely to incur “non-specific” phenotypic outcomes, similar to analogous work identifying “frequent hitters” in enzyme inhibition assays [63]. Alternatively, chemical substructure features that connect specifically with multiple assays reporting on a single biological pathway might be considered starting points for new libraries directed at pathway-specific modulation (e.g., new chemical “biasing” elements [64,65]). The studies and ideas presented in this section provide a starting point for thinking about how rich phenotypic profiles from existing and emerging technologies [6] can more quantitatively be related to chemical structure analysis and synthetic chemistry decisions.
Figure 6. Conceptual framework for connecting small-molecule substructure features with cell-based assay measurements using small-molecules as the connecting dimension.
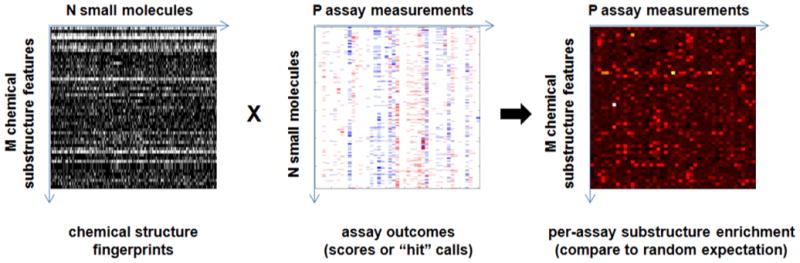
As suggested by Weinstein [11], compounds might be used to directly connect small-molecule substructures to assay outcomes. Such methods might benefit from first restricting the chemical structure representation (see text).
Conclusion
Despite rapid advances in phenotypic profiling measurement technology and biological data analysis, connecting these profiles quantitatively to chemical structure information and synthetic chemistry decisions is often minimal or lacking. Many profiling technologies are still emerging or developmental [6], and have therefore been exposed primarily to collections of bioactive “landmark” compounds, both to demonstrate proof-of-principle for the profiling technology itself, and to limit performance of expensive experiments to pre-validated compounds. These collections often lack significant structure similarity, and are almost always disconnected from information about synthetic planning or even origins. Increased throughput and lowered cost of profiling methods should allow their application to compound collections with defined skeletal, stereochemical, and appendage diversity. Close connections between researchers profiling small-molecule performance and synthetic chemists will ultimately inform which compounds are most likely to be effective contributors to probe- and drug-discovery efforts.
Footnotes
Publisher's Disclaimer: This is a PDF file of an unedited manuscript that has been accepted for publication. As a service to our customers we are providing this early version of the manuscript. The manuscript will undergo copyediting, typesetting, and review of the resulting proof before it is published in its final citable form. Please note that during the production process errors may be discovered which could affect the content, and all legal disclaimers that apply to the journal pertain.
References
- 1.An WF, Tolliday NJ. Introduction: cell-based assays for high-throughput screening. Methods Mol Biol. 2009;486:1–12. doi: 10.1007/978-1-60327-545-3_1. [DOI] [PubMed] [Google Scholar]
- 2.Clemons PA. Complex phenotypic assays in high-throughput screening. Curr Opin Chem Biol. 2004;8:334–338. doi: 10.1016/j.cbpa.2004.04.002. [DOI] [PubMed] [Google Scholar]
- 3.Ong SE, Schenone M, Margolin AA, Li X, Do K, Doud MK, Mani DR, Kuai L, Wang X, Wood JL, et al. Identifying the proteins to which small-molecule probes and drugs bind in cells. Proc Natl Acad Sci U S A. 2009;106:4617–4622. doi: 10.1073/pnas.0900191106. [DOI] [PMC free article] [PubMed] [Google Scholar]
- 4.Schriemer DC, Kemmer D, Roberge M. Design of phenotypic screens for bioactive chemicals and identification of their targets by genetic and proteomic approaches. Comb Chem High Throughput Screen. 2008;11:610–616. doi: 10.2174/138620708785739934. [DOI] [PubMed] [Google Scholar]
- 5.Terstappen GC, Schlupen C, Raggiaschi R, Gaviraghi G. Target deconvolution strategies in drug discovery. Nat Rev Drug Discov. 2007;6:891–903. doi: 10.1038/nrd2410. [DOI] [PubMed] [Google Scholar]
- ● 6.Feng Y, Mitchison TJ, Bender A, Young DW, Tallarico JA. Multi-parameter phenotypic profiling: using cellular effects to characterize small-molecule compounds. Nat Rev Drug Discov. 2009;8:567–578. doi: 10.1038/nrd2876. This review nicely details the measurement technologies used in phenotypic profiling. The authors argue that earlier use of these profiling technologies, and more effective integration with screening efforts, can improve success rates of drug discovery activities. [DOI] [PubMed] [Google Scholar]
- 7.Davis AM, Keeling DJ, Steele J, Tomkinson NP, Tinker AC. Components of successful lead generation. Curr Top Med Chem. 2005;5:421–439. doi: 10.2174/1568026053828411. [DOI] [PubMed] [Google Scholar]
- 8.Nielsen TE, Schreiber SL. Towards the optimal screening collection: a synthesis strategy. Angew Chem Int Ed Engl. 2008;47:48–56. doi: 10.1002/anie.200703073. [DOI] [PMC free article] [PubMed] [Google Scholar]
- 9.Kunkel EJ, Plavec I, Nguyen D, Melrose J, Rosler ES, Kao LT, Wang Y, Hytopoulos E, Bishop AC, Bateman R, et al. Rapid structure-activity and selectivity analysis of kinase inhibitors by BioMAP analysis in complex human primary cell-based models. Assay Drug Dev Technol. 2004;2:431–441. doi: 10.1089/adt.2004.2.431. [DOI] [PubMed] [Google Scholar]
- 10.Benbow JW, Andrews KA, Aubrecht J, Beebe D, Boyer D, Doran S, Homiski M, Hui Y, McPherson K, Parker JC, et al. Piperidinyl-2-phenethylamino inhibitors of DPP-IV for the treatment of type 2 diabetes. Bioorg Med Chem Lett. 2009;19:2220–2223. doi: 10.1016/j.bmcl.2009.02.099. [DOI] [PubMed] [Google Scholar]
- ●● 11.Weinstein JN, Myers TG, O’Connor PM, Friend SH, Fornace AJ, Jr, Kohn KW, Fojo T, Bates SE, Rubinstein LV, Anderson NL, et al. An information-intensive approach to the molecular pharmacology of cancer. Science. 1997;275:343–349. doi: 10.1126/science.275.5298.343. This landmark study used a common compound collection to assess cell death in the NCI60 panel of cancer cell lines, generating profiles and developing hypotheses for retesting. This effort was among the first small-molecule profiling efforts to use multidimensional cell-based assays. [DOI] [PubMed] [Google Scholar]
- 12.Shankavaram UT, Varma S, Kane D, Sunshine M, Chary KK, Reinhold WC, Pommier Y, Weinstein JN. CellMiner: a relational database and query tool for the NCI-60 cancer cell lines. BMC Genomics. 2009;10:277. doi: 10.1186/1471-2164-10-277. [DOI] [PMC free article] [PubMed] [Google Scholar]
- ●● 13.Tanikawa T, Fridman M, Zhu W, Faulk B, Joseph IC, Kahne D, Wagner BK, Clemons PA. Using biological performance similarity to inform disaccharide library design. J Am Chem Soc. 2009;131:5075–5083. doi: 10.1021/ja806583y. This study developed a similarity-matching method to identify stereochemical features correlated with patterns of performance among phenotypic profiles. A small set of disaccharides with highly constrained differences between compounds were subjected in eight concentrations to ten parallel cell-based assays. Analysis of the similarities of the resulting phenotypic profiles revealed groups of compounds sharing patterns of biological performance. [DOI] [PMC free article] [PubMed] [Google Scholar]
- ●● 14.Hughes TR, Marton MJ, Jones AR, Roberts CJ, Stoughton R, Armour CD, Bennett HA, Coffey E, Dai H, He YD, et al. Functional discovery via a compendium of expression profiles. Cell. 2000;102:109–126. doi: 10.1016/s0092-8674(00)00015-5. This study. introduced the concept that gene-expression profiles themselves can represent small molecule-induced phenotypes. The study measured transcriptional responses in S. cerevisiae to a collection of genetic deletion mutants and small molecules. This work represented an early effort to integrate genomic and chemical data to uncover mechanisms of action. [DOI] [PubMed] [Google Scholar]
- 15.Eisen MB, Spellman PT, Brown PO, Botstein D. Cluster analysis and display of genome-wide expression patterns. Proc Natl Acad Sci U S A. 1998;95:14863–14868. doi: 10.1073/pnas.95.25.14863. [DOI] [PMC free article] [PubMed] [Google Scholar]
- 16.Iyer VR, Eisen MB, Ross DT, Schuler G, Moore T, Lee JC, Trent JM, Staudt LM, Hudson J, Jr, Boguski MS, et al. The transcriptional program in the response of human fibroblasts to serum. Science. 1999;283:83–87. doi: 10.1126/science.283.5398.83. [DOI] [PubMed] [Google Scholar]
- 17.Butcher RA, Schreiber SL. Using genome-wide transcriptional profiling to elucidate small-molecule mechanism. Curr Opin Chem Biol. 2005;9:25–30. doi: 10.1016/j.cbpa.2004.10.009. [DOI] [PubMed] [Google Scholar]
- 18.Gunther EC, Stone DJ, Gerwien RW, Bento P, Heyes MP. Prediction of clinical drug efficacy by classification of drug-induced genomic expression profiles in vitro. Proc Natl Acad Sci U S A. 2003;100:9608–9613. doi: 10.1073/pnas.1632587100. [DOI] [PMC free article] [PubMed] [Google Scholar]
- ●● 19.Lamb J, Crawford ED, Peck D, Modell JW, Blat IC, Wrobel MJ, Lerner J, Brunet JP, Subramanian A, Ross KN, et al. The Connectivity Map: using gene-expression signatures to connect small molecules, genes, and disease. Science. 2006;313:1929–1935. doi: 10.1126/science.1132939. The general principle of connecting small molecules through the common language of gene expression was used to establish the Connectivity Map. This study measured responses in human cancer cells to 164 compounds after six-hour treatment. The Connectivity Map was established as a reference database of “landmark” signatures that can be queried with new signatures. [DOI] [PubMed] [Google Scholar]
- 20.Peck D, Crawford ED, Ross KN, Stegmaier K, Golub TR, Lamb J. A method for high-throughput gene expression signature analysis. Genome Biol. 2006;7:R61. doi: 10.1186/gb-2006-7-7-r61. [DOI] [PMC free article] [PubMed] [Google Scholar]
- 21.Stegmaier K, Ross KN, Colavito SA, O’Malley S, Stockwell BR, Golub TR. Gene expression-based high-throughput screening(GE-HTS) and application to leukemia differentiation. Nat Genet. 2004;36:257–263. doi: 10.1038/ng1305. [DOI] [PubMed] [Google Scholar]
- 22.Giuliano KA, Haskins JR, Taylor DL. Advances in high content screening for drug discovery. Assay Drug Dev Technol. 2003;1:565–577. doi: 10.1089/154065803322302826. [DOI] [PubMed] [Google Scholar]
- 23.Huang K, Murphy RF. From quantitative microscopy to automated image understanding. J Biomed Opt. 2004;9:893–912. doi: 10.1117/1.1779233. [DOI] [PMC free article] [PubMed] [Google Scholar]
- 24.Lippincott-Schwartz J, Snapp E, Kenworthy A. Studying protein dynamics in living cells. Nat Rev Mol Cell Biol. 2001;2:444–456. doi: 10.1038/35073068. [DOI] [PubMed] [Google Scholar]
- ● 25.Perlman ZE, Slack MD, Feng Y, Mitchison TJ, Wu LF, Altschuler SJ. Multidimensional drug profiling by automated microscopy. Science. 2004;306:1194–1198. doi: 10.1126/science.1100709. This study used cellular features obtained by microscopy to address compound treatment and concentration effects. Compound-treated HeLa cells were stained with a nuclear dye and five pairs of cellular dyes. This effort illustrates that large-scale datasets can be leveraged to perform profiling and predict the function of uncharacterized compounds. [DOI] [PubMed] [Google Scholar]
- 26.Campillos M, Kuhn M, Gavin AC, Jensen LJ, Bork P. Drug target identification using side-effect similarity. Science. 2008;321:263–266. doi: 10.1126/science.1158140. [DOI] [PubMed] [Google Scholar]
- 27.Edwards BS, Oprea T, Prossnitz ER, Sklar LA. Flow cytometry for high-throughput, high-content screening. Curr Opin Chem Biol. 2004;8:392–398. doi: 10.1016/j.cbpa.2004.06.007. [DOI] [PubMed] [Google Scholar]
- 28.Krutzik PO, Nolan GP. Fluorescent cell barcoding in flow cytometry allows high-throughput drug screening and signaling profiling. Nat Methods. 2006;3:361–368. doi: 10.1038/nmeth872. [DOI] [PubMed] [Google Scholar]
- 29.Carpenter AE, Jones TR, Lamprecht MR, Clarke C, Kang IH, Friman O, Guertin DA, Chang JH, Lindquist RA, Moffat J, et al. CellProfiler: image analysis software for identifying and quantifying cell phenotypes. Genome Biol. 2006;7:R100. doi: 10.1186/gb-2006-7-10-r100. [DOI] [PMC free article] [PubMed] [Google Scholar]
- 30.Jones TR, Carpenter AE, Lamprecht MR, Moffat J, Silver SJ, Grenier JK, Castoreno AB, Eggert US, Root DE, Golland P, et al. Scoring diverse cellular morphologies in image-based screens with iterative feedback and machine learning. Proc Natl Acad Sci U S A. 2009;106:1826–1831. doi: 10.1073/pnas.0808843106. [DOI] [PMC free article] [PubMed] [Google Scholar]
- 31.Loo LH, Wu LF, Altschuler SJ. Image-based multivariate profiling of drug responses from single cells. Nat Methods. 2007;4:445–453. doi: 10.1038/nmeth1032. [DOI] [PubMed] [Google Scholar]
- ●● 32.Young DW, Bender A, Hoyt J, McWhinnie E, Chirn GW, Tao CY, Tallarico JA, Labow M, Jenkins JL, Mitchison TJ, et al. Integrating high-content screening and ligand-target prediction to identify mechanism of action. Nat Chem Biol. 2008;4:59–68. doi: 10.1038/nchembio.2007.53. In this high-content screening study, unbiased phenotypes were used to identify underlying biological traits. This method of factor analysis was used to score a set of nuclear features in cells treated with more than 6,500 compounds. [DOI] [PubMed] [Google Scholar]
- 33.Pipeline Pilot. http://accelrys.com.
- 34.Tanimoto TT. IBM Internal Report. 1957 [Google Scholar]
- 35.Melnick JS, Janes J, Kim S, Chang JY, Sipes DG, Gunderson D, Jarnes L, Matzen JT, Garcia ME, Hood TL, et al. An efficient rapid system for profiling the cellular activities of molecular libraries. Proc Natl Acad Sci U S A. 2006;103:3153–3158. doi: 10.1073/pnas.0511292103. [DOI] [PMC free article] [PubMed] [Google Scholar]
- 36.Plavec I, Sirenko O, Privat S, Wang Y, Dajee M, Melrose J, Nakao B, Hytopoulos E, Berg EL, Butcher EC. Method for analyzing signaling networks in complex cellular systems. Proc Natl Acad Sci U S A. 2004;101:1223–1228. doi: 10.1073/pnas.0308221100. [DOI] [PMC free article] [PubMed] [Google Scholar]
- ● 37.Wagner BK, Kitami T, Gilbert TJ, Peck D, Ramanathan A, Schreiber SL, Golub TR, Mootha VK. Large-scale chemical dissection of mitochondrial function. Nat Biotechnol. 2008;26:343–351. doi: 10.1038/nbt1387. This effort used a combination of five cell-based phenotypic assays and a gene expression-based assay in skeletal muscle cells to identify small molecules with effects on mitochondrial biology. The integration of several plate reader-based readouts with genetic profiles demonstrates the power of small-molecule profiling by assembling multiple readouts. [DOI] [PMC free article] [PubMed] [Google Scholar]
- 38.Wang Y, Xiao J, Suzek TO, Zhang J, Wang J, Bryant SH. PubChem: a public information system for analyzing bioactivities of small molecules. Nucleic Acids Res. 2009;37:W623–633. doi: 10.1093/nar/gkp456. [DOI] [PMC free article] [PubMed] [Google Scholar]
- 39.Seiler KP, George GA, Happ MP, Bodycombe NE, Carrinski HA, Norton S, Brudz S, Sullivan JP, Muhlich J, Serrano M, et al. ChemBank: a small-molecule screening and cheminformatics resource database. Nucleic Acids Res. 2008;36:D351–359. doi: 10.1093/nar/gkm843. [DOI] [PMC free article] [PubMed] [Google Scholar]
- 40.Haggarty SJ, Clemons PA, Schreiber SL. Chemical genomic profiling of biological networks using graph theory and combinations of small molecule perturbations. J Am Chem Soc. 2003;125:10543–10545. doi: 10.1021/ja035413p. [DOI] [PubMed] [Google Scholar]
- ●● 41.Parsons AB, Brost RL, Ding H, Li Z, Zhang C, Sheikh B, Brown GW, Kane PM, Hughes TR, Boone C. Integration of chemical-genetic and genetic interaction data links bioactive compounds to cellular target pathways. Nat Biotechnol. 2004;22:62–69. doi: 10.1038/nbt919. This study involved testing twelve compounds against a yeast deletion set of ~4,700 mutants to identify hypersensitive mutants by scoring colony formation. Hypersensitivity of particular deletion mutants to a semi-inhibitory compound concentration indicates a chemical-genetic interaction between the gene and compound. This study was one of the first to take a genome-wide approach to tackle the question of target identification. [DOI] [PubMed] [Google Scholar]
- 42.Hoon S, Smith AM, Wallace IM, Suresh S, Miranda M, Fung E, Proctor M, Shokat KM, Zhang C, Davis RW, et al. An integrated platform of genomic assays reveals small-molecule bioactivities. Nat Chem Biol. 2008;4:498–506. doi: 10.1038/nchembio.100. [DOI] [PubMed] [Google Scholar]
- 43.Yan Z, Costanzo M, Heisler LE, Paw J, Kaper F, Andrews BJ, Boone C, Giaever G, Nislow C. Yeast Barcoders: a chemogenomic application of a universal donor-strain collection carrying bar-code identifiers. Nat Methods. 2008;5:719–725. doi: 10.1038/nmeth.1231. [DOI] [PubMed] [Google Scholar]
- 44.Ho CH, Magtanong L, Barker SL, Gresham D, Nishimura S, Natarajan P, Koh JL, Porter J, Gray CA, Andersen RJ, et al. A molecular barcoded yeast ORF library enables mode-of-action analysis of bioactive compounds. Nat Biotechnol. 2009;27:369–377. doi: 10.1038/nbt.1534. [DOI] [PMC free article] [PubMed] [Google Scholar]
- 45.Pierce SE, Fung EL, Jaramillo DF, Chu AM, Davis RW, Nislow C, Giaever G. A unique and universal molecular barcode array. Nat Methods. 2006;3:601–603. doi: 10.1038/nmeth905. [DOI] [PubMed] [Google Scholar]
- 46.Root DE, Hacohen N, Hahn WC, Lander ES, Sabatini DM. Genome-scale loss-of-function screening with a lentiviral RNAi library. Nat Methods. 2006;3:715–719. doi: 10.1038/nmeth924. [DOI] [PubMed] [Google Scholar]
- 47.Wang J, Zhou X, Bradley PL, Chang SF, Perrimon N, Wong ST. Cellular phenotype recognition for high-content RNA interference genome-wide screening. J Biomol Screen. 2008;13:29–39. doi: 10.1177/1087057107311223. [DOI] [PubMed] [Google Scholar]
- 48.Eggert US, Kiger AA, Richter C, Perlman ZE, Perrimon N, Mitchison TJ, Field CM. Parallel chemical genetic and genome-wide RNAi screens identify cytokinesis inhibitors and targets. PLoS Biol. 2004;2:e379. doi: 10.1371/journal.pbio.0020379. [DOI] [PMC free article] [PubMed] [Google Scholar]
- ● 49.Kauvar LM, Higgins DL, Villar HO, Sportsman JR, Engqvist-Goldstein A, Bukar R, Bauer KE, Dilley H, Rocke DM. Predicting ligand binding to proteins by affinity fingerprinting. Chem Biol. 1995;2:107–118. doi: 10.1016/1074-5521(95)90283-x. This seminal work to establish “affinity fingerprinting” by protein-binding studies represents one of the earliest attempts to characterize small-molecule performance across multiple assays, and to use this information to make predictions about the performance of new compounds. [DOI] [PubMed] [Google Scholar]
- 50.Fliri AF, Loging WT, Thadeio PF, Volkmann RA. Analysis of drug-induced effect patterns to link structure and side effects of medicines. Nat Chem Biol. 2005;1:389–397. doi: 10.1038/nchembio747. [DOI] [PubMed] [Google Scholar]
- 51.Fliri AF, Loging WT, Thadeio PF, Volkmann RA. Biological spectra analysis: Linking biological activity profiles to molecular structure. Proc Natl Acad Sci U S A. 2005;102:261–266. doi: 10.1073/pnas.0407790101. [DOI] [PMC free article] [PubMed] [Google Scholar]
- 52.Fliri AF, Loging WT, Thadeio PF, Volkmann RA. Biospectra analysis: model proteome characterizations for linking molecular structure and biological response. J Med Chem. 2005;48:6918–6925. doi: 10.1021/jm050494g. [DOI] [PubMed] [Google Scholar]
- 53.MacBeath G, Koehler AN, Schreiber SL. Printing small molecules as microarrays and detecting protein-ligand interactions en masse. J Am Chem Soc. 1999;121:7967–7968. [Google Scholar]
- 54.Vegas AJ, Fuller JH, Koehler AN. Small-molecule microarrays as tools in ligand discovery. Chem Soc Rev. 2008;37:1385–1394. doi: 10.1039/b703568n. [DOI] [PMC free article] [PubMed] [Google Scholar]
- 55.Bader GD, Donaldson I, Wolting C, Ouellette BF, Pawson T, Hogue CW. BIND--The Biomolecular Interaction Network Database. Nucleic Acids Res. 2001;29:242–245. doi: 10.1093/nar/29.1.242. [DOI] [PMC free article] [PubMed] [Google Scholar]
- 56.Kuhn M, von Mering C, Campillos M, Jensen LJ, Bork P. STITCH: interaction networks of chemicals and proteins. Nucleic Acids Res. 2008;36:D684–688. doi: 10.1093/nar/gkm795. [DOI] [PMC free article] [PubMed] [Google Scholar]
- 57.Reddy AS, Amarnath HS, Bapi RS, Sastry GM, Sastry GN. Protein ligand interaction database (PLID) Comput Biol Chem. 2008;32:387–390. doi: 10.1016/j.compbiolchem.2008.03.017. [DOI] [PubMed] [Google Scholar]
- 58.Duffner JL, Clemons PA, Koehler AN. A pipeline for ligand discovery using small-molecule microarrays. Curr Opin Chem Biol. 2007;11:74–82. doi: 10.1016/j.cbpa.2006.11.031. [DOI] [PubMed] [Google Scholar]
- 59.Singh N, Guha R, Giulianotti MA, Pinilla C, Houghten RA, Medina-Franco JL. Chemoinformatic analysis of combinatorial libraries, drugs, natural products, and molecular libraries small molecule repository. J Chem Inf Model. 2009;49:1010–1024. doi: 10.1021/ci800426u. [DOI] [PMC free article] [PubMed] [Google Scholar]
- 60.Muchmore SW, Debe DA, Metz JT, Brown SP, Martin YC, Hajduk PJ. Application of belief theory to similarity data fusion for use in analog searching and lead hopping. J Chem Inf Model. 2008;48:941–948. doi: 10.1021/ci7004498. [DOI] [PubMed] [Google Scholar]
- 61.Schreiber SL. Target-oriented and diversity-oriented organic synthesis in drug discovery. Science. 2000;287:1964–1969. doi: 10.1126/science.287.5460.1964. [DOI] [PubMed] [Google Scholar]
- ● 62.Kim YK, Arai MA, Arai T, Lamenzo JO, Dean EF, 3rd, Patterson N, Clemons PA, Schreiber SL. Relationship of stereochemical and skeletal diversity of small molecules to cellular measurement space. J Am Chem Soc. 2004;126:14740–14745. doi: 10.1021/ja048170p. This study assessed the effects of stereochemistry and ring closure on phenotypic profiles, using one cell line, four phenotypic readouts, and a set of 17 known bioactive small-molecule modulators. This result demonstrated the ability to use phenotypic profiling to learn about the consequences of synthetic decisions on patterns of biological activity. [DOI] [PubMed] [Google Scholar]
- 63.Feng BY, Shelat A, Doman TN, Guy RK, Shoichet BK. High-throughput assays for promiscuous inhibitors. Nat Chem Biol. 2005;1:146–148. doi: 10.1038/nchembio718. [DOI] [PubMed] [Google Scholar]
- 64.Chen JK, Lane WS, Brauer AW, Tanaka A, Schreiber SL. Biased combinatorial libraries: novel ligands for the SH3 domain of phosphatidylinositol 3-kinase. J Am Chem Soc. 1993;115:12591–12592. [Google Scholar]
- 65.Wong JC, Hong R, Schreiber SL. Structural biasing elements for in-cell histone deacetylase paralog selectivity. J Am Chem Soc. 2003;125:5586–5587. doi: 10.1021/ja0341440. [DOI] [PubMed] [Google Scholar]