Abstract
The aim of the present study was to use 13C NMR to measure the cerebral oxidative metabolic rate of glucose (CMRglc(ox)) in patients with diabetes and to compare these measurements with those collected from matched controls. We elected to study a group with type 1 diabetes and hypoglycemia unawareness, since we had previously found such patients to have higher brain glucose concentrations than normal volunteers under steady state conditions. We sought to determine if this difference in steady-state brain concentrations could be explained by a difference in CMRglc(ox). Time courses of 13C label incorporation in brain amino acids were measured in occipital cortex during infusion of [1-13C]glucose. These time courses were fitted using a one-compartment metabolic model to determine CMRglc(ox). Our results show that the TCA cycle rate (VTCA, which is twice CMRglc(ox)) in subjects with type 1 diabetes was not significantly different from normal controls (0.84 ± 0.03 vs 0.79 ± 0.03 μmol/gm/min, n=5 in each group, mean ± SEM). We conclude that the changes in steady-state brain glucose concentrations that we observed in patients with type 1 diabetes in a previous study (1) cannot be explained by changes in oxidative glucose consumption
Diabetes mellitus is a devastating disease that affects the metabolism, structure, and function of many organs. It has been long recognized that diabetes has effects on the kidneys, eyes, peripheral nerves and vasculature, and there is a growing body of evidence that diabetes affects the brain as well (2) Patients with diabetes have an increased incidence of cognitive dysfunction and dementia (3–5), and have been found to have abnormalities in white matter structure and function (6, 7) as well as reductions in gray matter volumes and densities (8, 9). Such functional and structural abnormalities presumably result from the extremes in glycemia experienced by patients with the disease. However, the extent to which these functional and structural abnormalities are associated with or caused by alterations in glucose metabolism is uncertain. To better understand these metabolic effects, dynamic studies of the kinetics of in vivo cerebral glucose metabolism may provide new insights into how brain metabolism is altered in diabetes.
The human brain depends on the delivery of glucose from the blood to meet its metabolic needs. Glucose uptake across the blood brain barrier is dependent on the activity of GLUT 1 and under steady state conditions the rate of glucose uptake is balanced by the rate at which glucose is metabolized. Methods to assess in vivo cerebral glucose metabolism in humans have included positron emission tomography (PET) and proton nuclear magnetic resonance spectroscopy (NMR). Both methods have contributed to our understanding of cerebral glucose metabolism, but both suffer from limitations that make it difficult to assess dynamic differences between groups of subjects with different levels of glycemia. With PET, calculation of the rates of glucose metabolism requires the use of the lump constant, which is known to vary depending on glycemia, although changes in the lumped constant are relatively small in hyperglycemia (10). With proton NMR, glucose transport parameters and CMRglc have been determined using steady-state measurements of brain glucose concentration at different levels of glycemia. This method, however, does not allow independent determination of the cerebral metabolic rate of glucose (CMRglc). In contrast, 13C-NMR allows non-invasive determination of metabolic rates in vivo. With this method, 13C glucose is administered and the incorporation of 13C label from glucose to glutamate is monitored by changes in NMR spectra. These time course of 13C label incorporation from glucose to glutamate can then be used to calculate CMRglc(ox). However, this method has not yet been applied to the study of cerebral glucose metabolism in humans with diabetes.
The aim of the present study was to use 13C NMR to measure CMRglc(ox) in patients with diabetes and to compare these measurements with those collected from matched controls. We elected to study a group with type 1 diabetes and hypoglycemia unawareness, since we had previously found such patients to have higher brain glucose concentrations than normal volunteers under steady state conditions (1). Using 13C MRS, we sought to determine if this difference in steady-state brain concentrations could be explained by a difference in CMRglc(ox).
MATERIALS AND METHODS
Subjects
All studies were performed following procedures approved by the Institutional Review Board at the University of Minnesota. Subjects with type I diabetes and hypoglycemia unawareness were recruited from the Endocrine Clinics at the University of Minnesota as described previously (1). A clinical diagnosis was accepted, which required treatment with insulin since the year of diagnosis, and a history of diabetic ketoacidosis or onset in childhood. In addition, the subjects were receiving care for diabetes labeled as type 1 by their treating physician.
Briefly, these subjects were included if they satisfied the following criteria: 1) hemoglobin A1c < 7.5%, 2) two self-reported episodes of hypoglycemia per week and 3) hypoglycemia unawareness as assessed by the questionnaire developed by Clarke et al. (11). Self reported hypoglycemia was defined as episodes when blood glucose was measured by the subject and found to be < 70 mg/dl. The Clarke survey consists of 8 questions about hypoglycemia frequency and symptoms. Subjects who indicate frequent hypoglycemia (BG < 70mg/dl) without symptoms (four or more R responses on the survey) are said to have reduced awareness of hypoglycemia. All of the subjects with type 1 diabetes in this study scored four or more R responses.
Control subjects were recruited from local communities around the University. The mean weight of subjects was 68 ± 9 kg (mean ± SD; n = 5) for the control group and 87 ± 13 kg (n=5) for the diabetes group. The mean age was 35 ± 11 years for the control group and 44 ± 4 years for the diabetes group.
Experimental protocol
Subjects with type I diabetes were admitted to the General Clinical Research Center at the University of Minnesota the night before the experiment. They were taken off their long-acting insulin medication and infused with insulin during the night to maintain their blood glucose levels between 100–180 mg/dl. Normal controls were asked to arrive fasted in the morning.
All subjects were studied at the Center for Magnetic Resonance Research in the morning. Venous catheters were placed in the both antecubital veins for infusion of insulin, somatostatin and glucose. A third venous catheter was placed antegrade in one foot vein for blood sampling, using warm water pads to arterialize the blood (12). Somatostatin (0.16 mg/kg/min) and insulin (0.5 mU/kg/min) were infused continuously throughout the study. Unlabeled glucose was infused and the infusion rate was adjusted to maintain glucose levels at euglycemia.
After adjustment of spectroscopic parameters, unlabeled glucose infusion was discontinued and a 25g bolus of [1-13C]glucose (99% enriched, 50% weight/vol) was administered over 2–3 minutes in the right antecubital vein, immediately followed by a continuous [1-13C]glucose infusion (70% enriched, 20% weight/vol). The initial rate of glucose continuous infusion was 4 mg/kg/min, and was adjusted later if necessary to keep plasma glucose around 200 mg/dl. Figure 1 presents the time course of the protocol.
Figure 1. Experimental protocol.
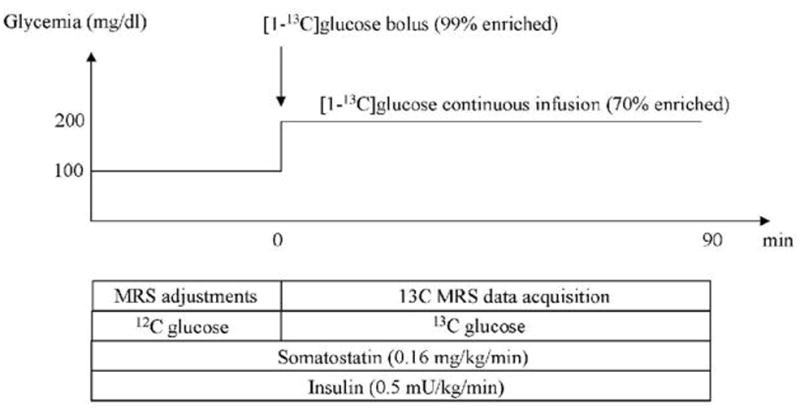
Glucose-clamp experiments were performed using somatostatin and insulin infusion. Prior to the infusion of 13C-labeled glucose, the glucose concentration was kept at euglycemia with unlabeled 12C-glucose, and NMR adjustments were performed. At t = 0, a bolus of 25g of 100%-enriched 20% w/v [1-13C]glucose solution was administered. Glucose concentration was then clamped at 200 mg/dl for the duration of the experiment using continuous infusion of 70%-enriched [1-13C]glucose. Glycemia was measured every 5 minutes and the rate of glucose infusion was adjusted to keep glycemia at the target value.
NMR spectroscopy
All experiments were performed on a 4 Tesla/90cm bore magnet interfaced to a Varian Inova console. Whole body gradients (Siemens Sonata) were capable of reaching 40 mT/m in 400 microseconds. The RF coil assembly consisted in a 13C surface coil (9 cm diameter) for 13C detection and a quadrature 1H coil for 1H localization and 1H decoupling. Inversion-recovery turboflash T1 images were obtained to select the volume of interest. A 5×3×3 cm3 (45 ml) volume was chosen for spectroscopy in the visual cortex. Homogeneity of the B0 magnetic field was optimized using FAST(EST)MAP (13) resulting in a 9–10 Hz water linewidth in the localized volume. 1H-localized 13C spectra were recorded using a semi-adiabatic Distortionless Enhancement by Polarization Transfer sequence (DEPT) sequence (14–16). The 13C part of DEPT consisted in a segmented BIR-4 pulse with a total duration of 4 ms. The 1H part of DEPT was formed of three square pulses with a duration of 250 μs (90 degree), 500 μs (180 degree) and 125 μs (45 degree) respectively. Localization was achieved prior to DEPT using Image-Selected In Vivo Spectroscopy (ISIS) (sech/tanh pulses, 4ms duration, 4 kHz bandwidth). Each fid was collected with 3,000 complex points and a spectral width of 20 kHz resulting in an acquisition time of 150 ms. 1H decoupling was applied during the acquisition time using WALTZ-16 with a power of 30W at the coil port. The available γB1 in the voxel was approximately 3 kHz for 13C (DEPT), 1 kHz for 1H (ISIS and DEPT), and 500 Hz for 1H decoupling. The frequency carrier was placed at 44 ppm for 13C and 2.7 ppm for 1H. Power calibrations were performed in each subject prior to 13C infusion using the signal from 13C-formate in a small sphere placed at the center of the 13Ccoil. Data were collected in blocks of 128 scans with TR = 3s (total scan time 6.4 min per block) for 80 to 90 min depending on subjects.
LCModel analysis
Spectra were analyzed with LCModel v6.0 (Provencher Inc, Ontario) (17) using a simulated basis set based on published chemical shift and J-coupling values (18). The basis set consisted of 32 signals corresponding to multiplet signals from all isotopomers observed in the measured 13Cspectra (see (18) for the nomenclature): Glutamate C4S, C4D43, C3S, C3D, C3T, C2S, C2D23; Glutamine C4S, C4D43, C3S, C3D, C2S, C2D23; Aspartate C2S, C2D23, C3S, C3D32; Alanine C3S; N-Acetylaspartate C6S, C3S, C3D32, C2S, C2D23; GABA C4S, C2S; Glucose C1α, C1β, C6α, C6β, MyoIns, GSH C4 and Lactate C3. Other signals were not detectable and therefore were not included in the basis set. Time series of 13C were analyzed automatically to yield time courses for each isotopomer. For metabolic modeling the total glutamate C4 and total glutamate C3 were determined as tGluC4 = GLuC4S + GluC4D43 and tGluC3 = GluC3S + GluC3D + GluC3T. Concentrations obtained from LCModel (in arbitrary units) were converted into actual 13C concentrations by assuming a glutamate concentration of 10 mM and an estimated 20% isotopic enrichment (corresponding to 2.0 mM 13C concentration) for total glutamate C4 at isotopic steady-state. In other words, this scaling was done so that the measured glutamate C4 turnover curve reaches 2.0 mM at isotopic steady state (taken as the average of the last 3 points of the tGluC4 turnover curve to minimize the influence of noise). Any change in scaling will result in a change in the lactate dilution flux VDIL, but has little impact on other fluxes, provided glutamate C4 and glutamate C3 curves are scaled consistently with one another. For each subject, all data points of the glutamate C4 and glutamate C3 curves were multiplied by the same scaling factor. An additional 10% scaling factor was subsequently applied to the glutamate C3 curve to account for reduced detection efficiency due to off-resonance effects, as determined on phantom.
Metabolic modeling
Time courses of incorporation of 13C label into glutamate C4 and C3 were analyzed with the one compartment metabolic model shown in Figure 2 using SAAM II software (University of Washington, WA). This model is similar to one-compartment models used in previous studies (19) and accounts for the formation of 13C-labeled glutamate at the C4 and C3 position from [1-13C]glucose. Since glutamate is located primarily in neurons, this model reflects primarily neuronal metabolism. Unknown (free) parameters include: VTCA (Neuronal TCA cycle), VX (exchange rate between 2-oxoglutrate and glutamate) and VOUT (dilution of labeled 13C-lactate through exchange with unlabeled lactate). A fourth dilution flux (VEFF) was added to account for loss of 13C-labeled glutamine through exchange with unlabeled glutamine. This is necessary because the isotopic enrichment of glutamate C3 remains much lower than the isotopic enrichment of glutamate C4 even at isotopic steady-state, indicating loss of label between the first turn and the second turn of the TCA cycle (20). Some (but not all) of the label loss can be accounted for by pyruvate carboxylase activity. The following concentrations were assumed in the model (21): [Glu]=10 mM, [Gln]=2.5 mM, [OAA]= 1 mM, [Lac]= 1 Mm. Finally the following fluxes where assumed in the model based on previous studies (21): VGLN = 0.41 * VTCA, where VGLN is the rate of glutamine synthesis, and VGLY = 0.5 * VTCA, where VGLY is the rate of glycolysis, accounting for the fact that one molecule of glucose gives two molecules of lactate.
Figure 2. Metabolic model.
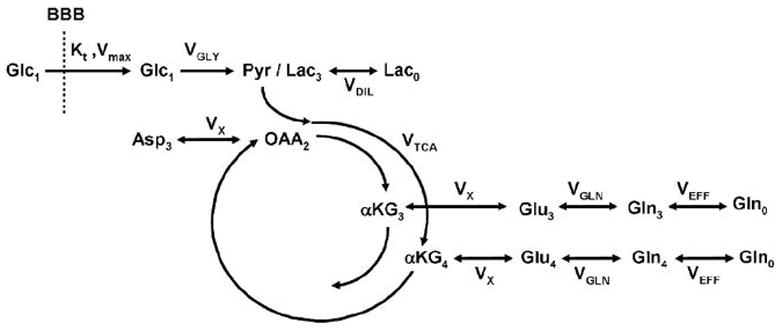
One-compartment metabolic model used to analyze 13C turnover curves and determine the rate of TCA cycle. The model described the flow of 13C label from glucose C1 to glutamate C4 and C3. Loss of label occurs by dilution through exchange with unlabeled lactate and glutamine (Lac0 and Gln0 respectively). Parameters VTCA, VX, VDIL and VEFF were left as free parameters in the fit. Other fluxes were assumed: VGLY = 0.5 × VTCA and VGLN = 0.41 × VTCA.
RESULTS
The time courses of blood glucose concentration and isotopic enrichment were similar in the control group and the diabetes groups (Figure 3). Blood glucose concentration increased from ~100 mg/dl before the bolus of 13C-labeled glucose to ~350 mg/dl immediately after the bolus. Blood glucose concentration was then maintained around 200–250 mg/dl in both groups. Plasma glucose isotopic enrichment reached 70–80% immediately after the bolus then stabilized at approximately 60–65% for the duration of the study. Isotopic enrichment was slightly lower in the control group compared to the diabetes group. Figure 4 shows a time series of 13C spectra collected from a 4 ml volume in the occipital cortex of a control subject following injection of [1-13C]glucose. Incorporation of 13C label into brain amino acids is evidenced from the progressive signal increase corresponding to glutamate C4 and C3, C2, glutamine C4, C3, C2 and Aspartate C3 and C2 resonances. The C4 of glutamate labeled more rapidly than C3 and C2, consistent with C3 and C2 being labeled after one more turn in the TCA cycle. These time series of spectra were quantified automatically using LCModel. Figure 5 shows LCModel analysis of a spectrum with high signal-to-noise ratio (average of all five control subjects and last three time points of time courses, corresponding to 92 min total scan time). Excellent localization performance is confirmed by the absence of natural abundance lipid signal from the scalp.
Figure 3. Plasma glucose concentration and isotopic enrichment.
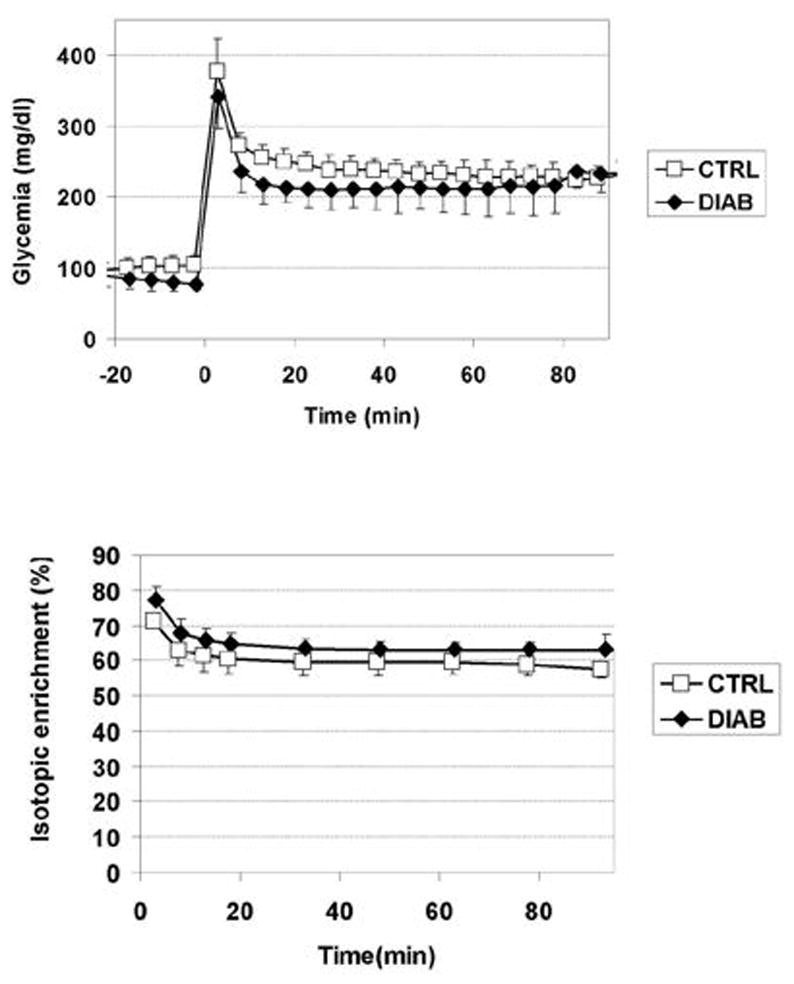
Measured blood glucose concentration (top) and isotopic enrichment (bottom) in the control group (empty squares) and in type 1 diabetes group (filled diamonds). The 13C-glucose infusion was started at t =0.
Figure 4. Example of time course measured in one healthy volunteer.
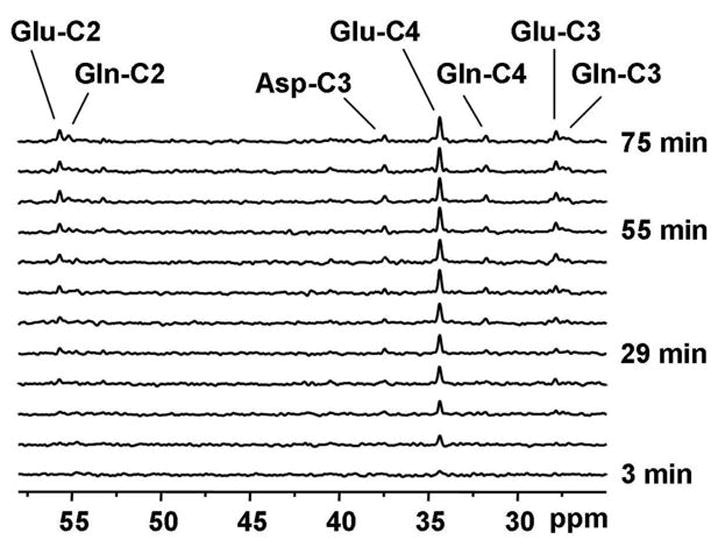
Representative time course of 13Clabel incorporation into brain amino acids during infusion of [1-13C]glucose in a single control subject (5 × 3 × 5 cm3 volume) with a temporal resolution of ~6min. Resonances were observed for glutamate C4, C3, C2, glutamine C4, C3, C2 and aspartate.
Figure 5. LCModel analysis of 13Cspectrum.
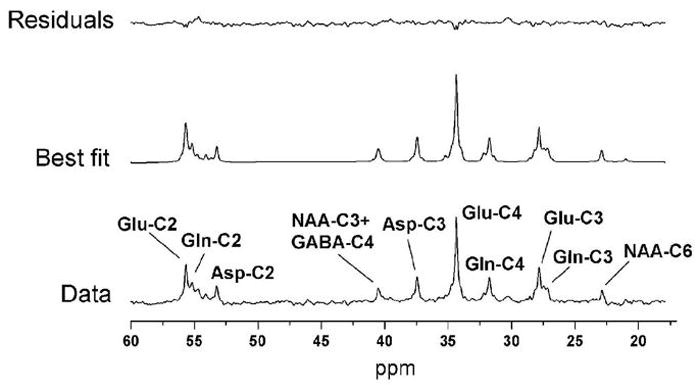
Example of spectral analysis of 13Cspectrum in human brain using LCModel with experimental data (bottom), best fit (middle) and fit residuals (top). The basis set for LCModel consisted of 32 basis spectra (see methods for details). The spectrum corresponds to the last 18 min of acquisition (3 • 128scans) in a single subject and is displayed with 5 Hz line broadening.
Time courses of incorporation of 13C label from [1-13C]glucose into glutamate C4 and C3 appeared similar in normal volunteers and in diabetic patients (Figure 6). Time courses of 13C label incorporation onto glutamate C4 and C3 were fitted with a one compartment metabolic model (Figure 2) to determine the TCA cycle rate VTCA as well three other fluxes: VX, VOUT, and VEFF. The resulting metabolic fluxes are shown in Table 1. No significance difference was found between the two groups.
Figure 6. Glutamate C4 and C3 time courses and fits.
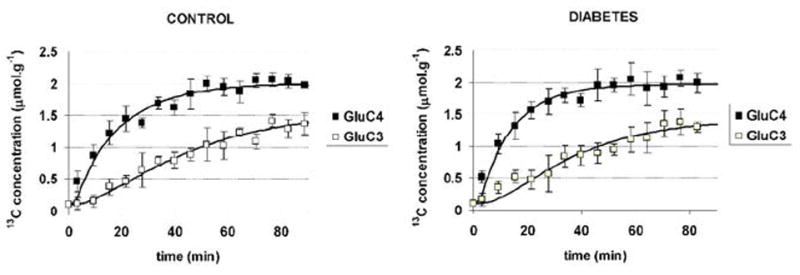
Experimental data for glutamate C4 (filled squares) and glutamate C3 (open squares) in control subjects (left) and in subjects with type 1 diabetes (right). Time courses of 13C label incorporation were very similar in both groups. Best fits of the metabolic model to the data are shown as continuous lines. Values of metabolic rates VTCA and VX corresponding to the best fits are given in Table 1.
Table 1.
Values of metabolic fluxes corresponding to best fits of 13C NMR data (in μmol/gm.min)
| CONTROL | DIABETES | CONTROL vs DIABETES | |||
|---|---|---|---|---|---|
| Mean | SEM (n=5) | Mean | SEM (n=5) | p value (2-tailed unpaired t- test) | |
| VTCA | 0.79 | 0.03 | 0.84 | 0.03 | 0.15 |
| VX | 1.32 | 0.33 | 2.31 | 0.78 | 0.44 |
| VDIL | 0.21 | 0.06 | 0.29 | 0.06 | 0.38 |
| VEFF | 0.18 | 0.06 | 0.31 | 0.09 | 0.28 |
DISCUSSION
We report here the first measurement of CMRglc(ox) in diabetic patients using 13C NMR spectroscopy. The results show that CMRglc(ox), which is equal to half VTCA, is the same in patients with type 1 diabetes as it is in normal controls. These results confirm the findings of previous studies done using PET and suggest that the limitations associated with the use of a lump constant that is known to change under different conditions of glycemia may not have much of an impact on the measurement glucose metabolism in patients with diabetes. One advantage of 13C NMR is that it does not expose humans to radioactivity.
The subjects with diabetes included in this study all had hypoglycemia unawareness, a dangerous clinical syndrome in which patients do not develop symptoms of low blood sugar until they develop neuroglycopenia. Why patients with diabetes and recurrent hypoglycemia develop hypoglycemia unawareness is far from clear. One mechanism that has been studied extensively is that recurrent hypoglycemia might increase glucose transport across the blood brain barrier, creating a situation in which the brain has an adequate amount of glucose for its energy needs despite a reduction in glucose content in the blood. The data reported in this manuscript provide some support for this hypothesis of upregulated glucose transport. If, as the current data suggest, CMRglc(ox) is the same in subjects with type 1 diabetes and hypoglycemia unawareness as it is in controls, then the 17% increase in steady state brain glucose concentration from 4.7 mM to 5.5 mM found by Criego et al (1) cannot be explained by changes in CMRglc(ox), suggesting that glucose transport in these subjects is upregulated. The alternative explanation for increased steady-state brain glucose concentration would be down-regulated CMRglc. Since we show here that CMRglc(ox) is unchanged, this would imply down-regulation of non-oxidative CMRglc. However non-oxidative glucose consumption represents only a small fraction of glucose consumption in the brain, so that a down-regulation of non-oxidative glucose consumption sufficient to explain the increase in steady-state brain glucose concentration in the Criego et al. study is unlikely.
In our analysis, metabolic modeling was performed with a one-compartment model similar to previous studies (19, 22, 23). However, the current model has been adjusted to include a dilution flux for glutamine. This is justified by the fact that the enrichment of glutamate C3 remains significantly lower (about 20% lower) than the isotopic enrichment of glutamate C4, even at isotopic steady-state (20). Such a dilution of glutamate C3 compared to glutamate C4 is too large to be explained solely by pyruvate carboxylase flux. Therefore another source of dilution must be included in the model. This is also consistent with the observation that glutamine C4 enrichment remains lower than glutamate C4 enrichment at isotopic steady-state (24). The most likely source of this dilution is the exchange of labeled glutamine with unlabeled glutamine coming from the blood. Contrary to glutamate, brain glutamine readily crosses the blood brain barrier and therefore is in exchange with the blood glutamine pool. More complex two-compartment models have been proposed to measure compartmentalized neuronal-glial metabolism (21, 25–28). Fitting both glutamate and glutamine labeling curves has been proposed to measure the rate of glutamate-glutamine cycle between neurons and astrocytes. However more recent work has shown that the determination of this glutamate-glutamine cycle flux is not very precise when using [1-13C]glucose (or [1,6-13C2]glucose as a substrate (29). Therefore we chose to restrict our metabolic modeling to a one-compartment model.
In our experiments, we studied subjects during modest hyperglycemia and it is possible that a difference in VTCA could have been detected between the two groups if subjects had been studied under hypoglycemic conditions. However, Bischof and colleagues observed phosphocreatine : γ-ATP ratios to be the same under both euglycemia and hypoglycemia in patients with type 1 diabetes and in controls (30), suggesting that brain energy metabolism is not altered during hypoglycemia. Patients with type 1 diabetes have been found to have increased rates of acetate uptake during hypoglycemia when compared to controls (31), so it is possible that an upregulation of monocarboxylic acid transport rather than an upregulation of glucose transport could support brain energy metabolism during hypoglycemia in patients well controlled diabetes. Future experiments in which both glucose and acetate uptake are assessed will be necessary to determine the relative role of these substrates in the pathogenesis of hypoglycemia unawareness.
In conclusion, we used 13C-NMR and metabolic modeling to measure oxidative glucose metabolism in patients with type 1 diabetes and hypoglycemia unawareness and normal controls. We observed that VTCA was the same in both groups. If these data can be used to interpret our earlier study in which steady state brain glucose concentrations were found to be higher in unaware subjects with type 1 diabetes than controls, the current data also support the hypothesis that increased glucose transport across the blood brain barrier may be one mechanism through which subjects with type 1 diabetes and recurrent hypoglycemia develop hypoglycemia unawareness.
Acknowledgments
This work was supported by RO1NS38672 (PGH), RO1NS35192 (ERS), RO1DK62440 (ERS), P30NS057091, P41RR08679, and 5 MO1 RR0400.
Footnotes
Potential conflicts of interest: none
Institutional approvals : This work was approved by the University of Minnesota Institutional Review Board : Human Subjects Committee
Publisher's Disclaimer: This is a PDF file of an unedited manuscript that has been accepted for publication. As a service to our customers we are providing this early version of the manuscript. The manuscript will undergo copyediting, typesetting, and review of the resulting proof before it is published in its final citable form. Please note that during the production process errors may be discovered which could affect the content, and all legal disclaimers that apply to the journal pertain.
References
- 1.Criego A, Kumar A, Tran N, Tkac I, Gruetter R, Seaquist ER. Journal of Neuroscience Research. 2005;79:42–47. doi: 10.1002/jnr.20296. [DOI] [PubMed] [Google Scholar]
- 2.Kodl CT, Seaquist ER. Endocr Rev. 2008;29:494–511. doi: 10.1210/er.2007-0034. [DOI] [PMC free article] [PubMed] [Google Scholar]
- 3.Brands AM, Biessels GJ, de Haan EH, Kappelle LJ, Kessels RP. Diabetes Care. 2005;28:726–35. doi: 10.2337/diacare.28.3.726. [DOI] [PubMed] [Google Scholar]
- 4.Leibson CL, Rocca WA, Hanson VA, Cha R, Kokmen E, O’Brien PC, Palumbo PJ. Am J Epidemiol. 1997;145:301–8. doi: 10.1093/oxfordjournals.aje.a009106. [DOI] [PubMed] [Google Scholar]
- 5.Ott A, Stolk RP, Hofman A, van Harskamp F, Grobbee DE, Breteler MM. Diabetologia. 1996;39:1392–7. doi: 10.1007/s001250050588. [DOI] [PubMed] [Google Scholar]
- 6.Kodl CT, Franc DT, Rao JP, Anderson FS, Thomas W, Mueller BA, Lim KO, Seaquist ER. Diabetes. 2008;57:3083–9. doi: 10.2337/db08-0724. [DOI] [PMC free article] [PubMed] [Google Scholar]
- 7.Manschot SM, Brands AM, van der Grond J, Kessels RP, Algra A, Kappelle LJ, Biessels GJ. Diabetes. 2006;55:1106–13. doi: 10.2337/diabetes.55.04.06.db05-1323. [DOI] [PubMed] [Google Scholar]
- 8.Musen G, Lyoo IK, Sparks CR, Weinger K, Hwang J, Ryan CM, Jimerson DC, Hennen J, Renshaw PF, Jacobson AM. Diabetes. 2006;55:326–33. doi: 10.2337/diabetes.55.02.06.db05-0520. [DOI] [PubMed] [Google Scholar]
- 9.Wessels AM, Simsek S, Remijnse PL, Veltman DJ, Biessels GJ, Barkhof F, Scheltens P, Snoek FJ, Heine RJ, Rombouts SA. Diabetologia. 2006;49:2474–80. doi: 10.1007/s00125-006-0283-7. [DOI] [PubMed] [Google Scholar]
- 10.Schuier F, Orzi F, Suda S, Lucignani G, Kennedy C, Sokoloff L. J Cereb Blood Flow Metab. 1990;10:765–73. doi: 10.1038/jcbfm.1990.134. [DOI] [PubMed] [Google Scholar]
- 11.Clarke WL, Cox DJ, Gonder-Frederick LA, Julian D, Schlundt D, Polonsky W. Diabetes Care. 1995;18:517–22. doi: 10.2337/diacare.18.4.517. [DOI] [PubMed] [Google Scholar]
- 12.Seaquist ER. Metabolism. 1997;46:1364–6. doi: 10.1016/s0026-0495(97)90245-6. [DOI] [PubMed] [Google Scholar]
- 13.Gruetter R, Tkac I. Magn Reson Med. 2000;43:319–23. doi: 10.1002/(sici)1522-2594(200002)43:2<319::aid-mrm22>3.0.co;2-1. [DOI] [PubMed] [Google Scholar]
- 14.Gruetter R, Adriany G, Merkle H, Andersen PM. Magn Reson Med. 1996;36:659–64. doi: 10.1002/mrm.1910360503. [DOI] [PubMed] [Google Scholar]
- 15.Gruetter R, Seaquist ER, Kim S, Ugurbil K. Dev Neurosci. 1998;20:380–8. doi: 10.1159/000017334. [DOI] [PubMed] [Google Scholar]
- 16.Henry PG, Tkac I, Gruetter R. Magn Reson Med. 2003;50:684–92. doi: 10.1002/mrm.10601. [DOI] [PubMed] [Google Scholar]
- 17.Provencher SW. Magn Reson Med. 1993;30:672–9. doi: 10.1002/mrm.1910300604. [DOI] [PubMed] [Google Scholar]
- 18.Henry PG, Oz G, Provencher S, Gruetter R. NMR Biomed. 2003;16:400–12. doi: 10.1002/nbm.840. [DOI] [PubMed] [Google Scholar]
- 19.Henry PG, Lebon V, Vaufrey F, Brouillet E, Hantraye P, Bloch G. J Neurochem. 2002;82:857–66. doi: 10.1046/j.1471-4159.2002.01006.x. [DOI] [PubMed] [Google Scholar]
- 20.Henry PG, Crawford S, Oz G, Ugurbil K, Gruetter R. Proc Intl Soc Mag Reson Med, 1967 2003 [Google Scholar]
- 21.Gruetter R, Seaquist ER, Ugurbil K. Am J Physiol Endocrinol Metab. 2001;281:E100–12. doi: 10.1152/ajpendo.2001.281.1.E100. [DOI] [PubMed] [Google Scholar]
- 22.Mason GF, Gruetter R, Rothman DL, Behar KL, Shulman RG, Novotny EJ. J Cereb Blood Flow Metab. 1995;15:12–25. doi: 10.1038/jcbfm.1995.2. [DOI] [PubMed] [Google Scholar]
- 23.Mason GF, Rothman DL, Behar KL, Shulman RG. J Cereb Blood Flow Metab. 1992;12:434–47. doi: 10.1038/jcbfm.1992.61. [DOI] [PubMed] [Google Scholar]
- 24.Oz G, Berkich DA, Henry PG, Xu Y, LaNoue K, Hutson SM, Gruetter R. J Neurosci. 2004;24:11273–9. doi: 10.1523/JNEUROSCI.3564-04.2004. [DOI] [PMC free article] [PubMed] [Google Scholar]
- 25.Hyder F, Patel AB, Gjedde A, Rothman DL, Behar KL, Shulman RG. J Cereb Blood Flow Metab. 2006;26:865–77. doi: 10.1038/sj.jcbfm.9600263. [DOI] [PubMed] [Google Scholar]
- 26.Shen J, Petersen KF, Behar KL, Brown P, Nixon TW, Mason GF, Petroff OA, Shulman GI, Shulman RG, Rothman DL. Proc Natl Acad Sci U S A. 1999;96:8235–40. doi: 10.1073/pnas.96.14.8235. [DOI] [PMC free article] [PubMed] [Google Scholar]
- 27.Sibson NR, Dhankhar A, Mason GF, Behar KL, Rothman DL, Shulman RG. Proc Natl Acad Sci U S A. 1997;94:2699–704. doi: 10.1073/pnas.94.6.2699. [DOI] [PMC free article] [PubMed] [Google Scholar]
- 28.Sibson NR, Dhankhar A, Mason GF, Rothman DL, Behar KL, Shulman RG. Proc Natl Acad Sci U S A. 1998;95:316–21. doi: 10.1073/pnas.95.1.316. [DOI] [PMC free article] [PubMed] [Google Scholar]
- 29.Shestov AA, Valette J, Ugurbil K, Henry PG. J Neurosci Res. 2007;85:3294–303. doi: 10.1002/jnr.21269. [DOI] [PubMed] [Google Scholar]
- 30.Bischof MG, Mlynarik V, Brehm A, Bernroider E, Krssak M, Bauer E, Madl C, Bayerle-Eder M, Waldhausl W, Roden M. Diabetologia. 2004;47:648–51. doi: 10.1007/s00125-004-1362-2. [DOI] [PubMed] [Google Scholar]
- 31.Mason GF, Petersen KF, Lebon V, Rothman DL, Shulman GI. Diabetes. 2006;55:929–34. doi: 10.2337/diabetes.55.04.06.db05-1325. [DOI] [PMC free article] [PubMed] [Google Scholar]


