Abstract
The pathway from cortical layer 6 to the thalamus is a property of all thalamic relay nuclei. This pathway, as a population, directly excites relay cells and indirectly inhibits them via the thalamic reticular nucleus. To understand the circuit organization of this cortical feedback, we used laser-scanning photostimulation, which specifically activates somata or dendrites, to stimulate the primary somatosensory cortex in an in vitro thalamocortical slice preparation while recording from neurons of the ventral posterior medial nucleus. Layer 6 photostimulation evoked biphasic excitatory postsynaptic current/inhibitory postsynaptic current (EPSC/IPSC) responses in the neurons of the ventral posterior medial nucleus, indicating that such photostimulation strongly activates reticular cells. These disynaptic IPSCs were greatly suppressed or abolished by bath application of the muscarinic agonist acetyl-β-methylcholine. Our results suggest that the top-down modulation of thalamic neurons from cortical layer 6 involves an inhibitory component via the thalamic reticular nucleus, and this component can be selectively reduced by cholinergic input. Finally, we found the footprints for the excitatory corticothalamic and the inhibitory cortico-reticulo-thalamic inputs to be located in similar positions, though in some cases they are offset. Both patterns have implications for cortico-reticulo-thalamic circuitry.
Keywords: corticothalamic pathway, photostimulation, somatosensory system, thalamic reticular nucleus, thalamus
Introduction
One of the enduring problems in neuroscience is understanding the function of the pathway from cortical layer 6 to the thalamus, which is a property of all thalamic relay nuclei (details reviewed in Sherman and Guillery 2006; Jones 2008). This is a glutamatergic, excitatory pathway that is organized largely in a reciprocal manner, meaning that most thalamic neurons receive feedback from layer 6 of the same cortical column they innervate. Its size in terms of the number of constituent neurons far exceeds that of the thalamocortical pathway (Sherman and Koch 1986), and indeed, it provides the plurality of synapses to relay cells (Van Horn et al. 2000). An important part of the function of this projection relates to the thalamic reticular nucleus. This is a thin shell of γ-aminobutyric acidergic (GABAergic) neurons located mostly dorsal and lateral to the main relay nuclei, and it provides a major inhibitory input to relay cells. This is important to the cortical feedback because it appears that most or all the layer 6 corticothalamic axons branch to innervate reticular cells en route to their innervation of relay cells. Thus, this cortical input as a population appears directly to excite relay cells and indirectly to inhibit them via the thalamic reticular nucleus.
However, there is much unknown about this circuit. One issue is the balance in evoked responses in relay cells between direct excitation from layer 6 corticothalamic cells and indirect inhibition, via the thalamic reticular nucleus. Although it is known that electrical stimulation of the corticothalamic axons in vitro frequently evokes strong inhibitory responses in thalamic neurons, suggesting a strong contribution via the thalamic reticular nucleus (Landisman and Connors 2007), it is uncertain whether these responses are the results of antidromic activation of the thalamoreticular fibers. Another critical issue is the topographical relationships among the various cortical inputs to the relay cells, particularly, whether, as proposed, the direct excitatory and indirect inhibitory feedback originate from adjacent, largely nonoverlapping cortical columns (Temereanca and Simons 2004; Li and Ebner 2007). Finally, given the evidence that relay and reticular neurons are differently affected by neuromodulators such as acetylcholine (McCormick and Prince 1986; Lee and McCormick 1996, 1997; Hirata et al. 2006), it seems likely that such neuromodulators can differentially affect the direct excitatory versus indirect inhibitory components of this corticothalamic feedback.
To begin to address these questions, we used the technique of laser-scanning photostimulation of corticothalamic neurons in an in vitro slice preparation while recording from target thalamic relay cells. Compared with the more traditional technique of electrical stimulation, this approach has the advantage of specifically exciting the somata and dendrites of the afferent cells without affecting fibers of passage or antidromically activating axons of other cells, such as thalamic relay cells (Shepherd et al. 2003; Lam and Sherman 2005). In this way, we were able to dissect the neuronal circuitry involved in this corticothalamic feedback. We found that photostimulation of layer 6, in addition to evoking excitatory postsynaptic currents (EPSCs) in relay cells, strongly activates reticular neurons and thus evokes strong disynaptic inhibitory postsynaptic currents (IPSCs) in relay cells. In most cases, the areas of layer 6 from which EPSCs and IPSCs could be evoked were similar, though in some cases, they are laterally offset. Moreover, the disynaptic inhibition is strongly attenuated by the application of muscarinic agonists that hyperpolarize reticular neurons.
Materials and Methods
Preparation of Brain Slices
Our procedures followed the animal care guidelines of the University of Chicago. All experiments were performed on thalamocortical slices taken from young BALB/c mice (Harlan, 9–12 days postnatal). To obtain the slices, each animal was deeply anesthetized by inhalation of isoflurane, and its brain was quickly removed and chilled in ice-cold artificial cerebrospinal fluid (ACSF), which contained (in mM): 125 NaCl, 3 KCl, 1.25 NaH2PO4, 1 MgCl2, 2 CaCl2, 25 NaHCO3, and 25 glucose. Tissue slices (500 μm) were cut using a vibrating tissue slicer in the plane appropriate for an intact thalamocortical slice (Agmon and Connors 1991; Reichova and Sherman 2004; Lam and Sherman 2007), transferred to a holding chamber containing oxygenated ACSF and incubated at 30 °C for at least 1 h prior to recording.
Physiological Recording
Whole-cell recordings were performed using a visualized slice setup (Cox and Sherman 2000; Lam et al. 2005). Recording pipettes were pulled from borosilicate glass capillaries and had tip resistance of 4–8 MΩ when filled with solution (termed hereafter the “pipette solution”). For thalamic relay cells, this contained (in mM): 117 Cs-gluconate, 13 CsCl, 2 MgCl2, 10 HEPES (4-(2-hydroxyethyl)-1-piperazineethanesulfonic acid), 2 Na2-ATP, and 0.3 Na-GTP. We typically recorded in voltage clamp mode and maintained the cell at −45 to 0 mV holding potential for easy detection of IPSCs. The K+ channel blocker, Cs+, was used in the pipette solution to suppress IK_leak and helped hold the cell at the depolarized potentials indicated. Recording of thalamic reticular neurons was performed using a pipette solution containing the following (in mM): 135 K-gluconate, 7 NaCl, 2 MgCl2, 10 HEPES, 2 Na2-ATP, and 0.3 Na-GTP. The pH of the pipette solution was adjusted to 7.3 with CsOH (or KOH in cases where we used K+ and Na+ instead of Cs+) or gluconic acid, and the osmolality was 280–290 mOsm.
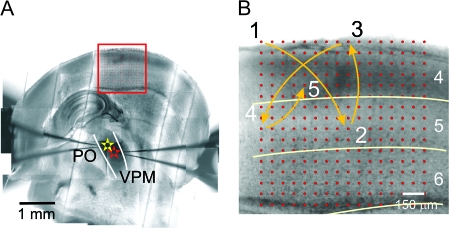
A few threads of nylon filaments, attached to a platinum wire slice holder, were used to secure the slices in the bath during the experiment. A wide gap was left between these filaments, and they were always carefully placed to avoid the area of recording and photostimulation (Fig. 1A). Often, we simultaneously recorded from 2 thalamic relay cells using an Axopatch 200B and Axoclamp 2A (Axon Instruments, Foster City, CA). The access resistance of the cells was constantly monitored throughout the recordings (>1 h for most experiments), and recordings were limited to neurons with a stable access of less than 30 MΩ throughout the experiment.
Figure 1.
Experimental design. (A) Montage from photomicrographs taken during an experiment of a somatosensory thalamocortical slice, combined to show the whole slice. The locations of the 2 recording sites and photostimulation are marked by red and yellow stars and a red rectangle, respectively. The division between the ventral posterior medial (VPM) and posterior (PO) nuclei are indicated by white lines. (B) Pattern of stimulation. The stimulation pattern consists of 256 positions arranged in a 16 × 16 square matrix, with 75 μm between adjacent rows and columns. Stimulation of these positions was arranged in a sequence that maximized the distance between consecutive trials. Locations of the first 5 trials are shown.
We recorded from the ventral posterior medial nucleus and the thalamic reticular nucleus associated with ventral posterior medial nucleus. The ventral posterior medial nucleus can be easily identified in slices as a thalamic region that has a darker contrast than the neighboring posterior nucleus and a less fibrous texture than the adjacent ventral posterior lateral nucleus (Fig. 1A). The approximate borders between relevant cortical layers are identified using the following criteria: layer 4 can be distinguished by the characteristic barrel structures and a relative dark contrast compared with layer 5a, which appears as a light-color band under transillumination; layer 5b can be differentiated from the neighboring layers 5a and 6, even at low magnification, by the presence of a large number of loosely packed large cell bodies.
All chemicals, except for SR95531 (gabazine), were purchased from Sigma (St Louis, MO). SR95531 was purchased from Tocris (Ellisville, MO).
Photostimulation
We used our previously described methods for photostimulation (Lam and Sherman 2005, 2007; Lam et al. 2006). Data acquisition and photostimulation were controlled by a program written in Matlab (MathWorks, Natlick, MA) developed in the laboratory of Karel Svoboda (Shepherd et al. 2003). Nitroindolinyl-caged glutamate (Canepari et al. 2001) (Sigma) was added to recirculating ACSF to a concentration of 0.39 mM during recording. Focal photolysis of the caged glutamate was accomplished by a pulsed UV laser (355 nm wavelength, frequency-tripled Nd:YVO4, 100-kHz pulse repetition rate, DPSS Laser, San Jose, CA). The laser beam was directed into the side port of a double-port tube on top of an Olympus microscope (BX50WI) using UV-enhanced aluminum mirrors (Thorlabs, Newton, NJ) and a pair of mirror galvanometers (Cambridge Technology, Cambridge, MA) and then focused onto the brain slice using a low-magnification objective (4×0.1 Plan, Olympus). Angles of the galvanometers were computer controlled and determined the position stimulated by the laser. The optics was designed to generate a nearly cylindrical beam in the slice so as to keep the mapping 2 dimensional. The Q-switch of the laser and a shutter (LS3-ZM2, Vincent Associate, Rochester, NY) controlled the timing of the laser pulse for stimulation.
A variable neutral density wheel (Edmund, Barrington, NJ) controlled the power of the laser at different levels during experiments by attenuating the intensity of the laser. A microscope coverslip in the laser path reflected a small portion of the laser onto a photodiode, and the current output from this photodiode was used to monitor the laser intensity during the experiment. The photodiode output was calibrated to laser power at the back focal plane of the objective when we set up the optical equipment. The laser power was measured using a power meter (Thorlabs). Because the transmittance of the objective was about 40% at 355 nm wavelength, the actual power of the laser reaching the slices was actually less than half the values we state. The laser power used in our experiments varied from 15 to 60 mW (measured at the back focal plane of the microscope objective). During a recording, the location of the cortical input to a recorded neuron was first determined by stimulating random positions within layer 6 of the primary somatosensory cortex. Once it was found, the approximate laser power level at which responses could be reliably evoked was found by gradually adjusting the neutral density filter. The power used in most experiments was about 5–10 mW above this value.
Slices that maintained much of the intact corticothalamic pathway had very consistent geometry and size, and they were carefully placed so that the bottom of the photostimulation grid was roughly parallel to and within 100 Fm of the white matter. The standard stimulation pattern for mapping the corticothalamic input consisted of positions arranged in a 16 × 16 array, with 75 Fm between adjacent rows and columns (red circles in Fig. 1B). To avoid receptor desensitization, local caged-glutamate depletion, and excitotoxicity, stimulation of these positions was arranged in a sequence that maximized the distance between consecutive trials (first 5 trials shown in Fig. 1B). The light stimulus was 2 ms long, which consisted of 200 laser pulses. The interval between photostimuli varied from 2 to 4 s. The time required to complete a single map was about 25 min. Two to 7 maps were completed in each experiment, and we did not see any change of the recording quality during experiments that suggested damage from phototoxicity.
Data Analysis
Responses were analyzed using programs written in Matlab (MathWorks) and Octave (http://www.octave.org). For presentation of the data, traces of the 200-ms recording immediately after the laser pulse were superimposed on a photomicrograph of the slice (see Results). The abovementioned traces were arranged into a 16 × 16 array and placed where the laser was focused during the stimulation. The cortical areas in the slices where photostimulation evoked responses in the recorded thalamic relay neuron are referred as their cortical input “footprints.” The footprint shapes and locations were determined by visual inspection. Spontaneous responses were uncommon, and the responses to photostimulation could be easily detected by their short latency and the presence of similar responses in adjacent stimulation locations.
For better visualization of the shape and size of the cortical inputs, the response traces were also smoothed (1 ms moving average) and the peak EPSCs and IPSCs of the smoothed traces were plotted in 2 different ways. In Figure 6, they are plotted separately using similar color scales. In Figures 4 and 7, peak EPSCs and IPSCs were color coded as the brightness of green and red, respectively. The 2 resultant pseudocolor plots were superimposed, so that regions with biphasic responses (i.e., large peak EPSCs and IPSCs) appear yellow. Those with only EPSCs or IPSCs appear green or red.
Figure 6.
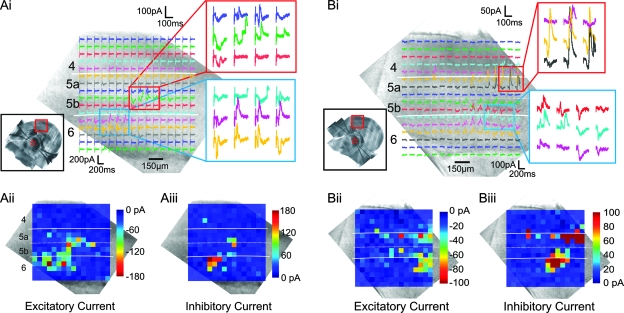
Relative location of excitatory and inhibitory cortical input footprints; conventions as in Figure 3. (Ai, Bi) Photostimulation of both layer 5a (red rectangles) and layer 6 (blue rectangles) evoked biphasic EPSC/IPSC responses in both neurons. (Aii, Bii) Pseudocolor plots of the peak inward (excitatory) currents. (Aiii, Biii) Pseudocolor plots of the peak outward (inhibitory) currents. The regions where the EPSCs and IPSCs could be elicited in the neuron of (A) were mostly overlapped (laser power was 18 mW and the holding potential was −35 mV). The regions where the EPSCs and IPSCs could be elicited in the neuron of (B) laterally offset (laser power was 32 mW and the holding potential during recording was −45 mV).
Figure 4.
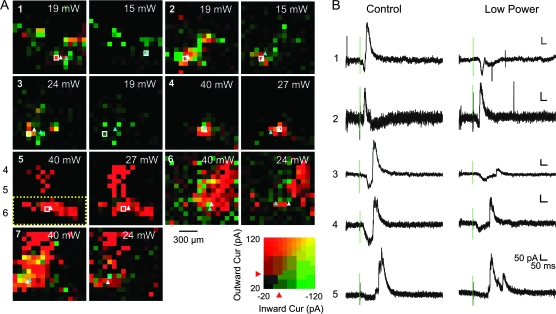
Effects of laser power on the cortical input footprints of the neurons of the ventral posterior medial nucleus. (A, panels 1–7) Pseudocolor plots of the excitatory and inhibitory input footprint obtained at 2 laser powers for 7 experiments. These experiments were performed at holding potentials between −20 and −45 mV so that both EPSCs and IPSCs could be easily detected. The peak inward (EPSCs) and outward (IPSCs) currents evoked at each stimulation position are represented by the intensity of green and red, respectively (see the color scale in lower right). The 2 pseudocolor maps are superimposed, so that the areas where biphasic responses were evoked appear yellowish. The centroids of the layer 6 excitatory and inhibitory responses were calculated as described (see Materials and Methods) and indicated with light-blue (EPSCs) and white triangles (IPSCs); the area where the responses were included in this calculation is encircled with a dotted rectangle in panel 5. Numerical labels in panel 5 indicate approximate location of the cortical layers 4–6. The laser power used for photostimulation is labeled in upper right of the pseudocolor maps. (B) Response traces to photostimulation at selected positions (white squares in panels 1–5). Green vertical lines indicate the timing of the laser pulse. Vertical scale bars and horizontal scale bars equal 50 pA and 50 ms, respectively, for all traces.
Figure 7.
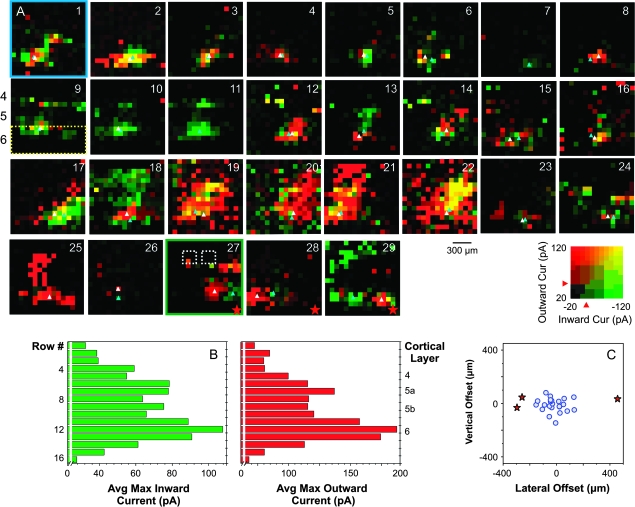
Spatial organization of the cortical input footprint. (A, panels 1–29) Pseudocolor plots of the excitatory and inhibitory input footprints for 29 experiments performed at holding potentials between −20 and −45 mV. The peak inward (EPSCs) and outward (IPSCs) currents evoked at each stimulation position are represented in the same conventions as described in Figure 4 and Materials and Methods. The centroids of the layer 6 excitatory and inhibitory responses were calculated as described (see Materials and Methods) and indicated with light-blue (EPSCs) and white triangles (IPSCs); the area where the responses were included is encircled with a dotted rectangle in panel 9. The numerical labels in (A), panel 9 indicate approximate location of the cortical layers 4–6. (A) Panel 1 and panel 27 are the examples shown in Figure 5A,B. For reference, the locations of 2 barrels are indicated in panel 27 with white dotted rectangles. (B) Laminar organization of the cortical input footprints. The histograms represent the average maximum peak inward (left) and outward (right) currents for each row in panels 1–29. Row numbers and the approximate locations of the cortical layers are indicated on the y-axis. (C) Vertical and lateral offsets of the inhibitory input footprints from the excitatory footprints. The lateral offset was larger than 200 μm (the approximate width of a barrel) in 3 experiments. They are indicated with red stars in the graph and in the pseudocolor plots (A, panels 27–29).
The center of mass, which may differ from the geometrical center, of the footprints were calculated using the following equations to represent the centroids of the layer 6 cortical inputs and indicated in Figures 4 and 7 with light-blue (EPSC) and white (IPSC) triangles.
The parameters xc and yc are the coordinate of the centroid, whereas xi and yi are the coordinates of all the stimulation sites within layer 6 (row 11 to row 16 in our maps). Ri are values calculated from the peak EPSCs or IPSCs at these positions (Pi) using the following equations. The ⊖ represents the threshold values for EPSC and IPSC detection; it is equal to 50 pA in both cases.
Results
Spatial Specificity of Layer 6 Photostimulation
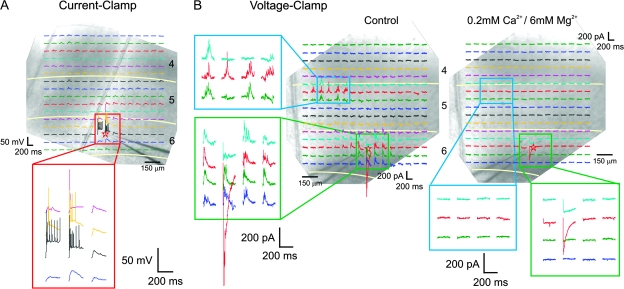
We estimated the spatial specificity of layer 6 photostimulation by recording from 15 cortical neurons in layer 6 of the primary somatosensory cortex. Their cell types were tested by current injection: 14 were regular spiking neurons and 1 was a fast spiking neuron. Figure 2A shows an exemplary regular spiking neuron during current clamp recording. Recordings of the 200-ms period immediately after photostimulation are superimposed on a photomicrograph of the slice in which the experiment was performed. Approximate separation of cortical laminae is indicated by white lines. The responses to photostimulation around the soma are shown below at a larger magnification. Photostimulation evoked action potentials only within a small area (<150 μm) around the soma, with the laser power typically used in our experiments. Similar current clamp recordings were repeated in 2 other layer 6 neurons.
Figure 2.
Spatial specificity of layer 6 photostimulation. Responses of layer 6 neurons to photostimulation at 256 locations, arranged in a 16 × 16 array, are superimposed on a photomicrograph of the cortex. The 200-ms recording immediately after the photostimulation is shown where the slice was stimulated. Selected traces in areas of interest (red, blue, and green rectangles) are shown in a larger scale. (A) Responses of a layer 6 neuron to photostimulation in current clamp recording. Action potentials were evoked only in an area less than 150 μm around the soma. (B) Voltage clamp recordings from another experiment. Photostimulation of layer 6 and layer 5a evoked a mixture of inward and outward currents at −20 mV (B, left) holding potential in this neuron. Direct depolarization from photostimulation was evoked only within a small region within 100 μm of the soma after synaptic responses were abolished using 0.2 mM Ca2+/6 mM Mg2+ ACSF (B, right). Laser power was 50 mW in (A) and 30 mW in (B).
During voltage clamp recording, photostimulation evoked a mixture of inward (excitatory) and outward (inhibitory) currents, mostly from the region around the soma. Responses of layer 6 neurons to photostimulation of the other cortical laminae were uncommon and were seen in only 3 experiments. Figure 2B shows the results from another experiment where such responses were observed. The responses to photostimulation around the soma and in a rectangular region in layer 5a, in which photostimulation successfully elicited responses, are enlarged and shown in the left and below (Fig. 2B). At a holding potential of −20 mV, photostimulation elicited a mixture of inward and outward currents in this neuron (Fig. 2B, left). Most responses were synaptic because they were abolished in low Ca2+/high Mg2+ ACSF (Fig. 2B, right). Under the typical conditions of our experiments, direct excitation from photostimulation was only evoked in a region within 100 μm of the soma (Fig. 2B, right). A similar spatial extent of direct depolarization by photostimulation was seen in 7 other experiments, and we did not see evidence of direct excitation of the apical dendrites of layer 6 neurons in any of these experiments.
Biphasic Responses of Ventral Posterior Medial Nucleus Neurons to Cortical Photostimulation
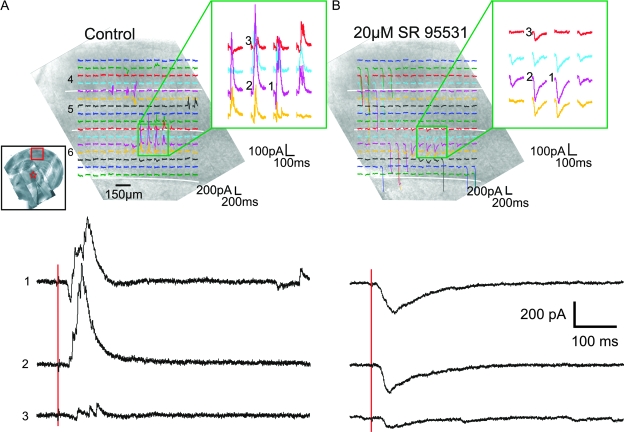
We recorded from 44 neurons of the ventral posterior medial nucleus that responded to photostimulation of the primary somatosensory cortex. Photostimulation always evoked EPSCs in these cells but rarely (3 of 44) evoked pure EPSC responses. In most cases (41 of 44), the responses were biphasic and consisted of an EPSC followed by an IPSC. Figure 3 shows an example of this. The low-power inset in Figure 3A displays the photomicrographs taken during the experiment (a montage to show the whole slice), and the red star and square indicate the location of the recording and stimulation site, respectively. Recordings of the 200-ms period immediately after the laser pulse are superimposed on a photomicrograph of the area where the cortex was stimulated. Selected traces from an area of interest (green rectangle) are enlarged and shown at the upper right. Approximate separation of cortical layers is indicated by white lines. Figures 3, 5, 6 and 8 are organized in a similar fashion. Figure 3A shows that photostimulation of the upper layer 6 of the primary somatosensory cortex evoked strong biphasic EPSC/IPSC responses in this neuron. Three selected traces (numbered 1–3) are also shown below at a larger scale. We were able to block the evoked IPSCs with the GABAA-specific antagonist SR95531 (Fig. 3B), demonstrating that these were GABAergic responses. Similar effects of SR95531 were repeated in 2 other experiments.
Figure 3.
Photostimulation of the primary somatosensory cortex evokes biphasic EPSC/IPSC responses. (A) Response of a neuron of ventral posterior medial nucleus to cortical photostimulation. The inset displays the photomontage taken during the experiment. The red star and rectangle indicate the site of recording and photostimulation, respectively. Shown are voltage clamp responses of a neuron to photostimulation at 256 locations, arranged in a 16 × 16 array, superimposed on a photomicrograph of the cortex. The 200-ms recording immediately after the photostimulation is shown where the slice was stimulated. Photostimulation at a region in upper layer 6 evoked biphasic EPSC/IPSC responses in this neuron (green square). The response traces in this region are magnified and shown on the right. Three selected traces (numbered 1–3 in [A] and [B]) are shown below in a larger magnification. The 2 red vertical lines indicate timing of the laser pulse. (B) Effects of GABA antagonist. The outward currents were abolished by bath application of a GABAA antagonist (SR95531). White lines in both figures indicate the approximate separation of cortical layers. The laser power used in both experiments was 21 mW, and the holding potential during recording was −20 mV.
Figure 5.
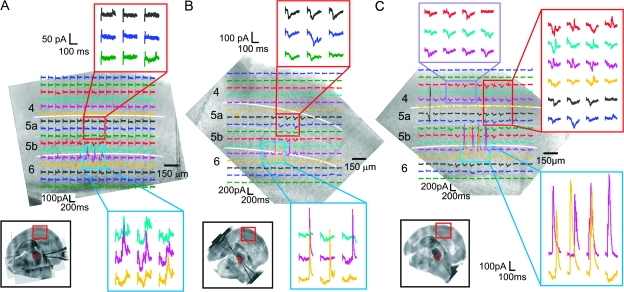
Laminar organization of the cortical input footprints of the neurons of the ventral posterior medial nucleus; conventions as in Figure 3. (A) Example where photostimulation of upper layer 6 only evoked biphasic EPSC/IPSC responses (blue square). Photostimulation of layer 5a (red rectangle) and other layers elicited no responses in this neuron. The laser power used in this experiment was 32 mW. (B) Example where photostimulation of both layer 5a (red rectangle) and layer 6 (blue rectangle) elicited responses. The laser power was 30 mW. (C) Example where responses could be evoked from a large area of the cortex. The cell responded to photostimulation in layer 4 (red and purple rectangles), layer 5a (red rectangle), and layer 6 (blue rectangle). The laser power was 25 mW. The holding potential for all 3 experiments was −20 mV.
Figure 8.
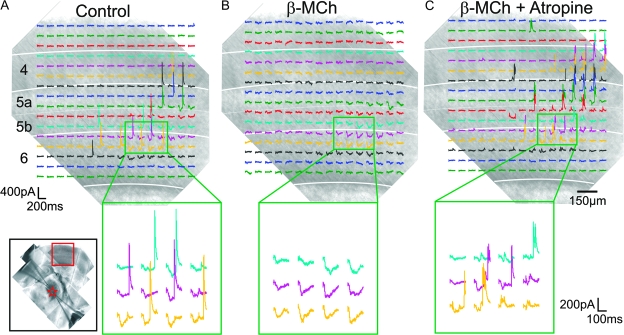
Cholinergic modulation of the responses to cortical photostimulation; conventions as in Figure 3. (A) Control. Photostimulation of layer 6 evoked the typical biphasic EPSC/IPSC responses in this neuron of the ventral posterior medial nucleus. (B) Effects of acetyl-β-methylcholine (β-MCh). Bath application of 250 μM of acetyl-β-methylcholine, a muscarinic receptor agonist, abolished the IPSCs without affecting the amplitude of the EPSCs. (C) Blockade of the effects of acetyl-β-methylcholine by atropine. The same slice was washed with normal ACSF for 20 min. After the IPSCs recovered, bath application of acetyl-β-methylcholine together with atropine, a muscarinic antagonist, did not affect the IPSC responses. Laser power used in all 3 maps was 35 mW and the holding potential was −20 mV.
The laser power needed to evoke detectable responses in the thalamic neurons varied between slices, from 15 to 60 mW (measured at the back focal plane of the microscope objective). Average power of the laser used in the 3 experiments where only EPSCs could be evoked was 41 ± 2.3 mW (means ± standard deviations [SDs]). The average power used in the other 41 experiments, in which biphasic responses were evoked, was 31 ± 9.8 mW (means ± SDs). Cortical input footprints of 11 recorded neurons were mapped at 2 different laser intensities: a control and a second one using 67–86% of the control power. In all cases, photostimulation with the lower laser power continued to evoke visually detectable IPSCs in the thalamic neurons.
Figure 4 presents the results from 7 experiments in which we tested effects of laser powers at holding potentials between −20 and −45 mV, potentials at which both EPSCs and IPSCs could be easily detected. As described in Results, peak EPSCs and peak IPSCs of the responses to photostimulation were measured to generate two 16 × 16 pseudocolor maps in green and red, respectively. These 2 pseudocolor maps were then superimposed so that the areas where biphasic responses were detected (i.e., both peak EPSCs and peak IPSCs were large) are yellowish (see the color scale at lower right). The cortical areas where photostimulation evoked mostly EPSCs or IPSCs will appear green or red.
Each panel (1–7) in Figure 4A shows the cortical input footprints of 1 ventral posterior medial nucleus neuron determined at 2 different laser powers, which is indicated at the upper right of each pseudocolor map. Full traces for the responses to photostimulation in selected positions (white squares in panels 1–5) are also magnified and shown in greater power (Fig. 4B). Centroids of the layer 6 input footprints are indicated with light-blue (EPSC) and white triangles (IPSC).
Photostimulation evoked biphasic responses in all 7 neurons at both laser powers. In 2 (panels 1 and 3), IPSCs at the low laser power were too small to be detected using our quantification algorithm, even though they can still be visually detected from the response traces (Fig. 4B, panels 1 and 3). Lateral displacement of the centroids of the input footprints obtained at the 2 laser powers was 87.0 ± 25.1 μm for the excitatory input (means ± standard error of the means) and 37.4 ± 9.3 μm for the inhibitory input; it was larger than 100 μm in only 2 cases (panels 4 and 6).
The GABAergic IPSCs are likely a disynaptic response involving the thalamic reticular nucleus (see also below), and this, in turn, suggests that activation of layer 6 corticothalamic cells depolarizes reticular neurons enough to fire action potentials. Further evidence for this is presented below.
Laminar Organization of the Cortical Inputs
The layer 6 sites at which photostimulation evoked responses in cells of the ventral posterior medial nucleus were almost always (43 of 44) located in upper part of this layer (>200 μm from the underlying white matter; Figs 3–7). In the only exception, responses were elicited from lower layer 6, roughly 150 μm from the white matter (not shown). In 17 of the 44 thalamic cells recorded, the cortical input footprints consisted of a single region located in the layer 6 (Fig. 5A, blue rectangle). However, for 23 cells, biphasic responses could be visually detected in an additional, separate region in layer 5a (Fig. 5B, red rectangle). Because there are no known direct projections from layer 5a to the ventral posterior medial nucleus and direct activation of layer 6 neurons was relatively specific (Fig. 2), these responses are likely to be disynaptic EPSCs and trisynaptic IPSCs resulted from synaptic activation of layer 6 corticothalamic neurons by layer 5a photostimulation. In the remaining 4 thalamic cells, the cortical input footprints were more widespread and difficult to characterize. Figure 5C illustrates one such case, in which, in addition to layer 6, EPSCs and/or IPSCs were evoked from a large area spreading across all of layer 5 and into layer 4.
Relative Locations of the Excitatory and Inhibitory Inputs
Two ventral posterior medial nucleus neurons that have different relative locations for their excitatory and inhibitory inputs are shown in Figure 6. For better visualization, the peak EPSCs and IPSCs of the response traces are plotted as pseudocolor displays. Figure 6A shows 1 example where cortical locations evoked EPSCs and IPSCs in overlapped areas (Fig. 6Aii,Aiii); most ventral posterior medial nucleus neurons have similar excitatory and inhibitory cortical input footprints. Figure 6B shows one of a few exceptions (see also below and Fig. 7). In this case, the cortical area where photostimulation evoked EPSCs (Fig. 6Bii) was lateral to the area where IPSCs was elicited (Fig. 6Biii).
Diversity of Cortical Input Footprints for Ventral Posterior Medial Nucleus Neurons
Figure 7 displays, in a more quantitative manner, the results of a subset of 29 experiments carried out between −20 and −45 mV, holding potentials at which both EPSCs and IPSCs could be easily detected. Peak EPSCs and peak IPSCs for the responses traces in each map were measured and represented following the scheme described in Materials and Methods and Figure 4. The examples in Figure 6A,B are shown in panel 1 and panel 27 (Fig. 7A), respectively.
Stimulation of the upper layer 6 evoked monophasic or biphasic responses in all these experiments. Similar to the example shown in 5B, stimulation of a separate area in the upper layer 5 also elicited responses in some experiments (Fig. 7A, panels 1, 3, 9–18, 25–27, and 29). In a few cases, responses could be evoked in a large area covering layers 4, 5, and 6 (Fig. 7A, panels 19–22). For each map, we calculated the maximum peak EPSCs and IPSCs values in each row and averaged these values across experiments. The results are plotted in Figure 7B (EPSCs, left; IPSCs, right). Row numbers are labeled on the left of the graphs and the approximate cortical laminae they correspond to are indicated on the right. The average maximum EPSCs and IPSCs were the strongest in upper layer 6. Reposes in upper layer 5 were also relatively large when comparing with layer 4 and lower layer 5.
Centroids of the excitatory and inhibitory input footprints were estimated using a modified equation based on the calculation of the center of mass (see Materials and Methods) and indicated in these pseudocolor plots using light-blue (EPSC) and white (IPSC) triangles. The area where the responses are included in the calculation is indicated with a yellow dotted rectangle in Figure 7A (panel 9). The locations of 2 barrels are indicated with white dotted rectangles (panel 27). The lateral and vertical offsets of the centroid of the inhibitory input footprints from the excitatory ones are calculated and plotted in Figure 7C. The width of a barrel in the slices is about 200 μm (Fig. 7A, panel 27). Three experiments (red stars) have lateral offsets larger than this value; their pseudocolor plots are indicated with red stars (Fig. 7A, panels 27–29).
Muscarinic Modulation of Corticothalamic Feedback
We further investigated the involvement of the thalamic reticular nucleus in the generation of the IPSC responses by observing how muscarinic agonists affect this circuitry because these agonists are thought to hyperpolarize reticular cells (McCormick and Prince 1986). Bath application of the muscarinic agonist acetyl-β-methylcholine specifically abolished or greatly reduced the IPSC responses to cortical photostimulation of the neurons of the ventral posterior medial nucleus. Figure 8 displays the results of 1 representative experiment. For this cell, photostimulation of upper layer 6 evoked the typical biphasic EPSC/IPSC responses (Fig. 8A). Bath application of 250 μM of acetyl-β-methylcholine abolished the IPSCs without visibly affecting the amplitude of the EPSCs (Fig. 8B). The same effect of acetyl-β-methylcholine was found in 14 other thalamic cells. In the example shown in Figure 8 as well as in 6 other neurons, the evoked IPSCs recovered after 20–30 min following replacement of the bath with normal ACSF after acetyl-β-methylcholine application (data not shown). Bath application of a cocktail of 250 μM acetyl-β-methylcholine and 1 μM atropine, a muscarinic antagonist, afterward did not affect the IPSC responses (Fig. 8C).
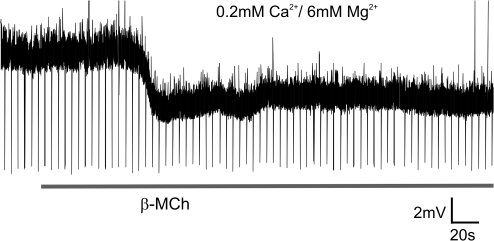
Because the thalamic reticular nucleus is the only source of GABAergic inputs to the ventral posterior medial nucleus in mice, an obvious explanation of the above effects of acetyl-β-methylcholine is through its action to hyperpolarize thalamic reticular neurons (McCormick and Prince 1986), thereby removing them from the feedback circuit. We therefore examined the effects of acetyl-β-methylcholine on reticular neurons in a bath of 0.2 mM Ca2+/6 mM Mg2+ ACSF (to eliminate any possible presynaptic influences of the agonist). Figure 9 shows the results; the downward spikes in the trace are test pulses applied to measure membrane resistance. In this and 4 other experiments, bath application of 250 μM of acetyl-β-methylcholine induced a persistent hyperpolarization of reticular neurons.
Figure 9.
Response of a thalamic reticular neuron to acetyl-β-methylcholine. The thalamic reticular neuron was recorded in current clamp mode in 0.2 mM Ca2+/6 mM Mg2+ ACSF (to eliminate any possible presynaptic influences of the agonist). Bath application of 250 μM of acetyl-β-methylcholine (gray horizontal line) hyperpolarized the neuron.
Discussion
We used photostimulation to study the properties and topography of the excitatory corticothalamic and the indirect inhibitory cortico-reticulo-thalamic inputs to relay cells in the ventral posterior medial nucleus of young mice. Our results lead to 3 main conclusions. First, consistent with similar studies using minimal electrical stimulation (Landisman and Connors 2007), photostimulation commonly evoked biphasic EPSC/IPSC responses, often at a relatively low laser intensity. This is consistent with a strong corticoreticular pathway because of powerful corticoreticular synapses (Golshani et al. 2001; Landisman and Connors 2007), high convergence from the cortical layer 6 to thalamic reticular nucleus (Sherman and Koch 1986; Land et al. 1995), or both. Second, we discovered that the strength of these disynaptic IPSCs can be reduced by bath application of the muscarinic agonist acetyl-β-methylcholine, probably through the hyperpolarization of reticular neurons. Third, we found that the centroids of the excitatory corticothalamic and the inhibitory cortico-reticulo-thalamic input footprints were located in similar positions, although they were in a few cases offset, and both results have implications for cortico-reticulo-thalamic circuitry that is discussed below.
Corticoreticular Synapses
One key issue addressed here by our data is the role of the reticulothalamic pathway in the feedback corticothalamic circuit. We think it interesting that, as reported in similar experiments using minimal electrical stimulation of layer 6 corticothalamic fibers (Landisman and Connors 2007), we can activate IPSCs (along with expected EPSCs) from photostimulation in cortex. Because the synapse from layer 6 cortical cells onto thalamic relay cells is glutamatergic and excitatory (thus producing the EPSCs) and because intrinsic interneurons in the ventral posterior medial nucleus of the mouse are rare or absent (Arcelli et al. 1997), the only plausible source for the evoked IPSCs is via the thalamic reticular nucleus.
The obvious conclusion from our results is that activation of the thalamic reticular neurons by layer 6 photostimulation is quite strong, strong enough for reticular cells to fire reliably. The main excitatory inputs to the thalamic reticular nucleus are thought to be axon collaterals of thalamocortical and corticothalamic cells, and photostimulation applied to cortex only activates the somata and dendrites of corticothalamic cells without antidromically stimulating the thalamocortical axons. Therefore, thalamic reticular neurons can be stimulated monosynaptically through the corticoreticular synapses or disynaptically through the thalamoreticular pathway, if thalamic relay cells were strongly activated by photostimulation. Because layer 6 corticothalamic synapses appear to be weak based on our own observations here and also earlier reports (Golshani et al. 2001; Reichova and Sherman 2004; Liu et al. 2008), the obvious conclusion is that these thalamic reticular neurons were activated through the corticoreticular pathway, although we cannot entirely rule out relay cell activation playing a role.
Gentet and Ulrich (2004) found that even though corticoreticular excitatory postsynaptic potentials (EPSPs) (2.4 ± 0.1 mV) are weaker than thalamoreticular EPSP (7.4 ± 1.5 mV), they are strong compared with EPSPs recorded in relay cells from corticothalamic activation (Golshani et al. 2001; Liu et al. 2008). There is also likely to be a high convergence for the corticoreticular pathway because layer 6 cells far outnumber thalamic or reticular neurons (Sherman and Koch 1986; Land et al. 1995). Whether the strength of corticoreticular pathway is due to convergence of many relatively weak corticoreticular synapses or the strength of these synapses individually, or both, remains to be determined.
Muscarinic Regulation of the Layer 6 Feedback
Cholinergic axons from the pedunculopontine region of the brain stem innervate both the ventral posterior medial nucleus and associated thalamic reticular nucleus (Satoh and Fibiger 1986; Hallanger et al. 1987), and this input is thought to play an important role in thalamic relay functions (reviewed in Sherman and Guillery 2006; Jones 2008).
Specifically, these inputs generally appear to depolarize most relay cells, including all in the ventral posterior medial nucleus, and hyperpolarize neurons of the thalamic reticular nucleus (McCormick and Prince 1986; Lee and McCormick 1997; Varela and Sherman 2007). As a result, one might predict that activation of these cholinergic inputs to thalamus would have the effect of reducing or eliminating any effects the thalamic reticular nucleus has in circuit functions. That is exactly how we interpret the result that application of muscarinic agonists eliminated disynaptic IPSCs in relay cells evoked from cortex. It is, therefore, possible that one effect of increased cholinergic modulation, as occurs when an animal proceeds from slow-wave sleep through drowsiness to vigilance (Steriade and Contreras 1995; Datta and Siwek 2002), is to bias the corticothalamic feedback from a more mixed excitatory/inhibitory circuit to more of a purely excitatory one.
A complication to this conclusion is that reticular neurons exhibit a voltage-dependent IT that leads to burst firing when relatively hyperpolarized (Domich et al. 1986; Mulle et al. 1986; Lee et al. 2007). One might expect that the application of cholinergic agonists in our experiments, by hyperpolarizing reticular cells, might cause them to fire in burst mode. Thus, our results could be interpreted in 1 of 2 ways: 1) cholinergic agonists suppress corticoreticular activation through hyperpolarization of reticular cells or 2) cholinergic agonists cause reticular cells to fire in burst mode, which is a less effective mode of relaying corticoreticular inputs, because the added hyperpolarization provided is too much for cortical inputs to overcome.
Laminar Organization of the Cortical Inputs to Ventral Posterior Medial Nucleus Neurons
The cortical input footprints for most ventral posterior medial nucleus neurons are located in upper layer 6. This is consistent with the results from pathway-tracing experiments that showed most layer 6 input to the ventral posterior medial nucleus originating from upper layer 6 (Bourassa et al. 1995; Killackey and Sherman 2003). Corticothalamic neurons in lower layer 6, on the other hand, are known to project mostly to the posterior nucleus (Killackey and Sherman 2003). The ventral posterior medial and posterior nuclei are thought to be involved in 2 parallel, lemniscal (ventral posterior medial nucleus) and paralemniscal (posterior medial nucleus), somatosensory pathways (Chiaia et al. 1991; Turman et al. 1995; Kim and Ebner 1999; Veinante et al. 2000; Bureau et al. 2006; Kleinfeld et al. 2006; Yu et al. 2006). Whether the different axonal targets for the upper and lower layer 6 indicate functional differences between these 2 sublaminae remained to be tested.
We also found that photostimulation of upper layer 5 evoked biphasic EPSC/IPSCs responses in the neurons of the ventral posterior medial nucleus. Because there is no known projection from layer 5 to the ventral posterior medial nucleus and photostimulation under our experimental conditions does not strongly activate the apical dendrites of layer 6 neurons (Fig. 2), the only reasonable interpretation is that these are “disynaptic/trisynaptic” EPSC/IPSC responses due to “synaptic” activation of layer 6 corticothalamic neurons from layer 5 photostimulation. This, in turn, suggests a relatively strong interlaminar input from (upper) layer 5 to the neurons in layer 6, as has been proposed in cat visual cortex (Gilbert 1983). This also suggests that the cortical inputs to layer 6 neurons of the mouse somatosensory cortex may be different from those reported for the visual cortex of macaque monkeys, in which, in addition to layer 5, strong interlaminar inputs also come from the more superficial layer 2/3 (Briggs and Callaway 2001), and that reported for the rat, in which layer 6 cells receive mostly local input from within the same layer (Zarrinpar and Callaway 2006).
Neuronal Microcircuitry of the Cortical Excitatory and Inhibitory Feedback
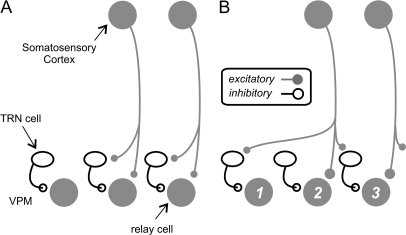
Figure 10 illustrates 2 possible configurations (among others) for the spatial organization of the excitatory and inhibitory feedback to thalamic neurons via the corticothalamic projection. It should be noted that these are not mutually exclusive patterns because the cortical inputs to thalamic neurons could vary greatly among thalamic neurons.
Figure 10.
Two patterns among others possible for corticothalamic projection from layer 6 to cells of the thalamic reticular nucleus (TRN) and relay cells of the ventral posterior medial nucleus (VPM). (A) Pattern of simple excitation and feed-forward inhibition. (B) More complicated pattern in which activation of a cortical axon can excite some relay cells directly and inhibit others through activation of reticular cells. Further details in text.
The circuit configuration in Figure 10A suggests that the cortical feedback to the thalamus is strictly reciprocal and organized in a simple feed-forward inhibitory fashion. In the case of the vibrissal system of the mouse, it suggests that thalamic neurons receive their layer 6 inputs only from the homologous cortical column, which responds to the same primary whiskers. The circuit configuration in Figure 10A also suggests that, although relatively weak firing of a corticothalamic neuron will excite relay cells, strong firing will increase corticothalamic EPSPs and disynaptic reticular IPSPs in a more balanced way. Although a more balanced increase of EPSPs and IPSPs does not change the membrane potential in the relay cell to a great extent, this will lower neuronal input resistance and reduce the EPSP amplitude of the driver input to the relay cell, which in the case of the ventral posterior medial nucleus is the medial lemniscus, thereby affecting the input/output slope (Chance et al. 2002; Abbott and Chance 2005); in other words, the corticothalamic and corticoreticular pathways function together as a “gain control” for the lemniscal input to thalamic relay cells. Another property of this circuit configuration is whereas reticular cells are excited by corticothalamic neurons, thalamic relay cells can be suppressed due to the “shunting” from increased membrane conductance. Such opposite effects of layer 6 neurons on the thalamic reticular neurons and relay cells provide a plausible circuit mechanism for the regulation of the neuronal responses in these 2 regions by visual attention (McAlonan et al. 2008).
The configuration in Figure 10B, however, proposes a wider spread of the corticoreticular collaterals that no longer operates as a simple feed-forward inhibitory circuit (Temereanca and Simons 2004; Li and Ebner 2007). Here, activation of the corticothalamic axons purely excites one or a few relay cells (e.g., cell 2) and purely inhibits their neighbors (e.g., cells 1 and 3). Functionally, thalamic cells that are topographically aligned to the cortical neurons (e.g., those responding to the same whiskers) will be excited by the corticothalamic feedback, whereas the nonaligned ones will be inhibited. The consequence of reticular inhibition, in this circuit configuration, will be to sharpen thalamic receptive field through “lateral inhibition” (Temereanca and Simons 2004; Li and Ebner 2007).
The circuit configuration in Figure 10A requires that the excitatory and inhibitory footprints evoked by photostimulation in cortex must largely overlap and originate from the same individual cortical columns. The observation that such footprints are common is consistent with this circuit, although it does not prove its existence.
We did, however, find a few cases where the footprints for the excitatory and inhibitory inputs were laterally displaced and those are more consistent with the circuit shown in Figure 10B. The number we found may also be an underestimate because the plane of sectioning used in the thalamocortical preparation maintains only a few of the major barrels (Land and Kandler 2002), and best preservation of the corticoreticular pathway may require slightly different angles from the ones we used. Moreover, we used 9- to 11-day-old mice due to the visibility issue during recording and so our number would also be an underestimate if lateral inhibition between corticothalamic inputs appears only later during development.
Intercolumnar connections may also underlie some footprints that have laterally displaced excitatory and inhibitory inputs. Horizontal, intercolumnar inputs may be strong for some layer 6 neurons, so that photostimulation in the adjacent columns can synaptically activate them, which then leads to disynaptic/trisynaptic EPSCs/IPSCs in the neurons of the ventral posterior medial nucleus. However, one would expect that this would also require responses elicited from these adjacent columns to have weaker IPSCs and longer latencies because the pathway involves more synapses. What we actually observed, however, is the opposite pattern (Fig. 7, panels 27–79).
Thalamoreticular neurons are also known to be interconnected with chemical (Sanchez-Vives et al. 1997; Zhang et al. 1997; Landisman et al. 2002; Shu and McCormick 2002) and electrical synapses (Landisman et al. 2002; Landisman and Connors 2005). Although intrareticular synapses are weak (Lam et al. 2006), inhibition between reticular neurons could further suppress their target thalamic relay cells due to disinhibition of their neighbors. Gap junctions exist only between nearby reticular neurons and help synchronize their action potential spikes (Landisman et al. 2002; Lam et al. 2006). Both mechanisms will, therefore, further increase the strength of the reticulothalamic pathway and its spatial specificity.
Functional Significance
We have shown that photostimulation of layer 6 neurons commonly evokes disynaptic IPSCs in neurons of the ventral posterior medial nucleus. Photostimulation has the advantage of being able to specifically stimulate the dendrites and somata of cortical neurons, so that our experiments confirm previous similar reports that the corticoreticular pathway effectively activates reticular neurons (Landisman and Connors 2007) and show that such results were not an artifact of antidromic stimulation of thalamoreticular axons. The effects of the corticothalamic feedback pathway on thalamic relay neurons, therefore, can either be excitatory or inhibitory, depending on the state of reticular neurons and how strong they are being activated. Our results also suggest that the strength of the reticular inhibition can actually be modulated by the cholinergic pathway and thus possibly by the arousal level of the brain.
The footprints for the excitatory and inhibitory cortical inputs seem to be overlapped for most neurons of the ventral posterior medial nucleus studied in our experiments, suggesting that the layer 6 cortical feedback acts as a gain control for the relay of lemnsical inputs. However, in a small proportion of neurons, the circuit configuration of the cortical excitatory and inhibitory feedback can also allow for lateral inhibition of relay cells from nearby cortical columns (Temereanca and Simons 2004; Li and Ebner 2007).
Funding
National Institutes of Health (EY-03038 to S.M.S. and NS-058468 to Y.-W.L.).
Acknowledgments
The authors are also grateful to Dr C. C. Lee for the help and discussion during the experiments and manuscript preparation. Conflict of Interest: None declared.
References
- Abbott LF, Chance FS. Drivers and modulators from push-pull and balanced synaptic input. Prog Brain Res. 2005;149:147–155. doi: 10.1016/S0079-6123(05)49011-1. [DOI] [PubMed] [Google Scholar]
- Agmon A, Connors BW. Thalamocortical responses of mouse somatosensory (barrel) cortex in vitro. Neuroscience. 1991;41:365–379. doi: 10.1016/0306-4522(91)90333-j. [DOI] [PubMed] [Google Scholar]
- Arcelli P, Frassoni C, Regondi MC, De Biasi S, Spreafico R. GABAergic neurons in mammalian thalamus: a marker of thalamic complexity? Brain Res Bull. 1997;42:27–37. doi: 10.1016/s0361-9230(96)00107-4. [DOI] [PubMed] [Google Scholar]
- Bourassa J, Pinault D, Deschenes M. Corticothalamic projections from the cortical barrel field to the somatosensory thalamus in rats: a single-fibre study using biocytin as an anterograde tracer. Eur J Neurosci. 1995;7:19–30. doi: 10.1111/j.1460-9568.1995.tb01016.x. [DOI] [PubMed] [Google Scholar]
- Briggs F, Callaway EM. Layer-specific input to distinct cell types in layer 6 of monkey primary visual cortex. J Neurosci. 2001;21:3600–3608. doi: 10.1523/JNEUROSCI.21-10-03600.2001. [DOI] [PMC free article] [PubMed] [Google Scholar]
- Bureau I, von Saint PF, Svoboda K. Interdigitated paralemniscal and lemniscal pathways in the mouse barrel cortex. PLoS Biol. 2006;4:e382. doi: 10.1371/journal.pbio.0040382. [DOI] [PMC free article] [PubMed] [Google Scholar]
- Canepari M, Nelson L, Papageorgiou G, Corrie JE, Ogden D. Photochemical and pharmacological evaluation of 7-nitroindolinyl-and 4-methoxy-7-nitroindolinyl-amino acids as novel, fast caged neurotransmitters. J Neurosci Methods. 2001;112:29–42. doi: 10.1016/s0165-0270(01)00451-4. [DOI] [PubMed] [Google Scholar]
- Chance FS, Abbott LF, Reyes AD. Gain modulation from background synaptic input. Neuron. 2002;35:773–782. doi: 10.1016/s0896-6273(02)00820-6. [DOI] [PubMed] [Google Scholar]
- Chiaia NL, Rhoades RW, Fish SE, Killackey HP. Thalamic processing of vibrissal information in the rat: II. Morphological and functional properties of medial ventral posterior nucleus and posterior nucleus neurons. J Comp Neurol. 1991;314:217–236. doi: 10.1002/cne.903140203. [DOI] [PubMed] [Google Scholar]
- Cox CL, Sherman SM. Control of dendritic outputs of inhibitory interneurons in the lateral geniculate nucleus. Neuron. 2000;27:597–610. doi: 10.1016/s0896-6273(00)00069-6. [DOI] [PubMed] [Google Scholar]
- Datta S, Siwek DF. Single cell activity patterns of pedunculopontine tegmentum neurons across the sleep-wake cycle in the freely moving rats. J Neurosci Res. 2002;70:611–621. doi: 10.1002/jnr.10405. [DOI] [PubMed] [Google Scholar]
- Domich L, Oakson G, Steriade M. Thalamic burst patterns in the naturally sleeping cat: a comparison between cortically projecting and reticularis neurones. J Physiol. 1986;379:429–449. doi: 10.1113/jphysiol.1986.sp016262. [DOI] [PMC free article] [PubMed] [Google Scholar]
- Gentet LJ, Ulrich D. Electrophysiological characterization of synaptic connections between larger VI cortical cells and neurons of the nucleus reticularis thalami in juvenile rats. Eur J Neurosci. 2004;19:625–633. doi: 10.1111/j.1460-9568.2004.03168.x. [DOI] [PubMed] [Google Scholar]
- Gilbert CD. Microcircuitry of the visual cortex. Annu Rev Neurosci. 1983;6:217–247. doi: 10.1146/annurev.ne.06.030183.001245. [DOI] [PubMed] [Google Scholar]
- Golshani P, Liu XB, Jones EG. Differences in quantal amplitude reflect GluR4-subunit number at corticothalamic synapses on two populations of thalamic neurons. Proc Natl Acad Sci USA. 2001;98:4172–4177. doi: 10.1073/pnas.061013698. [DOI] [PMC free article] [PubMed] [Google Scholar]
- Hallanger AE, Levey AI, Lee HJ, Rye DB, Wainer BH. The origins of cholinergic and other subcortical afferents to the thalamus in the rat. J Comp Neurol. 1987;262:105–124. doi: 10.1002/cne.902620109. [DOI] [PubMed] [Google Scholar]
- Hirata A, Aguilar J, Castro-Alamancos MA. Noradrenergic activation amplifies bottom-up and top-down signal-to-noise ratios in sensory thalamus. J Neurosci. 2006;26:4426–4436. doi: 10.1523/JNEUROSCI.5298-05.2006. [DOI] [PMC free article] [PubMed] [Google Scholar]
- Jones EG. The thalamus. Cambridge (UK): Cambridge University Press; 2008. [Google Scholar]
- Killackey HP, Sherman SM. Corticothalamic projections from the rat primary somatosensory cortex. J Neurosci. 2003;23:7381–7384. doi: 10.1523/JNEUROSCI.23-19-07381.2003. [DOI] [PMC free article] [PubMed] [Google Scholar]
- Kim U, Ebner FF. Barrels and septa: separate circuits in rat barrels field cortex. J Comp Neurol. 1999;408:489–505. [PubMed] [Google Scholar]
- Kleinfeld D, Ahissar E, Diamond ME. Active sensation: insights from the rodent vibrissa sensorimotor system. Curr Opin Neurobiol. 2006;16:435–444. doi: 10.1016/j.conb.2006.06.009. [DOI] [PubMed] [Google Scholar]
- Lam YW, Cox CL, Varela C, Sherman SM. Morphological correlates of triadic circuitry in the lateral geniculate nucleus of cats and rats. J Neurophysiol. 2005;93:748–757. doi: 10.1152/jn.00256.2004. [DOI] [PubMed] [Google Scholar]
- Lam YW, Nelson CS, Sherman SM. Mapping of the functional interconnections between thalamic reticular neurons using photostimulation. J Neurophysiol. 2006;96:2593–2600. doi: 10.1152/jn.00555.2006. [DOI] [PubMed] [Google Scholar]
- Lam YW, Sherman SM. Mapping by laser photostimulation of connections between the thalamic reticular and ventral posterior lateral nuclei in the rat. J Neurophysiol. 2005;94:2472–2483. doi: 10.1152/jn.00206.2005. [DOI] [PubMed] [Google Scholar]
- Lam YW, Sherman SM. Different topography of the reticulothalmic inputs to first- and higher-order somatosensory thalamic relays revealed using photostimulation. J Neurophysiol. 2007;98:2903–2909. doi: 10.1152/jn.00782.2007. [DOI] [PubMed] [Google Scholar]
- Land PW, Buffer SA, Jr, Yaskosky JD. Barreloids in adult rat thalamus: three-dimensional architecture and relationship to somatosensory cortical barrels. J Comp Neurol. 1995;355:573–588. doi: 10.1002/cne.903550407. [DOI] [PubMed] [Google Scholar]
- Land PW, Kandler K. Somatotopic organization of rat thalamocortical slices. J Neurosci Methods. 2002;119:15–21. doi: 10.1016/s0165-0270(02)00150-4. [DOI] [PubMed] [Google Scholar]
- Landisman CE, Connors BW. Long-term modulation of electrical synapses in the mammalian thalamus. Science. 2005;310:1809–1813. doi: 10.1126/science.1114655. [DOI] [PubMed] [Google Scholar]
- Landisman CE, Connors BW. VPM and PoM nuclei of the rat somatosensory thalamus: intrinsic neuronal properties and corticothalamic feedback. Cereb Cortex. 2007;17:2853–2865. doi: 10.1093/cercor/bhm025. [DOI] [PubMed] [Google Scholar]
- Landisman CE, Long MA, Beierlein M, Deans MR, Paul DL, Connors BW. Electrical synapses in the thalamic reticular nucleus. J Neurosci. 2002;22:1002–1009. doi: 10.1523/JNEUROSCI.22-03-01002.2002. [DOI] [PMC free article] [PubMed] [Google Scholar]
- Lee KH, McCormick DA. Abolition of spindle oscillations by serotonin and norepinephrine in the ferret lateral geniculate and perigeniculate nuclei in vitro. Neuron. 1996;17:309–321. doi: 10.1016/s0896-6273(00)80162-2. [DOI] [PubMed] [Google Scholar]
- Lee KH, McCormick DA. Modulation of spindle oscillations by acetylcholine, cholecystokinin and 1S,3R-ACPD in the ferret lateral geniculate and perigeniculate nuclei in vitro. Neuroscience. 1997;77:335–350. doi: 10.1016/s0306-4522(96)00481-2. [DOI] [PubMed] [Google Scholar]
- Lee SH, Govindaiah G, Cox CL. Heterogeneity of firing properties among rat thalamic reticular nucleus neurons. J Physiol. 2007;582:195–208. doi: 10.1113/jphysiol.2007.134254. [DOI] [PMC free article] [PubMed] [Google Scholar]
- Li L, Ebner FF. Cortical modulation of spatial and angular tuning maps in the rat thalamus. J Neurosci. 2007;27:167–179. doi: 10.1523/JNEUROSCI.4165-06.2007. [DOI] [PMC free article] [PubMed] [Google Scholar]
- Liu XB, Bolea B, Golshani P, Jones EG. Differentiation of corticothalamic and collateral thalamocortical synapses on mouse reticular nucleus neurons by EPSC amplitude and AMPA receptor subunit composition. Thal Rel Sys. 2008;1:15–29. [Google Scholar]
- McAlonan K, Cavanaugh J, Wurtz RH. Guarding the gateway to cortex with attention in visual thalamus. Nature. 2008;456:391–394. doi: 10.1038/nature07382. [DOI] [PMC free article] [PubMed] [Google Scholar]
- McCormick DA, Prince DA. Acetylcholine induces burst firing in thalamic reticular neurones by activating a potassium conductance. Nature. 1986;319:402–405. doi: 10.1038/319402a0. [DOI] [PubMed] [Google Scholar]
- Mulle C, Madariaga A, Deschenes M. Morphology and electrophysiological properties of reticularis thalami neurons in cat: in vivo study of a thalamic pacemaker. J Neurosci. 1986;6:2134–2145. doi: 10.1523/JNEUROSCI.06-08-02134.1986. [DOI] [PMC free article] [PubMed] [Google Scholar]
- Reichova I, Sherman SM. Somatosensory corticothalamic projections: distinguishing drivers from modulators. J Neurophysiol. 2004;92:2185–2197. doi: 10.1152/jn.00322.2004. [DOI] [PubMed] [Google Scholar]
- Sanchez-Vives MV, Bal T, McCormick DA. Inhibitory interactions between perigeniculate GABAergic neurons. J Neurosci. 1997;17:8894–8908. doi: 10.1523/JNEUROSCI.17-22-08894.1997. [DOI] [PMC free article] [PubMed] [Google Scholar]
- Satoh K, Fibiger HC. Cholinergic neurons of the laterodorsal tegmental nucleus: efferent and afferent connections. J Comp Neurol. 1986;253:277–302. doi: 10.1002/cne.902530302. [DOI] [PubMed] [Google Scholar]
- Shepherd GM, Pologruto TA, Svoboda K. Circuit analysis of experience-dependent plasticity in the developing rat barrel cortex. Neuron. 2003;38:277–289. doi: 10.1016/s0896-6273(03)00152-1. [DOI] [PubMed] [Google Scholar]
- Sherman SM, Guillery RW. Exploring the thalamus and its role in cortical function. Cambridge (MA): The MIT Press; 2006. [Google Scholar]
- Sherman SM, Koch C. The control of retinogeniculate transmission in the mammalian lateral geniculate nucleus. Exp Brain Res. 1986;63:1–20. doi: 10.1007/BF00235642. [DOI] [PubMed] [Google Scholar]
- Shu Y, McCormick DA. Inhibitory interactions between ferret thalamic reticular neurons. J Neurophysiol. 2002;87:2571–2576. doi: 10.1152/jn.00850.2001. [DOI] [PubMed] [Google Scholar]
- Steriade M, Contreras D. Relations between cortical and thalamic cellular events during transition from sleep patterns to paroxysmal activity. J Neurosci. 1995;15:623–642. doi: 10.1523/JNEUROSCI.15-01-00623.1995. [DOI] [PMC free article] [PubMed] [Google Scholar]
- Temereanca S, Simons DJ. Functional topography of corticothalamic feedback enhances thalamic spatial response tuning in the somatosensory whisker/barrel system. Neuron. 2004;41:639–651. doi: 10.1016/s0896-6273(04)00046-7. [DOI] [PubMed] [Google Scholar]
- Turman AB, Morley JW, Zhang HQ, Rowe MJ. Parallel processing of tactile information in cat cerebral cortex: effect of reversible inactivation of SII on SI responses. J Neurophysiol. 1995;73:1063–1075. doi: 10.1152/jn.1995.73.3.1063. [DOI] [PubMed] [Google Scholar]
- Van Horn SC, Erisir A, Sherman SM. Relative distribution of synapses in the A-laminae of the lateral geniculate nucleus of the cat. J Comp Neurol. 2000;416:509–520. [PubMed] [Google Scholar]
- Varela C, Sherman SM. Differences in response to muscarinic activation between first and higher order thalamic relays. J Neurophysiol. 2007;98:3538–3547. doi: 10.1152/jn.00578.2007. [DOI] [PubMed] [Google Scholar]
- Veinante P, Jacquin MF, Deschenes M. Thalamic projections from the whisker-sensitive regions of the spinal trigeminal complex in the rat. J Comp Neurol. 2000;420:233–243. doi: 10.1002/(sici)1096-9861(20000501)420:2<233::aid-cne6>3.0.co;2-t. [DOI] [PubMed] [Google Scholar]
- Yu C, Derdikman D, Haidarliu S, Ahissar E. Parallel thalamic pathways for whisking and touch signals in the rat. PLoS Biol. 2006;4:e124. doi: 10.1371/journal.pbio.0040124. [DOI] [PMC free article] [PubMed] [Google Scholar]
- Zarrinpar A, Callaway EM. Local connections to specific types of layer 6 neurons in the rat visual cortex. J Neurophysiol. 2006;95:1751–1761. doi: 10.1152/jn.00974.2005. [DOI] [PubMed] [Google Scholar]
- Zhang SJ, Huguenard JR, Prince DA. GABAA receptor-mediated Cl- currents in rat thalamic reticular and relay neurons. J Neurophysiol. 1997;78:2280–2286. doi: 10.1152/jn.1997.78.5.2280. [DOI] [PubMed] [Google Scholar]


