

Abstract
Laser microsurgery and finite element modeling are used to determine the cell-level mechanics of the amnioserosa—a morphogenetically crucial epithelium on the dorsal surface of fruit fly embryos (Drosophila melanogaster). In the experiments, a tightly focused laser ablates a subcellular hole (1 μm in diameter) that passes clean through the epithelium. The surrounding cells recoil from the wound site with a large range of initial recoil velocities. These depend on the embryo's developmental stage and the subcellular wound site. The initial recoil (up to 0.1 s) is well reproduced by a base finite element model, which assumes a uniform effective viscosity inside the cells, a constant tension along each cell-cell boundary, and a large, potentially anisotropic, far-field stress—one that far exceeds the stress equivalent of the cell-edge tensions. After 0.1 s, the experimental recoils slow dramatically. This observation can be reproduced by adding viscoelastic rods along cell edges or as a fine prestressed mesh parallel to the apical and basal membranes of the cell. The mesh also reproduces a number of double-wounding experiments in which successive holes are drilled in a single cell.
Introduction
The ultimate causative factor in biological development is genetics, but the proximate cause of morphogenetic movements is physical—namely, coordinated changes in the mechanical state of individual cells. The mechanics of various developmental events have been investigated using a range of computational models (1–10). These models certainly reproduce the shapes and forms of morphogenetic episodes, but the solutions are generally nonunique (3). Such models are hypotheses to be challenged and refined with complementary experiments (11). In the past decade, laser microsurgery has emerged as a primary means of model validation (12–23). In this report, we use the results of laser hole-drilling experiments (24) to challenge and refine cell-level finite element (FE) models for an embryonic epithelium (4,10).
In laser hole-drilling (24), a single laser pulse is used to rapidly ablate a subcellular hole—one that goes clean through the epithelium. The surrounding cells recoil away from this hole, relaxing the preablation, morphogenetic stresses. By carefully tracking the recoils (on millisecond timescales, with submicrometer precision and for dozens of embryos), one can estimate how stress is distributed. By staging the embryos, one can infer how this stress distribution changes during development.
Our initial hole-drilling experiments (24) were performed on Drosophila embryos during the morphogenetic process of dorsal closure (25). These experiments clearly demonstrate that the amnioserosa (a one-cell thick epithelium) cannot be modeled as a two-dimensional cellular form nor as a homogeneous, viscoelastic sheet. Simple form models are eliminated because strong recoils follow ablation even at sites away from cell-cell interfaces; and homogeneous sheet models are ruled out because recoils differ quantitatively between wound sites. Clearly, an appropriate model needs to account for mesoscopic features. At the very least, such models should incorporate distinct cytoplasmic and cortical regions for each cell. A comparison of experimental results and matching computer simulations provides strong constraints on the features that a model must include, and strong inferences with regard to the in vivo mesoscopic mechanics.
Our strategy is to first model the initial recoil velocities. The initial phases of recoil are those most tightly linked to the preablation distribution of stress. We then model the subsequent recoil kinematics and changing cell geometry to assess the cells' viscoelastic behavior. At longer times, the cells transition from passive mechanical recoil to active modification of the cytoskeleton during wound healing (at ∼30 s). In this report, we are interested in the passive mechanical recoil, and thus limit our comparison to the first 10 s after ablation.
For this early phase of mechanical recoil, we made five key experimental findings (24):
-
Observation 1.
The mean initial recoil velocity for cell-center wounds, 〈v0,C〉, is nonzero and different from that for cell-edge wounds, 〈v0,E〉. In early dorsal closure, 〈v0,C〉/〈v0,E〉 = 0.67 ± 0.10. In late dorsal closure, 〈v0,C〉/〈v0,E〉 = 1.27 ± 0.19.
-
Observation 2.
Both 〈v0〉 values have a dependence on recoil direction that positively correlates with the angular distribution of cell-edge orientations. Throughout dorsal closure, this angular distribution is triply-peaked due to the quasihexagonal packing of cells. The correlation with 〈v0〉 becomes apparent in late dorsal closure when the cells become diamond-shaped and stretch in the anterior-posterior direction (suppressing the mediolateral peak).
-
Observation 3.
Even with stage-matched embryos and consistent target sites, the recoil velocity distributions are wide—log-normally distributed with standard deviations (SD) comparable to the means.
-
Observation 4.
Over the first 10 s, the recoil displacements are biphasic—roughly linear to ∼0.1 s and displacements of 1–2 μm—then follow a weak power law (exponent 0.3–0.4) for the next two decades.
-
Observation 5.
If a previously wounded cell is ablated a second time at a different location, then the cell expands further. If an adjacent cell is ablated, it also expands strongly.
This set of observations constitutes our targets for matching the experiments and simulations. Observations #1–3 involve only the initial recoil velocity, and are thus used to determine the preablation mechanical state of the epithelium. This state can be reproduced with a simple model—cells with constant volume, an effective cytoplasmic viscosity, and uniform tension along all cell-cell interfaces (i.e., a γ-μ model). Observations #4 and 5 then involve subsequent wound expansion and are used to determine the epithelium's viscoelastic properties. In most cases, these properties can be coarse-grained by placing viscoelastic rods along the cell edges; however, Observation #5 requires an explicit model of the in-plane, intracellular cytoskeleton.
Materials and Methods
Laser microsurgery experiments
The setup for imaging and laser ablation has been described in detail previously (24). Briefly, we image the cell outlines of living Drosophila embryos expressing a GFP-cadherin chimera (26) using a confocal microscope (model LSM410, Carl Zeiss, Oberkochen, Germany). We ablate localized regions of the embryonic epithelium using the third harmonic (355 nm) of a Q-switched Nd:YAG laser (model Minilite II, Continuum, Santa Clara, CA). The ablated hole has a diameter of ∼1 μm and spans the full thickness of the epithelium (5–7 μm). We track the subsequent recoils with either full frame images (2–8 s/image) or kymographs (15.7 ms/line). Compared to the recoil measurements, the ablation process is essentially instantaneous, <100 μs (27).
Finite element models
We simulated the response to laser hole-drilling using custom-written, cell-level finite element (FE) models (4,10). As shown in Fig. 1, an epithelium is modeled as a two-dimensional patch of tightly packed cells. Each cell is a polygon with edges representing cell-cell interfaces and nodes at cellular triple junctions. In the base model, each cell has three mechanical contributors.
Figure 1.
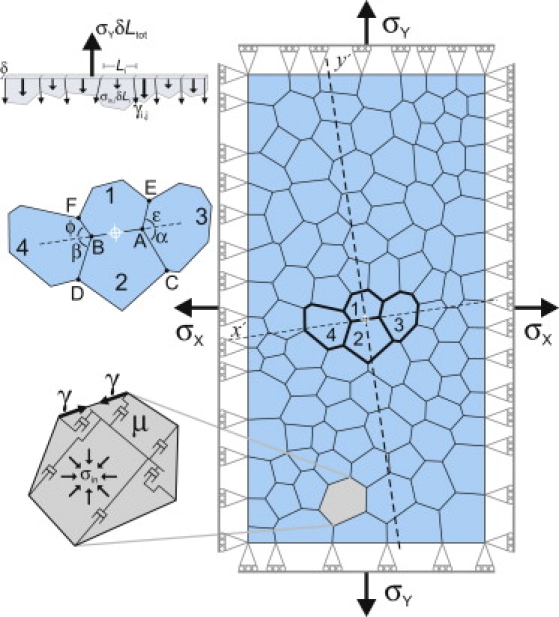
Cell-level finite-element representation of an epithelium: (upper inset) force balance along one edge of a cell patch; (middle) the local wound geometry; and (lower) the model for each cell.
First, each cell-cell interface has a uniform tension, γ. This tension represents both contraction of circumferential microfilament bundles and a tangential equivalent for cell-cell adhesion (28).
Second, each cell has a system of internal dashpots sized to model a uniform equivalent viscosity, μ (10). This effective viscosity represents deformability of the cytoplasm and its embedded cytoskeletal networks.
Third, each cell is subject to an area constraint (i.e., no dilatation in the plane) that yields an internal, in-plane and isotropic cell stress σin. This stress encompasses both pressure from the incompressibility of cytoplasm and in-plane apical/basal tensions from the cortical cytoskeleton (29).
Although this base model exhibits system-level viscoelastic behavior (30,31), the full recoil kinematics are only reproduced by adding explicit viscoelastic rods—either along cell edges or as a prestressed intracellular mesh. These rods are necessary because the experiments involve very high strain rates, 1–5 s−1 (24). Previous uses of the base model focused on normal morphogenetic movements in which strain rates are <0.5 h−1 (32,33).
A simulated epithelium also requires appropriate boundary conditions—including constraints that keep the patch rectangular and constant external stresses σx and σy that are applied via external forces (Fig. 1). These forces represent the far-field stress in the embryo, i.e., the forces on the patch from cells outside the patch. This far-field stress is a major determinant of epithelial thickness (29) and of the simulated recoil behavior below. Simulations in which the rectangular constraint was replaced by periodic boundary conditions gave results nearly identical to the ones reported here.
Computationally, the dynamic behavior of the model is described by (4,34)
| (1) |
which assumes low Reynolds number conditions. In this equation, Δt is a time step, C is the damping matrix, Δu is a vector of incremental node displacements, and f is a vector that represents the nonviscous forces acting on each node. C and f are calculated from the current cellular geometry. This system of equations is augmented by applicable constraints using Lagrange multipliers (including each σin for the cell area constraints).
The augmented system of equations is solved at each time step to yield values for the Lagrange multipliers and incremental displacements Δu. The node positions are updated and the process repeated, allowing the potential accumulation of large deformations. The model also allows cells to rearrange by changing the topology of the node connections when a cell edge becomes shorter than a given threshold (4).
Dimensionless units
To compare the model to experiments, we use the following set of dimensionless quantities:
| (2) |
| (3) |
| (4) |
| (5) |
| (6) |
In these equations, δ is the thickness of the epithelium and ρ is the interface density—defined as the total length of cell-cell interface per unit area. All simulation results presented here are dimensionless.
For experiments, one can readily measure δ and compute ρ from suitable images. The value of α can then be estimated by comparing measured recoil velocities to dimensionless simulated velocities. With α, ρ, and δ, one can then convert the interfacial tension and stresses in the best-matching simulations to dimensioned ratios of each over viscosity, μ.
The complete recoil simulations include explicit viscoelastic rods characterized by cross-sectional area A, Young's modulus E, and viscosity η. These parameters are also nondimensionalized:
| (7) |
| (8) |
| (9) |
The modulus and viscosity always appear together with the cross-sectional area, but one can still use the experimental α, ρ, and δ to convert ΦΨ and Φξ from the best-matching simulations to their dimensioned counterparts.
Results and Discussion
Fig. 2, A and B, shows a typical hole-drilling experiment. In this case, the laser was targeted to the interface between cells 1 and 2. After ablation, the hole gradually expands as the surrounding cells change shape and recoil away from the wound site.
Figure 2.
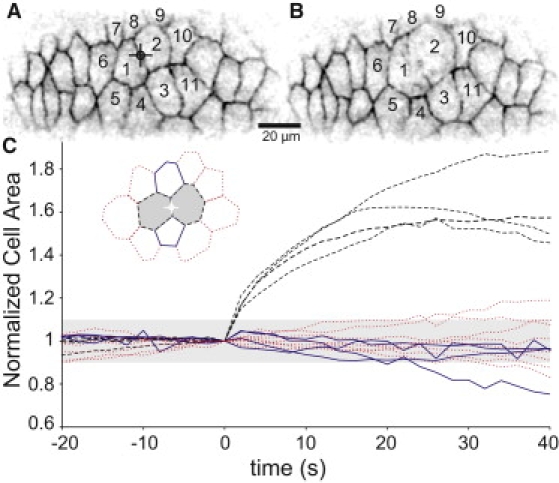
Experimental results for laser hole-drilling. (A and B) Confocal fluorescent images (inverted) of an embryonic epithelium before and 30 s after ablation at the targeted crosshairs. (C) Changes in the normalized apical surface area of nearby cells. In the graphical legend, the border of each cell type matches its line in the plot: (dashed) cells directly sharing the ablated border (e.g., cells 1 and 2); (solid) nearest neighboring cells (e.g., cells 3 and 8); and (dotted) next-nearest neighbors (e.g., cells 4–7 and 9–11). The plot compiles results from four experiments. The lightly-shaded region marks area changes of ±10%.
Experimental evidence for a cell area constraint
Before discussing the simulation results, we present one previously unreported experimental result. Fig. 2 C shows postablation changes in cell areas. The ablated cells expand by ∼40% in the first 10 s (and up to 90% over 20–40 s). In contrast, the neighboring cells initially maintain a nearly constant area (within ±6% in the first 10 s). At longer times, adjacent cells may increase or decrease in area, but these changes are mostly consistent with the preablation trend for each cell. The only strong exception is for cells at the endpoints of an ablated edge (e.g., cell 3 in Fig. 2 A). Regardless of preablation behavior, these cells tend to shrink ∼10% over 30 s.
Since cells are mostly water, they should be incompressible, and thus maintain constant volume; however, the experimental results go a step further. The cells around a wound change shape, but maintain a nearly constant platform area, as if subject to a constraint on apical surface area (or volume and height). This constraint does not apply once recoil slows and wound healing begins, but it is a reasonable approximation during the relatively short timescales (<10 s) modeled here. It is also consistent with our previous observation that recoiling cells do not shear normal to the epithelial plane (24). Combined, the two observations justify modeling the initial recoil using only two dimensions.
Simulating a hole-drilling experiment
Considering the results above, we simulated hole-drilling as follows. An initial field of cells (N = 110) was created by Voronoi tessellation of a rectangular region. This cell patch was then equilibrated using the FE model at a specific external stress (Σx and Σy). We ran the simulation until cell motion ceased (typically τ > 50), indicating that the cells were in a local equilibrium. To simulate a cell-center wound, we removed the area constraint on a single cell (which makes σin = 0 for that cell, releasing both the fluid pressure and in-plane apical/basal tensions). To simulate a cell-edge wound, we set the tension of the ablated edge to zero and removed the area constraint on the two adjoining cells. We then continued the FE simulation with the same external stress. For the postablation simulation, we chose a very small time step so that even 10-times larger time steps yield the same initial node velocities (within 0.1%).
Fig. 3 presents results from six hole-drilling simulations that used the base model and an isotropic far-field stress. This dimensionless stress, Σ, strongly influences the spatial recoil pattern. The impact is most obvious for cell-center wounds (Fig. 3, A–C). For Σ = 0, the ablated cell collapses; for Σ = 1, there is almost no recoil; and for Σ = 2, the ablated cell expands. This behavior follows from the internal cell stresses, Σin. When Σ = 0, an equilibrium cell patch is self-supporting; the cell edge tensions are balanced by a mean internal stress 〈Σin〉 that is negative or compressive. This is equivalent to a positive pressure and is necessary to prevent cell collapse. When a cell is wounded, its internal stress goes to zero and it does collapse. When Σ = 1, the external stress just balances the cell edge tensions; equilibrium is maintained without internal cell stress, i.e., 〈Σin〉 ≅ 0. Under these conditions, wounding a cell causes a negligible change in its internal stress, so there is almost no recoil. When Σ = 2, the external stress exceeds the cell edge tensions, so equilibrium requires a positive or tensile 〈Σin〉 to prevent the cells from expanding. When a cell is wounded, its internal tensile stress goes to zero and it does expand. In general, 〈Σin〉 = Σ − 1, so cell-center wounds collapse when Σ < 1 and expand when Σ > 1. As noted earlier, the internal stress Σin includes both fluid pressure in the cell interior and in-plane tension along the apical and basal surfaces. A positive or tensile internal stress implies apical/basal tensions that exceed the in-plane forces from fluid pressure.
Figure 3.
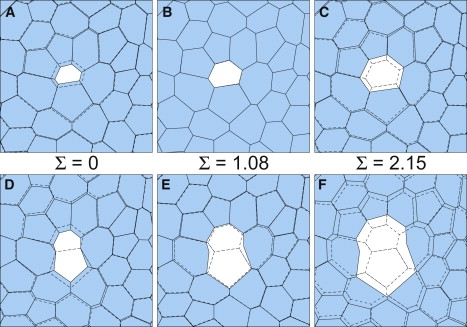
Changes in cell shape just after ablation—simulation results for cell-center wounds (A–C) and cell-edge wounds (D–F). The cell shapes before ablation (dashed) are superimposed on those just after ablation (τ = 1.12). The ablated cell(s) are unshaded. The isotropic external stress Σ increases from left to right.
For cell-edge wounds (Fig. 3, D–F), the internal cell stress effects are superposed with a loss of tension along the wounded edge. Even at Σ = 0, the loss of tension along the wounded edge outweighs the loss of internal compressive stress, at least at the ends of the ablated edge. These nodes always recoil away from the wound site, but only roughly parallel to the ablated edge. Other nodes in the immediate area may actually move toward the ablation site. The result is a strongly anisotropic recoil pattern. When Σ = 1, all the nodes recoil away from the ablation site, but the pattern is still anisotropic. The nodes at the ends of the ablated edge have by far the largest initial recoil speeds. When Σ = 2, all the nodes again move away, but now with a more isotropic pattern.
These simulations qualitatively match experimental results, but only when the simulation has Σ > 1. For example, in experiments on amnioserosa cells during dorsal closure, the cells never collapse after cell-center ablation. This suggests that these cells carry significant in-plane, intracellular tension. Furthermore, experimental cell-edge wounds typically lead to weakly anisotropic recoil patterns (Fig. 2, A and B). These patterns become more anisotropic in late dorsal closure when the cells themselves become anisotropic (considered in more detail below).
Simulated distributions of initial recoil velocities
The spatial recoil patterns are informative, but difficult to compare directly to experiments because the exact cell geometries do not match. We thus undertook a systematic study of the simulated recoil velocity distributions. We generated 100 different random Voronoi tessellations and equilibrated this set with nine different external stresses from Σx = Σy = 0–5.38. We then applied a cell-center or cell-edge wound to the cell(s) closest to the center of each cell sheet.
For each simulation, we calculated initial recoil velocities, ν0, for two nodes. For cell-edge wounds, the chosen nodes were those at the ends of the ablated edge. For cell-center wounds, we randomly chose two nodes on opposite sides of the ablated cell. Since the experimental results were limited to a projection of the recoil velocity onto a single image line, we report only the parallel component of the simulated recoil velocities (i.e., parallel to the line connecting the chosen nodes). Positive velocities correspond to recoil away from the wound site.
Fig. 4 A shows histograms of the initial recoil velocities. In all cases with Σ > 0, the mean ν0 for cell-edge wounds is greater than that for cell-center wounds, 〈ν0,E〉 > 〈ν0,C〉. Nonetheless, the distributions always overlap. As Σ increases, 〈ν0,E〉 and 〈ν0,C〉 both increase, the distributions become wider, and the degree of overlap increases. The increases in 〈ν0,C〉 and 〈ν0,E〉 are linear functions of Σ with nearly identical slopes (Fig. 4 B):
| (10) |
| (11) |
Figure 4.
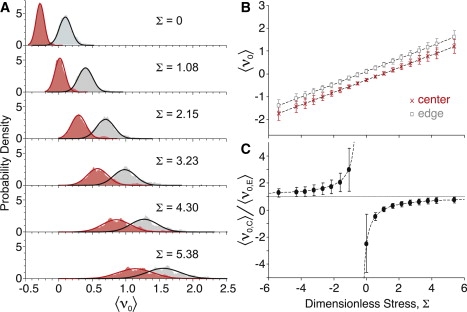
Dependence of recoil velocity on external stress Σ. (A) Kernel density estimates of the ν0-distributions (N = 100 for each): (dark red) cell-center wounds; (light gray) cell-edge wounds; (solid lines) best-fit normal distributions. (B) Mean recoil velocity: (□) cell-edge and (×) cell-center wounds. (C) Ratio of the mean recoil velocities.
Linear regression of the simulation results yields mC = 0.2743 ± 0.0001, mE = 0.2793 ± 0.0002, and ν1 = 0.3870 ± 0.0004. Extrapolation of Eqs. 10 and 11 yields negative velocities for cell-center wounds when Σ < 1 (i.e., the cell collapses) and for cell-edge wounds when Σ < −0.4. Note that a negative Σ still represents a tensile external stress, but with negative interfacial tensions; Σ is negative due to the 1/γ nondimensionalization factor. A cell patch with γ < 0 implies cell-cell interfaces that are under an effective compression—possibly due to actin polymerization or very strong cell-cell adhesion. Adhesion behaves like a compressive force because the interfacial energy becomes more favorable as the interface expands (28). We confirmed the extrapolation with a set of modified simulations. It is not possible to equilibrate a cell patch when γ < 0 because the cells deform to maximize the interfacial length, a so-called star instability. We thus used an alternative strategy. We equilibrated each cell patch with γ > 0, and then inverted γ to leave the cell patch in an unstable equilibrium just before wounding. The resulting 〈ν0,C〉 and 〈ν0,E〉 fall along the predicted line.
Overall, there is a one-to-one correspondence between Σ and the ratio f = 〈ν0,C〉/〈ν0,E〉. As |Σ| increases, this ratio asymptotically approaches one from above or below (Fig. 4 C). These limits correspond to interfacial tensions that are negligible compared to the internal cell stresses.
Quantitative comparison to experimental means
The ratio f is a dimensionless number readily calculated from both simulations and experiments. For experiments in early dorsal closure, f = 0.67 ± 0.10. The simulation in Fig. 4 that most closely matches this result is Σ = 3.76. More specifically, we can use Eqs. 10 and 11 to estimate the best match as Σ∗ = 3.8 ± 1.3 (so 〈Σin〉 = 2.8 ± 1.3). This is a somewhat surprising result. It implies that the tensions along cell-cell interfaces only account for one-quarter of the epithelium's mesoscopic stress. The balance is carried by large intracellular tensions, Σin, that are parallel to each cell's apical and basal surfaces.
Finding Σ∗ is the key step in quantitatively matching simulations and experiments. By comparing the experimental recoil velocities to those simulated at Σ∗, we estimate a conversion factor that nondimensionalizes the experimental results (Eq. 3). For early dorsal closure, this factor is α = 17 ± 8 μm/s. We estimate the remaining conversion factors from images of amnioserosa cells. In early dorsal closure, the epithelial thickness is δ = 5.7 ± 0.3 μm and the interface density is ρ = 0.147 ± 0.002 μm−1.
Using these factors and Eqs. 2–6, we assign dimensioned values for the simulated forces and stresses. For early dorsal closure, we estimate the following ratios for interfacial tension, applied stress, and internal cell stress:
and
To convert these ratios to forces and stresses, we need an estimate of cytoplasmic viscosity. Such estimates span several orders of magnitude (35), so one must choose an estimate that closely matches the relevant probe size and strain rate. For hole-drilling experiments, the relevant size is a few micrometers and the maximum strain rate is 1–5 s−1. For these scales, we use the effective viscosity of cytoplasm in sea urchin embryos, roughly 10 Pa·s (36). Note that this value is more than 1000× the viscosity of water (35) because it includes plastic deformation of the cytoskeleton (37). Using this viscosity, we find
and
The tension γ is in the same range as the 5.4 nN value measured in amphibian embryos (30). The stresses are well within the range observed during the collective migration of epithelial cells (38) and correspond to in-plane load resultants of 0.6 and 0.4 mN/m that are well within the range measured during amphibian neurulation (39).
If we apply the same analysis to late dorsal closure, we encounter a situation where 〈ν0,C〉 is larger than 〈ν0,E〉; however, a t-test of the ν0-distributions in late dorsal closure shows that this difference is not significant (P = 0.4). One could thus model late dorsal closure using the best-matching Σ∗ = −5.5 ± 3.6, which implies cell edges that are under compressive stress as described above, or using the limit γ→0 and Σ∗→∞, which implies negligible interfacial tension. Both are used to calculate the conversion factors and estimated forces in Table 1. Obviously, the γ-estimates differ for the two cases, but the estimated stresses are very similar. Interestingly, they are 1.5–2 times larger than those found for early dorsal closure. Below, we model late dorsal closure with negligible γ by using Σ∗ = 5380; results for Σ∗ = −5.5 are included in Fig. S2 and Fig. S3 in the Supporting Material.
Table 1.
Conversion factors and estimated parameters from the best matches of simulations and experiments
| Early dorsal closure | Late dorsal closure | ||
|---|---|---|---|
| 〈ν0,C〉/〈ν0,E〉 | 0.67 ± 0.10 | 1.27 ± 0.19 | 1 |
| Σ∗ | 3.8 ± 1.3 | −5.5 ± 3.6 | ∞ |
| α | 17 ± 8 μm/s | −14 ± 8 μm/s | 0 |
| ρ | 0.147 ± 0.002 μm−1 | 0.195 ± 0.001 μm−1 | |
| δ | 5.7 ± 0.3 μm | 6.7 ± 0.3 μm | |
| αρ | 2.5 ± 1.2 s−1 | −2.7 ± 1.5 s−1 | 0 |
| γ/μ | 194 ± 92 μm2/s | −184 ± 104 μm2/s | 0 |
| σ/μ | 9.6 ± 5.5 s−1 | 14.7 ± 12.7 s−1 | 15.5 ± 1.2 s−1 |
| σin/μ | 7.1 ± 5.5 s−1 | 17.4 ± 12.7 s−1 | 15.5 ± 1.2 s−1 |
| γ | 1.9 ± 0.9 nN | −1.8 ± 1.0 nN | 0 |
| σ | 96 ± 55 Pa | 147 ± 127 Pa | 155 ± 12 Pa |
| σin | 71 ± 55 Pa | 174 ± 127 Pa | 155 ± 12 Pa |
The third column corresponds to the limit γ→0.
Anisotropic far-field stress
The late dorsal closure experiments also observed an anisotropy in the recoil velocities; v0 was largest when recoil was tracked within ±30° of the anterior-posterior (AP) direction. The cell edges were also oriented anisotropically, with peaks in the histogram of cell-edge orientations near ±30°. The recoil velocity was thus correlated with the angular density of cell edges (24).
To reproduce these effects, we simulated recoils after equilibrating cell patches under anisotropic far-field stress: Σx,y = 5380 ± ΔΣ, where ΔΣ is chosen from a log-normal distribution (mean = 250, SD = 200). When the cells are not allowed to rearrange, this anisotropy matches up the observed and simulated elongation of cells (as measured by = 1.43 ± 0.36 where Imax and Imin are the cell's principle moments of inertia). In these simulations, the recoil velocities ν0,C and ν0,E are anisotropic and largest in the direction of maximum external stress; however, the cell edges show no anisotropic alignment (Fig. 5, A and D).
Figure 5.
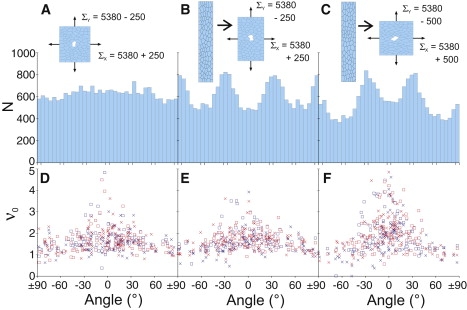
Anisotropy in the recoil velocity ν0 under anisotropic external stress Σ. (B and C) Cell patch was first stretched vertically as shown. (A–C) Histograms of cell-edge orientations. (D–F) ν0 versus direction for cell-edge (□) and cell-center (×) wounds. For cell-edge wounds, the tracked direction was always parallel to the ablated edge. Similar results for γ < 0 are presented in Fig S2.
We find that the cell edges can be anisotropically aligned by first stretching the cell patches in the y-direction (using Σy,x = 5380 ± 360) while allowing the cells to rearrange, and then reequilibrating the stretched patches without allowing further rearrangement at Σx,y = 5380 ± ΔΣ as above. This procedure yields anisotropic recoil velocities and peaks in the cell-edge orientation histogram near ±30° and 90° that belie the underlying trend toward a quasihexagonal arrangement (Fig. 5, B and E). If the ΔΣ anisotropy is doubled, the recoil velocities become more anisotropic and more cell edges align near ±30° at the expense of those near 90° (Fig. 5, C and F). Interestingly, amnioserosa cells undergo a similar procedure during development. During germ band elongation, they are drastically stretched in the mediolateral (ML) direction. During subsequent germ band retraction and dorsal closure, they contract along ML and stretch along AP until they are elongated in the AP direction. These simulations show that v0 may correlate with density of cell edges, but only under specific stress histories.
Primarily, these simulations suggest that the v0 anisotropy is a reporter of stress anisotropy. If so, then amnioserosa cells in late dorsal closure should be under greater stress in the AP direction. To test this, we ablated 26-μm-long, 2-μm-wide lines in the amnioserosa along either the AP or ML direction. Both wounds expanded considerably, but even at maximum expansion, AP-wounds remain more extended than ML-wounds—κ = 1.62 ± 0.37 (N = 12) compared to 1.40 ± 0.21 (N = 10)—confirming the predicted direction of anisotropy.
Quantitative comparison to experimental distributions
For each stage and wound location, the experimental ν0-distributions are quite wide and strongly log-normal (Fig. 6, A and A′). For early (late) dorsal closure, SD = 60–70% (50–60%) of the means. In contrast, the best-matching simulated distributions are narrower (SD = 18–35%) and nearly normal (Fig. 6, B and B′). The 18–35% variation is correlated with the local geometry around each wound (Note S1 in the Supporting Material), but this still leaves a large and not-yet-modeled source of variation.
Figure 6.
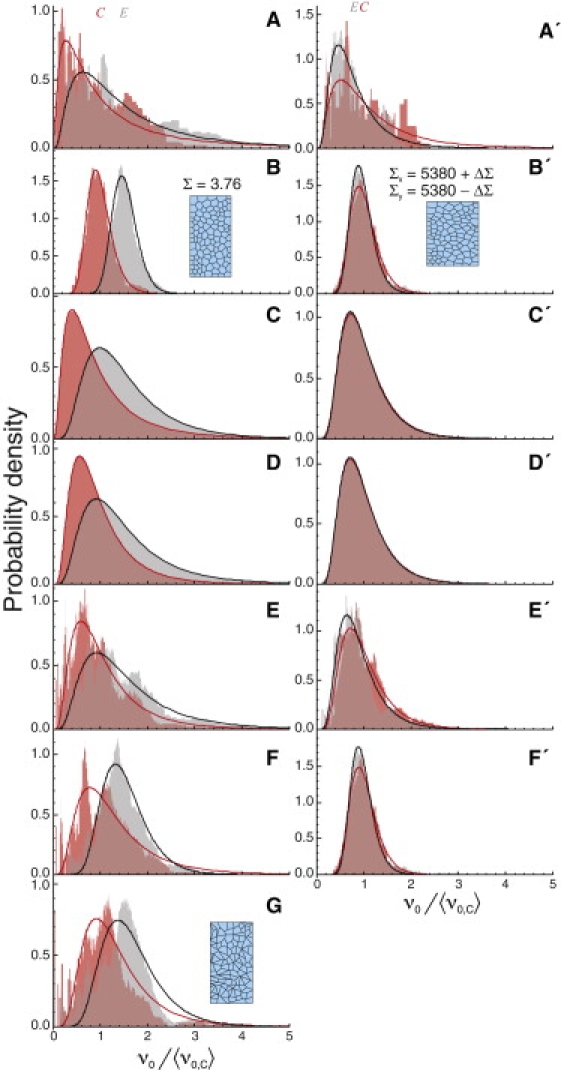
Comparison of ν0-distributions for experiments and simulations: (dark red) cell-center wounds; (light gray) cell-edge wounds; (solid lines) best-fit log-normal distributions. 〈ν0,C〉 and 〈ν0,E〉 are marked by the red C and gray E, respectively. Unprimed labels refer to early dorsal closure, primed to late: (A and A′) experimental recoil velocities; (B and B′) best-matching uniform simulations; (C and C′) addition of interembryo log-normal variations in Σ; (D and D′) addition of interembryo log-normal variations in all force/viscosity ratios; (E and E′) addition of intraembryo log-normal variations in viscosity; (F and F′) nonequilibrium simulations with intraembryo log-normal variations in the interfacial tensions γ; and (G) simulations with intraembryo log-normal variations in γ that were reequilibrated before wounding. The sample patches show the cell geometry after equilibration at the noted stress Σ, including the misshapen cells after reequilibration with variable γ in panel G. For late dorsal closure, similar results with γ < 0 are presented in Fig S3.
The extra variability could arise from interembryo differences in either the external stress Σ or in all force/viscosity ratios. We have estimated the effects of each using the previous simulations and kernel density estimates (40). We find reasonable matches to the experimental ν0-distributions when the kernel corresponds to a log-normal distribution of Σ or 1/μ (with SD = 60% for early dorsal closure, 40% for late). The two effects lead to simulated distributions that are only subtly different (Fig. 6, C and C′, and D and D′).
The extra variability could also arise from intraembryo variations in the local viscosity. To investigate, we ran additional simulations in which the viscosity of each cell was chosen randomly. The best match to experiments occurs when each μ is chosen from a log-normal distribution with SD = 120% for early dorsal closure, 70% for late (Fig. 6, E and E′). To match the mean ν0 values, each μ-distribution had a mean of (1 + SD2)/3 times the previously uniform viscosity (so three randomly chosen values yield 〈1/μ1 + 1/μ2 +1/μ3〉 = 1/μuniform).
The extra variability might also arise from intraembryo variations in the interfacial tension γ, but this is not a realistic possibility. For late dorsal closure models in the limit Σ∗→∞, variation in the negligible γ does not alter the ν0-distribution (Fig. 6 F′). For early dorsal closure models with finite Σ∗, changing the local γ changes the equilibrium configuration. Wounds to these nonequilibrium patches can match the experimental ν0-distributions, but only with very wide γ-distributions (log-normal with SD = 120%, Fig. 6 F). Such wide distributions imply cell patches that are very far from equilibrium—an unlikely situation, as the speeds of preablation cell movements are typically <1% of the postablation recoil velocities. If the cell patches are instead reequilibrated, the cells become strongly misshapen with lots of acute angles and 4–6-cell junctions (Fig. 6 G), inconsistent with experimental images. Note that late dorsal closure models based on Σ∗ = −5.5 have similar problems, but the star-instability prohibits reequilibration and leaves only the unlikely possibility of strongly nonequilibrium configurations.
One untested possibility is intraembryo variations in the local in-plane stress Σin. Such variations have been observed during collective cell migration on adherent substrates (38) and have been proposed to account for the pulsations of amnioserosa cells during early dorsal closure (41). Our current model cannot test this effect; the Σin are not set as parameters, but are determined at each step via Lagrange multipliers. Even so, one would expect variations in Σin to also lead to problematic nonequilibrium configurations unless the cells also exerted variable traction forces on an underlying substrate. There is no evidence yet for such traction in amnioserosa cells.
Beyond the initial recoil velocity
To compare the simulated and experimental recoils at longer times, we used the conversion parameters in Table 1 to nondimensionalize the experimental data. In Fig. 7, A and B, we compare selected simulations to the dimensionless recoil displacements from early dorsal closure (mean ± 1 SD). As expected, the base model with Σ∗ = 3.8 and no viscoelastic elements fails spectacularly. The Σ∗-simulation recoil is nearly linear, but the experimental recoils are biphasic with a transition from linear to weak power-law behavior at τ ∼0.3. This problem is also evident in the cell contours of Fig. 7, C and D. In experiments, the two ablated cells expand just a fraction of a cell diameter. For the base Σ∗-simulation, the wound expands without limit.
Figure 7.
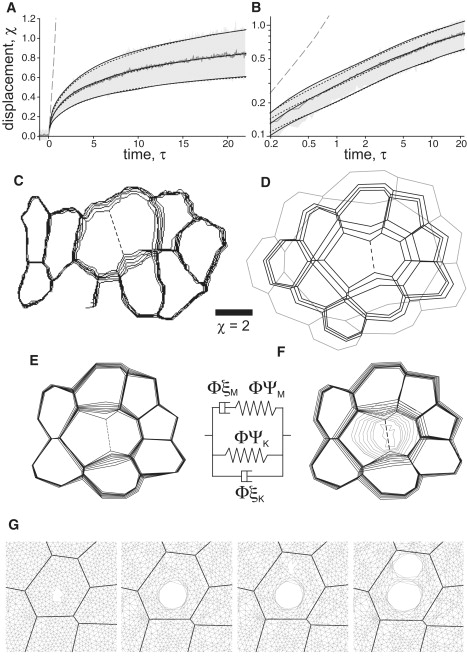
Reproducing the postablation recoil kinetics using viscoelastic elements. (A) Dimensionless displacement versus time, after cell-edge wounds: (jagged gray line, shaded region) experimental mean ± one SD in early dorsal closure; (long-dashed line) simulated recoil with no viscoelastic elements; (short-dashed lines) simulated recoils using viscoelastic rods along cell edges; or (solid lines) as a prestressed intracellular mesh. Σ = 3.76 in each. (B) Log-log version of same. (C–F) Time-dependent cell outlines around expanding wound sites: (C) experimental cell-edge wound; (D) simulation with no viscoelastic elements; (E) simulation with viscoelastic rods along cell edges; and (F) as a prestressed intracellular mesh. The lighter shaded lines outline the expanding hole in the mesh. Both panels E and F correspond to the best fits to the mean experimental recoil in panel A. The sequential outlines include τ = 0 and a geometric sequence of times from τ = 2.5–40 for the experiment (i.e., 1–16 s) and τ = 0.28–17.85 for the simulations, except panel D, which stops at τ = 1.12. The dimensionless scale bar applies to all four sets of outlines. Animated versions are available as Movie S1, Movie S2, and Movie S3. (G) Simulated recoil in a cell subjected to two successive wounds. The second panel represents the equilibrium state reached after the first ablation; the fourth panel is the new equilibrium state after the second ablation. In terms of area, the second expansion is ∼35% as large as the first. The standard viscoelastic rod element is shown between panels E and F and the parameters of each simulation are listed in Table S1.
The base model is clearly lacking necessary viscoelastic elements. For cell edges to change length, they must add or remove plasma membrane, bind or unbind cell adhesion molecules and rearrange the attached cortical cytoskeleton. All three are time-dependent processes with measured viscoelastic behavior (42,43). We thus added general viscoelastic rods (a Kelvin and Maxwell element in parallel) to either the cell edges or as a prestressed intracellular mesh. Cell-edge wounds were modeled as before, plus removal of the viscoelastic rod along the ablated edge or a small region of the meshwork (equivalent to a 2-μm-diameter hole). We manually optimized the viscoelastic parameters of each model to yield very good fits (R2 > 0.999) to the mean, upper and lower bounds of the experimental recoils (Fig. 7, A and B). The corresponding cell contours are shown in Fig. 7, E and F. Although the models include linear elements only, they readily reproduce the observed power-law behavior. This excellent match is possible because the behavior is limited to two time decades—which can be well approximated with just two exponentials. The model certainly diverges from power-law behavior at longer times, but so do the experiments (24). Interestingly, the mesh simulations best match experiments when the mesh prestress is ∼Σin.
Both viscoelastic models fit the experimental recoils, so the one with cell-edge elements is a coarse-grained approximation to the finer mesh; however, one can distinguish the two models in double-wounding experiments (24). Experimentally, if two holes are drilled at the same location, nothing happens after the second ablation. If the second hole is slightly displaced from the first, but is still in the same cell, then the wounded cell undergoes a second smaller expansion. In experiments that fluorescently label filamentous actin, one can actually see two holes in the cell's apical actin network (24). These successive expansions are only reproduced by the intracellular mesh (Fig. 7 G). As in the fits above, the models best match the experiments when the mesh is prestressed to ∼Σin.
Conclusions
All of the experimental observations of hole-drilling experiments can be reproduced with a two-dimensional finite element model incorporating: cell-cell interfacial tensions; an effective cellular viscosity; an internal cell stress that maintains constant planform area; a large externally applied stress; and an intracellular network of viscoelastic rods. For most applications, the network can be approximated by viscoelastic rods along just the cell edges. From this model, we draw the following conclusions with regard to our target observations:
-
Conclusion 1.
The similarity of recoil velocities for cell-edge and cell-center wounds implies an epithelium under a tensile stress that substantially exceeds the forces generated by cell-cell interfaces alone. A much larger contribution to the mesoscopic stress comes from in-plane, internal cell stress (∼3× larger in early dorsal closure, >4× larger in late).
-
Conclusion 2.
Anisotropy in the initial recoil velocities reflects a corresponding anisotropy in the external stress. Anisotropy in the density of cell-edge orientations is dependent not only on the current stress, but also the stress history. Correlation of the two occurs only for specific stress histories.
-
Conclusion 3.
The wide distribution of initial recoil velocities is partly due to local differences in cell geometry (∼50%), but also requires an extra source of variability—either interembryo variations in Σ or the force/viscosity ratio or intraembryo variations in viscosity. The contribution of each source remains an open question, but the simulations provide testable bounds for future experiments.
-
Conclusion 4.
The slowing transition at ∼0.1 s involves the stretching of viscoelastic elements. Despite using only linear elements, a uniform network can reproduce the observed power-law behavior from 0.1 to 10 s after ablation.
-
Conclusion 5.
The increasing expansion produced by successive wounds in a single cell is due to increasing damage to a prestressed, intracellular, viscoelastic network.
These conclusions are built from studies of one kind of embryonic epithelium at two stages of development. Other recent microsurgery-inspired models have focused solely on the cell-edge tensions (21,23), without including the in-plane, internal cell stresses that are so important to the model presented here. In these cases, the cell-edge tensions are sufficient to describe the microsurgical results, implying variability among embryonic epithelia. It will be interesting to see how well these models describe embryonic epithelia in various settings and how they provide insights into the mechanics of development.
Supporting Material
Three figures, one table, one note, and three movies are available at http://www.biophysj.org/biophysj/supplemental/S0006-3495(09)01517-3.
Supporting Material
Acknowledgments
Computing facilities were provided by SHARCNET.
This work was supported by the Human Frontier Science Program (grant No. RGP0021/2007C), by the Natural Sciences and Engineering Research Council of Canada, and by the National Science Foundation (grant No. IOB-0545679).
Contributor Information
M. Shane Hutson, Email: shane.hutson@vanderbilt.edu.
G. Wayne Brodland, Email: brodland@uwaterloo.ca.
References
- 1.Odell G.M., Oster G., Alberch P., Burnside B. The mechanical basis of morphogenesis. 1. Epith. Fold. Invag. Dev. Biol. 1981;85:446–462. doi: 10.1016/0012-1606(81)90276-1. [DOI] [PubMed] [Google Scholar]
- 2.Clausi D.A., Brodland G.W. Mechanical evaluation of theories of neurulation using computer-simulations. Development. 1993;118:1013–1023. [Google Scholar]
- 3.Davidson L.A., Koehl M.A.R., Keller R., Oster G.F. How sea-urchins invaginate—using biomechanics to distinguish between mechanisms of primary invagination. Development. 1995;121:2005–2018. doi: 10.1242/dev.121.7.2005. [DOI] [PubMed] [Google Scholar]
- 4.Chen H.H., Brodland G.W. Cell-level finite element studies of viscous cells in planar aggregates. J. Biomech. Eng. 2000;122:394–401. doi: 10.1115/1.1286563. [DOI] [PubMed] [Google Scholar]
- 5.Zajac M., Jones G.L., Glazier J.A. Model of convergent extension in animal morphogenesis. Phys. Rev. Lett. 2000;85:2022–2025. doi: 10.1103/PhysRevLett.85.2022. [DOI] [PubMed] [Google Scholar]
- 6.Pouille P.-A., Farge E. Hydrodynamic simulation of multicellular embryo invagination. Phys. Biol. 2008;5:015005. doi: 10.1088/1478-3975/5/1/015005. [DOI] [PubMed] [Google Scholar]
- 7.Graner F., Glazier J.A. Simulation of biological cell sorting using a 2-dimensional extended Potts model. Phys. Rev. Lett. 1992;69:2013–2016. doi: 10.1103/PhysRevLett.69.2013. [DOI] [PubMed] [Google Scholar]
- 8.Honda H., Tanemura M., Nagai T. A three-dimensional vertex dynamics cell model of space-filling polyhedra simulating cell behavior in a cell aggregate. J. Theor. Biol. 2004;226:439–453. doi: 10.1016/j.jtbi.2003.10.001. [DOI] [PubMed] [Google Scholar]
- 9.Drasdo D., Forgacs G. Modeling the interplay of generic and genetic mechanisms in cleavage, blastulation, and gastrulation. Dev. Dyn. 2000;219:182–191. doi: 10.1002/1097-0177(200010)219:2<182::aid-dvdy1040>3.3.co;2-1. [DOI] [PubMed] [Google Scholar]
- 10.Brodland G.W., Viens D., Veldhuis J.H. A new cell-based FE model for the mechanics of embryonic epithelia. Comp. Meth. Biomech. Biomed. Eng. 2007;10:121–128. doi: 10.1080/10255840601124704. [DOI] [PubMed] [Google Scholar]
- 11.Davidson L.A., Oster G.F., Keller R.E., Koehl M.A.R. Measurements of mechanical properties of the blastula wall reveal which hypothesized mechanisms of primary invagination are physically plausible in the sea urchin Strongylocentrotus purpuratus. Dev. Biol. 1999;209:221–238. doi: 10.1006/dbio.1999.9249. [DOI] [PubMed] [Google Scholar]
- 12.Kiehart D.P., Galbraith C.G., Edwards K.A., Rickoll W.L., Montague R.A. Multiple forces contribute to cell sheet morphogenesis for dorsal closure in Drosophila. J. Cell Biol. 2000;149:471–490. doi: 10.1083/jcb.149.2.471. [DOI] [PMC free article] [PubMed] [Google Scholar]
- 13.Hutson M.S., Tokutake Y., Chang M.S., Bloor J.W., Venakides S. Forces for morphogenesis investigated with laser microsurgery and quantitative modeling. Science. 2003;300:145–149. doi: 10.1126/science.1079552. [DOI] [PubMed] [Google Scholar]
- 14.Peralta X.G., Toyama Y., Tokutake Y., Hutson M.S., Venakides S. Upregulation of forces and morphogenic asymmetries in dorsal closure during Drosophila development. Biophys. J. 2007;92:2583–2596. doi: 10.1529/biophysj.106.094110. [DOI] [PMC free article] [PubMed] [Google Scholar]
- 15.Toyama Y., Peralta X.G., Wells A.R., Kiehart D.P., Edwards G.S. Apoptotic force and tissue dynamics during Drosophila embryogenesis. Science. 2008;321:1683–1686. doi: 10.1126/science.1157052. [DOI] [PMC free article] [PubMed] [Google Scholar]
- 16.Rodriguez-Diaz A., Toyama Y., Abravanei D.L., Wiemann J.M., Wells A.R. Actomyosin purse strings: renewable resources that make morphogenesis robust and resilient. HFSP J. 2008;2:220–237. doi: 10.2976/1.2955565. [DOI] [PMC free article] [PubMed] [Google Scholar]
- 17.Supatto W., Debarre D., Moulia B., Brouzes E., Martin J.L. In vivo modulation of morphogenetic movements in Drosophila embryos with femtosecond laser pulses. Proc. Natl. Acad. Sci. USA. 2005;102:1047–1052. doi: 10.1073/pnas.0405316102. [DOI] [PMC free article] [PubMed] [Google Scholar]
- 18.Colombelli J., Reynaud E.G., Rietdorf J., Pepperkok R., Stelzer E.H.K. In vivo selective cytoskeleton dynamics quantification in interphase cells induced by pulsed ultraviolet laser nanosurgery. Traffic. 2005;6:1093–1102. doi: 10.1111/j.1600-0854.2005.00334.x. [DOI] [PubMed] [Google Scholar]
- 19.Colombelli J., Reynaud E.G., Stelzer E.H. Investigating relaxation processes in cells and developing organisms: from cell ablation to cytoskeleton nanosurgery. Methods Cell Biol. 2007;82:267–291. doi: 10.1016/S0091-679X(06)82008-X. [DOI] [PubMed] [Google Scholar]
- 20.Desprat N., Supatto W., Pouille P.-A., Beaurepaire E., Farge E. Tissue deformation modulates twist expression to determine anterior midgut differentiation in Drosophila embryos. Dev. Cell. 2008;15:470–477. doi: 10.1016/j.devcel.2008.07.009. [DOI] [PubMed] [Google Scholar]
- 21.Farhadifar R., Röper J.-C., Aigouy B., Eaton S., Jülicher F. The influence of cell mechanics, cell-cell interactions, and proliferation on epithelial packing. Curr. Biol. 2007;17:2095–2104. doi: 10.1016/j.cub.2007.11.049. [DOI] [PubMed] [Google Scholar]
- 22.Colombelli J., Grill S.W., Stelzer E.H.K. Ultraviolet diffraction limited nanosurgery of live biological tissues. Rev. Sci. Instrum. 2004;75:472–478. [Google Scholar]
- 23.Rauzi M., Verant P., Lecuit T., Lenne P.F. Nature and anisotropy of cortical forces orienting Drosophila tissue morphogenesis. Nat. Cell Biol. 2008;10:1401–1410. doi: 10.1038/ncb1798. [DOI] [PubMed] [Google Scholar]
- 24.Ma X., Lynch H.E., Scully P.C., Hutson M.S. Probing embryonic tissue mechanics with laser hole-drilling. Phys. Biol. 2009;6:036004. doi: 10.1088/1478-3975/6/3/036004. [DOI] [PubMed] [Google Scholar]
- 25.Campos-Ortega J.A., Hartenstein V. Springer Verlag; Berlin: 1985. The Embryonic Development of Drosophila melanogaster. [Google Scholar]
- 26.Oda H., Tsukita S. Real-time imaging of cell-cell adherens junctions reveals that Drosophila mesoderm invagination begins with two phases of apical constriction of cells. J. Cell Sci. 2001;114:493–501. doi: 10.1242/jcs.114.3.493. [DOI] [PubMed] [Google Scholar]
- 27.Hutson M.S., Ma X. Plasma and cavitation dynamics during pulsed laser microsurgery in vivo. Phys. Rev. Lett. 2007;99:158104. doi: 10.1103/PhysRevLett.99.158104. [DOI] [PubMed] [Google Scholar]
- 28.Brodland G.W. The differential interfacial tension hypothesis (DITH): a comprehensive theory for the self-rearrangement of embryonic cells and tissues. J. Biomech. Eng. 2002;124:188–197. doi: 10.1115/1.1449491. [DOI] [PubMed] [Google Scholar]
- 29.Chen X., Brodland G.W. Mechanical determinants of epithelium thickness in early-stage embryos. J. Mech. Behav. Biomed. Mater. 2009;2:494–501. doi: 10.1016/j.jmbbm.2008.12.004. [DOI] [PubMed] [Google Scholar]
- 30.Brodland G.W., Wiebe C.J. Mechanical effects of cell anisotropy in epithelia. Comp. Meth. Biomech. Biomed. Eng. 2004;7:91–99. doi: 10.1080/1025584042000209369. [DOI] [PubMed] [Google Scholar]
- 31.Chen X., Brodland G.W. Multi-scale finite element modeling allows the mechanics of amphibian neurulation to be elucidated. Phys. Biol. 2008;5:15. doi: 10.1088/1478-3975/5/1/015003. [DOI] [PubMed] [Google Scholar]
- 32.Veldhuis J.H., Brodland G.W., Wiebe C.J., Bootsma G.J. Multiview robotic microscope reveals the in-plane kinematics of amphibian neurulation. Ann. Biomed. Eng. 2005;33:821–828. doi: 10.1007/s10439-005-3309-2. [DOI] [PubMed] [Google Scholar]
- 33.Brodland G.W., Chen D.I.-L., Veldhuis J.H. A cell-based constitutive model for embryonic epithelia and other planar aggregates of biological cells. Int. J. Plast. 2006;22:965–995. [Google Scholar]
- 34.Zienkiewicz O.C., Taylor R.L. McGraw-Hill; London: 1989. The Finite Element Method. [Google Scholar]
- 35.Valberg P.A., Feldman H.A. Magnetic particle motions within living cells. Biophys. J. 1987;52:551–561. doi: 10.1016/S0006-3495(87)83244-7. [DOI] [PMC free article] [PubMed] [Google Scholar]
- 36.Hiramoto O. Mechanical properties of the protoplasm of the sea urchin egg. Exp. Cell Res. 1969;56:201–208. doi: 10.1016/0014-4827(69)90003-2. [DOI] [PubMed] [Google Scholar]
- 37.Feneberg W., Westphal M., Sackmann E. Dictyostelium cells' cytoplasm as an active viscoplastic body. Eur. Biophys. J. 2001;30:284–294. doi: 10.1007/s002490100135. [DOI] [PubMed] [Google Scholar]
- 38.Trepat X., Wasserman M.R., Angelini T.E., Millet E., Weitz D.A. Physical forces during collective cell migration. Nat. Phys. 2009;5:426–430. [Google Scholar]
- 39.Benko R., Brodland G.W. Measurement of in vivo stress resultants in neurulation-stage amphibian embryos. Ann. Biomed. Eng. 2007;35:672–681. doi: 10.1007/s10439-006-9250-1. [DOI] [PubMed] [Google Scholar]
- 40.Silverman B.W. Chapman and Hall; New York: 1986. Density Estimation for Statistics and Data Analysis. [Google Scholar]
- 41.Solon J., Kaya-Çopur A., Colombelli J., Brunner D. Pulsed forces timed by a ratchet-like mechanism drive directed tissue movement during dorsal closure. Cell. 2009;137:1331–1342. doi: 10.1016/j.cell.2009.03.050. [DOI] [PubMed] [Google Scholar]
- 42.Lenormand G., Millet E., Fabry B., Butler J.P., Fredberg J.J. Linearity and time-scale invariance of the creep function in living cells. J. R. Soc. Interface. 2004;1:91–97. doi: 10.1098/rsif.2004.0010. [DOI] [PMC free article] [PubMed] [Google Scholar]
- 43.Bausch A.R., Ziemann F., Boulbitch A.A., Jacobsen K., Sackmann E. Local measurements of viscoelastic parameters of adherent cell surfaces by magnetic bead microrheometry. Biophys. J. 1998;75:2038–2049. doi: 10.1016/S0006-3495(98)77646-5. [DOI] [PMC free article] [PubMed] [Google Scholar]
Associated Data
This section collects any data citations, data availability statements, or supplementary materials included in this article.