

Abstract
Short double-stranded DNA is used in a variety of nanotechnological applications, and for many of them, it is important to know for which forces and which force loading rates the DNA duplex remains stable. In this work, we develop a theoretical model that describes the force-dependent dissociation rate for DNA duplexes tens of basepairs long under tension along their axes (“shear geometry”). Explicitly, we set up a three-state equilibrium model and apply the canonical transition state theory to calculate the kinetic rates for strand unpairing and the rupture-force distribution as a function of the separation velocity of the end-to-end distance. Theory is in excellent agreement with actual single-molecule force spectroscopy results and even allows for the prediction of the rupture-force distribution for a given DNA duplex sequence and separation velocity. We further show that for describing double-stranded DNA separation kinetics, our model is a significant refinement of the conventionally used Bell-Evans model.
Introduction
Double-stranded DNA (dsDNA) is an extensively studied polymer offering a number of striking properties. Among these properties are interstrand recognition according to the Watson-Crick basepairing rules, stability under a broad range of conditions, and ease of synthesis that allows for fast and cost-efficient production of any desired sequence with almost any kind of chemical modification. Within the past several years, various areas of application of DNA have been identified, and nanotechnology, specifically, is increasingly harnessing the potential of this versatile polymer (1). Whereas in earlier published work DNA merely served as simple molecular handles for single-molecule experiments (2,3), today DNA serves as molecular building blocks for complex self-assembled nanostructures (4–7), as well as DNA computing (8). In our laboratory, DNA was even used as a programmable force sensor for detection of single-nucleotide polymorphisms (9), multiplexed antibody sandwich assays (10,11), investigation of chiral preference of small DNA-binding molecules (12), quantitative detection of DNA-binding molecules (13), and aptamer sensors (14). Recently, our laboratory applied this DNA force sensor concept to “single-molecule cut and paste” experiments (15) for the bottom-up assembly of nanoparticles (16) and for single-molecule fluorescence applications (17). For many of the abovementioned applications, it is insightful, if not critical, to know what forces a given DNA duplex may withstand. In particular, such knowledge would make it possible not only to predict, tune, and analyze DNA force sensor experiments, but also to design more stable DNA scaffolds.
The elastic response and force-dependent dissociation rate of DNA duplexes has been extensively studied in micromanipulation experiments employing atomic force microscopy (AFM) (18,19), magnetic beads (20), glass microneedles (21), and optical tweezers (22,23). Here, we discuss the stretching of dsDNA along its axis (“shear geometry”) only in contrast to the gradual unzipping of DNA perpendicular to its axis (“unzip geometry”). Stretching a DNA duplex with thousands of basepairs along its axis results in an elastic response with a distinct force plateau at 60–65 pN (18,21,22). During this elongation at almost constant force, the DNA molecule stretches up to a factor of 1.7 of its contour length. This behavior is highly reproducible, independent of the stretching velocity, and commonly attributed to a highly cooperative conversion from regular B-DNA into an overstretched conformation called S-DNA (24–27). On the contrary, Rouzina and Bloomfield (28), as well as Piana (29), argue that S-DNA is not a distinct conformation of the polymer, but simply the melting of the dsDNA into two single strands. However, not only does the B-S transition appear to be too cooperative for a common melting process, but it has been shown also that dsDNA remains stable at forces significantly higher than 65 pN (30), with an elastic response distinct from one single-stranded DNA (ssDNA) polymer or two parallel ssDNA polymers (24). Further support for S-DNA being a distinct conformation is provided by the experimental observation of a second transition in the range 150–200 pN, which is thought to be the final melting transition (18,24) instead of the B-S transition. Based on the assumption that S-DNA is in fact a distinct conformation, several recent theoretical studies have modeled the elongation of DNA duplexes applying three-state (B-DNA, S-DNA, and ssDNA) equilibrium approaches (24,25). These studies concluded that S-DNA is the thermodynamically preferred and stable state for forces between 65 and 130 pN.
Individual basepairing interactions are relatively weak (free energy ∼1–3 kBT), and thermal fluctuations cause opening (“breathing”) of the DNA duplex from its ends, as well as the formation of bubbles, which are regions of ssDNA (opened basepairs) between regions of dsDNA. The shorter the DNA duplex, the more likely it is that all basepairs open up for an instant and the two strands separate even at forces well below 130 pN. For DNA duplexes tens of basepairs long, Strunz and colleagues (31) and Morfill and colleagues (32) observed strand separation at forces as low as 40–70 pN. Repeated measurements resulted in rupture-force distributions that were shifted to higher forces for higher separation velocities. From a theoretical point of view, this can be described as a thermally driven escape process from a free-energy potential and has typically been discussed within the framework of the Bell-Evans model. Herein, the trapping potential is assumed to be a one-dimensional harmonic free-energy potential, and strand separation is treated as the crossing of an energy barrier according to a time dependence similar to that described by the Arrhenius law (31–35). Application of a force tilts the energy landscape, reduces the energy barrier proportional to the applied force, and therefore increases the dissociation rate of the DNA duplex. According to the experimental data, the model predicts higher rupture forces for higher separation velocities (33). Although the experiments are explained quite well by the Bell-Evans model, that model does not allow for the prediction of rupture forces for a given DNA duplex sequence and separation velocity. Apart from the Bell-Evans theory, molecular dynamics simulations, employing force fields and initial molecular structures, provided insight into the DNA separation process. Unfortunately, these simulations cost a significant amount of computation time, such that the timescales accessible for in silico experiments are much shorter than what is experimentally observable (26,27). Therefore, it is apparent that a theory is needed to fill the gap between the Bell-Evans model, which is too simplistic, and the detailed molecular dynamics simulations, with which mechanics can currently be simulated on very short timescales only.
In this work, we develop a model that describes and predicts the DNA duplex rupture forces for any given sequence and experimentally accessible pulling velocities. To be specific, we derive the dissociation rate as a function of the applied force based on a combination of recent work on DNA equilibrium theory and the canonical transition state theory. On this basis, we calculate the force-extension traces and the rupture-force distribution for a 20- and a 30-basepair-long DNA duplex and compare the obtained results to actual single-molecule experimental data (Fig 1 a and b). Further, we are able to show that for the description of double stranded DNA separation kinetics, our model is a significant refinement of the conventionally used Bell-Evans model.
Figure 1.
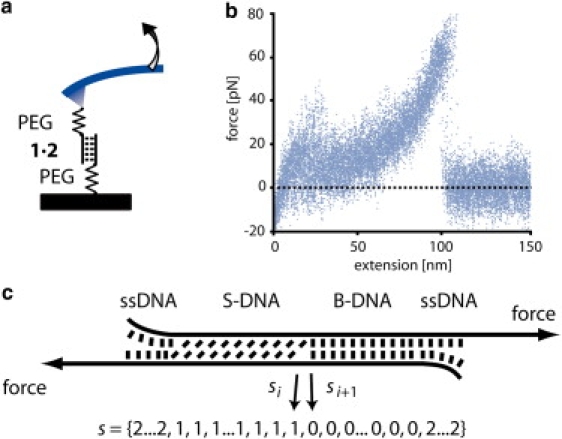
(a) Schematic of a single-molecule DNA stretching experiment. The 5′ ends of a short, double-stranded DNA duplex are attached to a surface and an atomic force microscope cantilever via elastic poly(ethylene glycol) (PEG) polymers. Separation of the substrate and the cantilever at constant velocity leads to an increasing end-to-end distance and thus to an increasing force. (b) Superposition of 20 experimentally obtained force-extension traces obtained from the same 30-basepair 1 × 2 DNA duplex with a separation velocity of 1 μm/s. The duplex dissociates at ∼60–65 pN. (c) Schematic of the three-state model. Every basepair of the DNA duplex appears in one of three states: B-DNA, S-DNA, or single-stranded DNA. Every state s of an N-basepair-long DNA may thus be represented by a list of length N with entries 0 (B-DNA), 1 (S-DNA), and 2 (ssDNA) for every basepair.
Results and Discussion
The result of this work is a theoretical model that predicts the rupture force of dsDNA tens of basepairs long as it is applied in a DNA force sensor, in DNA nanostructure, and in DNA computing applications. For this purpose, we first set up a three-state equilibrium model similar to a model used previously to describe the force-extension traces of long dsDNA (24). Second, we apply the canonical transition state theory to this equilibrium model, which in turn permits calculation of the rate of duplex dissociation at a given force f. Theoretical results are compared to actual AFM experiments on the 20-basepair (1 × 2) and the 30-basepair (1 × 3) duplex. Details about DNA oligomers 1–3, as well as about the experimental procedures, are provided in the Supporting Material.
Equilibrium theory
Analogous to the Bragg-Zimm theory (36) and a variety of work published recently on the force-induced opening of dsDNA in unzip geometry (37–39,40) and shear geometry (28), as well as the opening of coiled coils (41,42), we calculate the equilibrium free energy of DNA duplexes: The DNA duplex is described as a one-dimensional polymer for which every basepair i is considered to be present in one of three discrete states, namely, regular B-DNA (si = 0), overstretched S-DNA (si = 1), and single-stranded DNA (si = 2) conformations. Thus, any configuration s of an N-basepair DNA duplex is represented by an N-tupel,
| (1) |
where the ith entry represents the state of the ith basepair, counting from the 5′ to the 3′ end.
Two contributions to the free energy/basepair are taken into account: w, the elastic free energy/basepair at a given force f, and j, the basepairing free energy we derive from a nearest-neighbor model and assume to be independent of the applied force. The free energy of the ith basepair can be determined by
| (2) |
These two energy contributions yield the total free energy, Gtotal (s, f), for any possible configuration s at any force f,
| (3) |
where the term corresponds to the Nth basepair, which does not have a next neighbor it can interact with such that .
Elastic energy
The free energies due to the elastic deformation of the three different DNA conformations are obtained by simply integrating their extensions with respect to the force:
| (4) |
Phenomenological polymer extension models reproduce the force-extension traces well (see Fig. 2 a). In the Supporting Material, we derive the elastic free energy/basepair from such polymer extension models for B-DNA (wB), S-DNA (wS), and ssDNA (wss) explicitly. Assuming an average basepairing energy of 2.4 kBT, as is the case for the 1 × 2 and 1 × 3 DNA duplexes (Fig. 2 b), which DNA configuration is most favorable for forces between 0 and 200 pN? B-DNA remains thermodynamically stable for forces <60 pN. S-DNA is stable between 60 and ∼130 pN and ssDNA is the energetically most favorable state at forces >130 pN. Since we employ a nearest-neighbor model to calculate the partition sum of the system, it is convenient to represent the free energy due to the elastic behavior of DNA in a 3 × 3 matrix form,
| (5) |
where the rows correspond to the state of basepair i and the columns to the state of basepair i + 1. Thus, in our model, the elastic free energy of basepair i is independent of the state of basepair i + 1.
Figure 2.
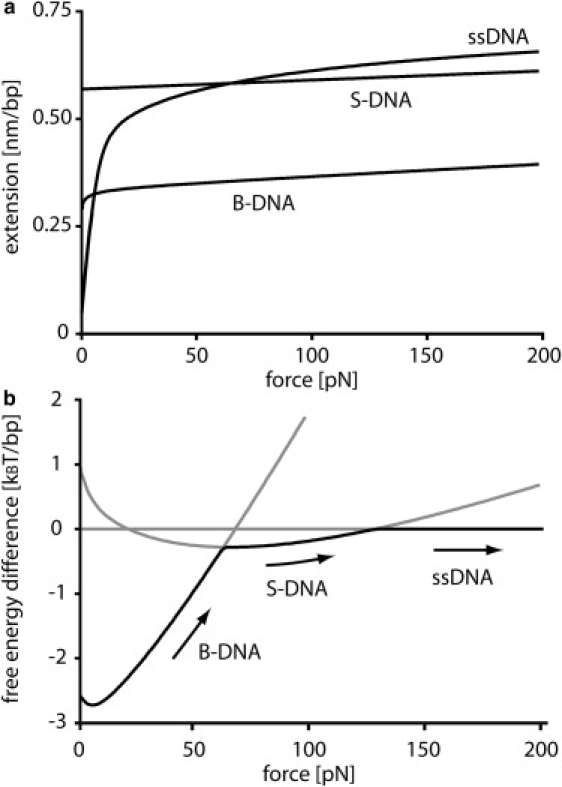
(a) Force-extension traces obtained from phenomenological models for the three different states of double-stranded DNA. (b) Corresponding free-energy difference/basepair between B-DNA and ssDNA as well as between S-DNA and ssDNA. A free-energy penalty of 2.4 kBT, the average basepair free energy of the 1 × 2 and 1 × 3 DNA duplexes, is introduced to the free energy of ssDNA due to the loss of basepairing interactions. Highlighted in black is the state that is thermodynamically most favorable. The most favorable state is B-DNA for forces <60 pN, S-DNA for forces between 60 pN and 130 pN, and ssDNA for forces >130 pN.
Interaction free energy
It has been observed in experiments that the stability of a given basepair depends not only on whether the basepair itself is A·T or G·C, but also on the identity and orientation of adjacent basepairs, presumably due to the differences in free energy for the different possible stacking interactions (43). In our model, we employ the nearest-neighbor model of SantaLucia, which takes these experimental observations into account (44). The stacking free energy between each basepair i and i + 1 is given by the constant Ji in case both are either B-DNA or S-DNA. Although the stacking free energies for B-DNA and S-DNA are independent parameters, for simplicity, we assume them to be identical.
In addition, the boundaries between regions of different states are associated with energy penalties. CB−S is the energy cost associated with a boundary between B-DNA and S-DNA regions. Cluzel and colleagues estimated the B-S boundary energy from the cooperativity of the B-S transition to be close to 3.4 kBT (21). Unlike the non-nearest-neighbor models for which the latter value was derived, for our nearest-neighbor model, the total energy penalty is given by CB−S along with the loss of one additional base-stacking interaction. The average energy lost in base-stacking interaction is 2.4 kBT for the 1 × 2 as well as the 1 × 3 duplex, which is why we set CB−S to 2.2 kBT (half a base-stacking interaction free energy subtracted from each boundary).
Furthermore, the boundaries between double-stranded and between single-stranded regions of DNA are associated with the free-energy cost, Cds−ss. According to SantaLucia (44) this value is close to 1 kBT. For any given state s, there are always two boundaries at each side of the dsDNA region and, therefore, the parameter Cds−ss has an impact only on the likelihood of bubbles. Within polymer theory, the latter are commonly referred to as loops. Since bubbles come along with additional degrees of freedom, polymer theory predicts an entropic energy contribution proportional to the logarithm of the bubble size, which favors the creation of bubbles:
| (6) |
where nloop is the number of opened basepairs within the bubble and c is the loop exponent. The value of the loop exponent is c = 3/2 for an ideal loop and c = 2.1 for a self-avoiding loop (45). The exact value of c for dsDNA is still under debate. Recent theoretical calculations by Einert and colleagues imply that data for long dsDNA is best fit by setting c = 0, which may be explained by the fact that DNA contains a significant numbers of nicks. Such a long-range interaction cannot be implemented into our nearest-neighbor model. Therefore, we simply chose the parameter such that theory agreed best with actual experiments and estimated a value of −0.25 kBT for Cds−ss, corresponding to an average bubble size of 4 basepairs. Note that the theoretical predictions (46–48) regarding longer-range entropic contribution to partially melted DNA are in agreement with experimental data obtained by Altan and colleagues (49). Based on Förster energy transfer measurements on tracts of A·T basepairs, they argue that initiating a bubble requires a free energy much larger than kBT, whereas extending this bubble requires only free energies in the range 0.05–1.0 kBT/basepair.
In matrix form, the interaction free-energy contributions based on the SantaLucia nearest-neighbor model and the boundary free-energy penalties are
| (7) |
where the rows correspond to the state of basepair i and the columns to the state of basepair i + 1. Thus, if basepair i and basepair i + 1 are B-DNA then an energy gain of Ji is introduced to the base-stacking interaction. The same is true for two adjacent S-DNA basepairs. Boundaries between basepairs are associated with an energy penalty CB−S or Cds−ss, where CB−S is 3.4 kBT and Cds−ss is −0.25 kBT, as discussed above.
Partition sum
From the total free energy, Gtotal (Eqs. 2 and 3), of each possible state s, we calculate the partition sum, which in turn allows for determination of the force-extension trace and the likelihood of the states s.
| (8) |
Thus, the partition sum may be considered as the sum over all matrix elements of the product of N 3 × 3 matrices (50). Thereby, the ith matrix of the N matrices represents the ith basepair containing nine entries. Each entry represents the Boltzmann factor of one of the nine possible combinations of states that basepair i and basepair i + 1 may adopt. We make two corrections to Eq. 8, which we explain in more detail in the Supporting Material. First, we introduce two additional basepairs at i = 0 and i = N + 1, which are single-stranded. This takes care of the boundary conditions at the end of the DNA duplex. Second, we do not count the states for which two or fewer basepairs remain. These states, as we discuss in more detail in the next section, correspond to already separated strands.
Stretching curves
From the partition sum of our model, we derive the force-extension trace for a given sequence and compare it to experimentally obtained data. The equilibrium force-extension trace follows directly from the derivative of the partition sum with respect to the force (51):
| (9) |
The AFM experiments were prepared according to the Materials and Methods section (see Supporting Material) and are schematically shown in Fig. 1 a. The two complementary single strands 1 and 2 were coupled to the cantilever tip and a substrate via long poly(ethylene glycol) linkers (5 kDa). In a typical experiment, the tip is brought into contact with the glass slide, and the two complementary strands hybridize and form the 1 × 2 duplex. Upon retraction at constant velocity, the PEG spacer and dsDNA elongates, building up an increasing force until the duplex dissociates. Fig. 3 shows an average of 20 force-extension curves. Experimentally, one measures the elasticity of a chain of four elements: the dsDNA duplex, the PEG linker, the ssDNA linker, and the cantilever. The force-extension trace is a superposition of the extension profile of all four of them:
| (10) |
where xDNA duplex is specified by Eq. 9 and xcantilever is the deflection of the cantilever, which is proportional to the cantilever stiffness, kcantilever = 8 pN/nm. The polymer models from which xDNA linker and xPEG linker are derived are described in the Supporting Material. We used the number of monomers within the PEG polymer, NPEG, as a fitting parameter, since PEG polymers are typically synthesized with a rather broad size distribution (32). Fitting of the whole system resulted in a monomer number of 255, which agrees well with the expected monomer number of 227 for a total PEG linker with a molecular mass of 10 kDa.
Figure 3.
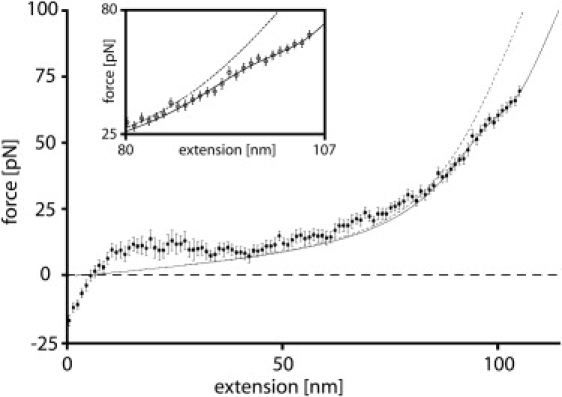
Force-extension data of short, double-stranded DNA attached to a surface and an atomic force microscope cantilever via a 5-kDa poly(ethylene glycol) linker for each strand. Data for 20 pulling experiments at a separation velocity of 1 μm/s was binned into 1-pN intervals and averaged (circles). The solid line is the corresponding fit of the model presented here. The dashed line represents the fit in the case where the DNA duplex remains in its canonical B-form. At <30 pN, the fit underestimates forces, an observation that we attribute to nonspecific interactions and entanglements with neighboring constructs on the surface. (Inset) For forces >30 pN, theory and experimental data agree within the experimental error.
Fig. 3 shows that the theory fits the experimental data very well for forces >30 pN. However, for lower forces, the theoretical fit underestimates the experimentally obtained forces. The 10- to 15-pN plateau between 10 and 20 nm extension at the beginning of the stretching curve is typical for a DNA desorption process from a surface (52). For higher extensions, we attribute this discrepancy between theory and experiment to nonspecific interactions and entanglement of the strands with each other on the surface. This is entirely possible, since the contour length of the surface-anchored DNA strands is >50 nm and the spacing between two of these strands is typically ∼10 nm (12,15,16).
Canonical transition state theory
For an average basepairing free energy of 2.4 kBT, dsDNA is thermodynamically stable for forces <130 pN (18,24,25). Still, Strunz and colleagues (31) and Morfill and colleagues (32) observed bond breakage at forces between 40 and 70 pN for 20- and 30-basepair dsDNA. They attributed this effect to thermal fluctuations like the opening or “breathing” of dsDNA from its ends, and to the formation of bubbles, which are regions of ssDNA between regions of dsDNA. Some of these fluctuations are so large that the whole duplex opens and the two strands separate.
Such a thermally activated escape process can be described by canonical transition state theory (53,54). This theory is purely classical and based on two assumptions: 1), the bond is trapped in a free-energy potential and thermodynamic equilibrium prevails; and 2), once the system has crossed a dividing surface in state space, i.e., the transition state, it will not return to the metastable state. The rate of escape follows directly from the flux through this dividing surface.
In the next paragraphs, we first define the dividing surface, i.e., the transition states, for the dsDNA equilibrium model described in the previous section. We then calculate the equilibrium flux through this dividing surface and thus obtain the rate of escape. We explicitly calculate the rupture-force distributions for the two DNA duplexes 1 × 2 and 1 × 3 and compare them to experimental data. At the end of this section, we discuss why the canonical transition state theory is an appropriate description of our system.
Transition states
In the case of an N-basepair-long DNA duplex, the free-energy potential is N-dimensional and the corresponding coordinate is the state s. A dividing surface between the reactants (dsDNA) and the products (ssDNA) has to be chosen such that once the system has crossed this surface, the chances of recrossing are negligible. In our system, this dividing surface is spanned by the states stst, for which there is exactly one base-stacking interaction left. One base-stacking interaction corresponds to two adjacent B-DNA or S-DNA basepairs. Therefore, there are 2(N − 1) distinct states through which the reaction may occur. For illustrative purposes we can collapse the free-energy landscape onto one coordinate: n, the number of remaining basepairs. Within this picture (Fig. S1 in the Supporting Material), we identify the transition state as ntst = 2. If another basepair opens up, the two DNA strands dissociate, i.e., the polymers will immediately reduce their end-to-end distance and reannealing of the two strands is literally impossible.
Equilibrium flux
The rate of escape is given by the equilibrium flux through the transition states, stst, in the direction of the product (two separate strands). The flux is essentially twice the basepair opening rate (either one of the two remaining basepairs may open), which, for simplicity, we assume to be the same for all stst. This allows us to use the collapsed free-energy landscape with only one reaction coordinate, n, the number of remaining basepairs. The equilibrium flux through the transition states, stst, becomes the probability that the system will be in the collapsed transition state, ntst, multiplied by , twice the basepair opening rate. The result for the rate of escape at a given force f is
| (11) |
The calculations are shown explicitly in the Supporting Material. To our knowledge, the basepair opening rate of a single basepair-stacking interaction has never been determined experimentally. From the literature, we estimate the basepair opening rate at the ends of dsDNA to be between 103 s−1 and 109 s−1: Bockelmann and colleagues performed optical tweezers measurements from which we estimate an opening rate of at least 103 s−1 (55). Fluorescence measurements investigating the end fraying of the dsDNA could not resolve any basepair opening rates on timescales <109 s−1 (56). In their report discussing the unzipping of DNA, Cocco and colleagues assumed a value of 108 s−1 (24), and nuclear magnetic resonance amino proton exchange studies yielded rates in the order of 107 s−1 (57). For a basepair opening rate of = 5 × 10⁸ s−1 our theory agrees very well with the experimentally determined rupture forces (32). Note that the rate depends on the applied force, but since the force dependence is rather weak (40), we assume the rate to be constant. In principle, all calculations could also be performed with force- and sequence-dependent rates.
Rupture forces
Based on the canonical transition state theory, we derive the rupture-force distributions obtained for two given sequences, namely, the 1 × 2 as well as the 1 × 3 DNA duplex, and different pulling velocities, v. In experiments, we control the separation velocity between cantilever and substrate. Thus, the end-to-end distance, x, of a system composed of dsDNA, ssDNA linker, PEG linker, and AFM cantilever continuously increases in time with constant velocity v. From the end-to-end distance, x, we derive the force acting along this chain of elastic elements. The force in turn allows us to determine the escape rate, k, as a function of time. The resulting differential equation describes the decay from a metastable state, Nduplex, with a time-dependent rate (33):
| (12) |
where k(t) = k(f(v × t)), and f(x) follows from Eq. 10.
For both the 1 × 2 and the 1 × 3 DNA duplexes and separation velocities between 10 nm/s and 10 μm/s, we numerically solved this differential equation. The obtained rupture-force distributions are shown in Fig. 4 a. A striking finding was that the rupture-force distribution of the 1 × 2 DNA duplex broadens with increasing force loading rate, whereas the rupture-force distribution of the 1 × 3 DNA duplex is almost independent of this parameter. We attribute this behavior to the crossing of the B-S transition at ∼65 pN, which is only observed for the 1 × 2 DNA duplex for the experimentally applied force loading rates. For forces >65 pN, and thus above the B-S transition, the slope of the force-extension profile increases significantly, resulting in a wider distribution of the obtained rupture forces. To verify that the broadening of the rupture-force distribution is indeed due to the crossing of the B-S transition, we calculated the 1 × 3 DNA duplex rupture-force distributions for force loading rates higher than those achievable by experiment. In agreement with this interpretation, the rupture-force distribution of the 1 × 3 DNA duplex broadens correspondingly for rupture forces above the B-S transition (data not shown). The experimentally obtained rupture-force distributions are further broadened by the thermal and instrumentation noise introduced to the cantilever. According to Morfill and colleagues (32), the total experimental noise was Gaussian, with a width of 4.7 pN. Therefore, to compare theory with experiment, we convolved the theoretically obtained rupture-force distribution with such a Gaussian distribution (Fig. 4 b). From these distributions, we determined the most probable rupture force via a Gaussian fit. Fig. 4 c shows this fit plotted against the corresponding most probable force loading rate for the theoretical predictions and the experimental data. The theory reproduces the data quite well within the experimental error.
Figure 4.
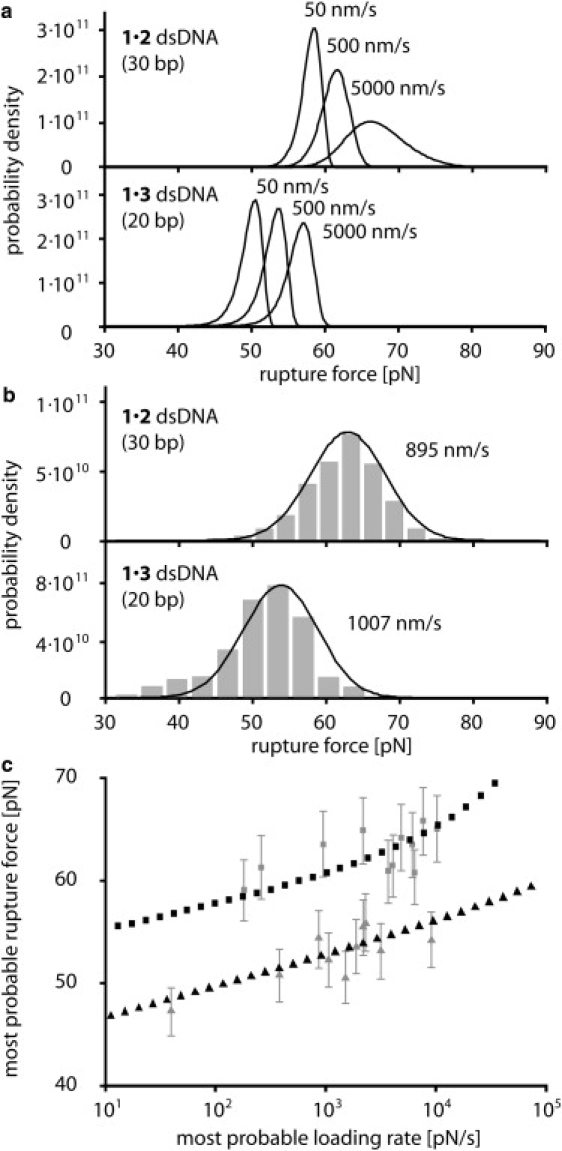
(a) Calculated rupture-force distribution for the 1 × 2 and the 1 × 3 duplex for 50, 500, and 5000 nm/s pulling velocity. (b) Comparison of the experimental (gray bars) and calculated (lines) rupture-force distribution for the 1 × 2 and 1 × 3 duplex at 895 nm/s and 1007 nm/s, respectively. The calculated rupture-force distributions were convolved with a Gaussian cantilever detection noise of 4.7 pN. (c) Comparison of the experimental and calculated most probable rupture forces for different most probable loading rates. The gray data points refer to the experimental data and the black data points to the theory data. Squares refer to the 30-basepair DNA 1 × 2 duplex and triangles to the 20-basepair 1 × 3 duplex.
Systematic errors on the experimental side are mainly due to errors of the cantilever calibration, which introduces an error of up to 5–10% (58). The presented AFM force data were obtained with two different AFM cantilever tips, one for all of the 1 × 2 DNA duplex data and one for all of the 1 × 3 DNA duplex data. Therefore, the set of most probable rupture forces may be shifted by up to 5–10%. Further, a small error is introduced due to pulling angles that are not perpendicular to the substrate, which is typically in the order of 2% (59).
Systematic errors on the theoretical side include the following: We chose the basepair opening rate for the B-DNA and the S-DNA conformations to be identical, although they are completely independent parameters. Further, the S-DNA polymer elasticity model is very crude for several other reasons. First, according to the methods of Cocco and colleagues (24), we approximated the force-extension curve of S-DNA to be linear. Second, the basepair free energy was assumed to be identical to the B-DNA interaction. Furthermore, there are most likely two types of S-DNA, depending on whether the force is applied at the 5′ or the 3′ ends of the dsDNA (26,60). Finally, the nearest-neighbor model does not account for long-range interactions, as they are experimentally observed in DNA bubbles, which has a strong influence on the boundary energy, Css−ds, and thus on how cooperative DNA strand separation occurs. From our calculations, we observed that a more cooperative transition between single-stranded and double-stranded DNA, i.e., a larger value for Css−ds, leads to a reduced DNA duplex length dependence on the rupture-force distribution. For values of Css−ds in the range of a few kBT, the rupture-force distributions of the 1 × 2 and the 1 × 3 DNA duplexes are almost superimposed.
Thermodynamic equilibrium prevails
To appropriately describe the separation of dsDNA employing canonical transition state theory, thermodynamic equilibrium must prevail within the binding potential (54). Two scenarios would contradict such an assumption: Either the changes of state occur on timescales equal to or slower than the rate of escape or, to reach the transition states, an intermediate free-energy barrier needs to be crossed. In the Supporting Material, we discuss these scenarios and conclude that, for the experimentally observed force range between 0 and 100 pN, canonical transition state theory is applicable.
Comparison to the Bell-Evans model
Typically, the rupture of molecular bonds is described employing the Bell-Evans model (34). Like our model, the latter is based on transition state theory assuming a thermally activated escape from a free-energy potential. In this section, we discuss the differences between the Bell-Evans model and our model, how they compare with each other, and why our model is a significant refinement for the description of force-induced separation of short dsDNA.
The main difference between the two models lies within the approximation of the Bell-Evans trapping potential as a harmonic free-energy landscape, which is simply tilted by an external force. As a result of this approximation, the free-energy difference between the equilibrium and the transition state decreases in proportion to the applied force:
| (13) |
where ΔG0 is the free-energy difference at zero force and xtst is a force-independent distance between the equilibrium state and the transition state. The force-dependent rate is given by
| (14) |
where k0 is the natural attempt frequency of the molecular bond. In our work, we explicitly model the evolution of the DNA duplex free-energy landscape with increasing force. To see what differences arise in comparison to the Bell-Evans approach, we calculate an effective barrier height of the transition state from the sum of the Boltzmann probabilities for the states, stst.
| (15) |
As shown in Fig. 5 a, the force-dependent evolution of the effective barrier height according to Eq. 15 does exhibit significant differences from the Bell-Evans approach (Eq. 13). Below 10 pN the free-energy difference between the equilibrium state and the transition state increases with applied force. This is in agreement with Fig. 2 b, which shows that for increasing applied force the absolute value of the free-energy difference per basepair between B-DNA (equilibrium state for low forces) and ssDNA (transition state) increases for forces <10 pN before it decreases for forces >10 pN. The microscopic origin of this effect is that although the contour length of ssDNA is longer compared to B-DNA, the contour length of ssDNA projected onto the direction of applied force, i.e., the end-to-end distance, is shorter for low forces due to its much shorter persistence length. Thus, low forces stabilize DNA duplexes, a result that was previously shown experimentally (61,62) and discussed theoretically (28,63). Between 10 and 60 pN, the free energy decreases roughly proportionally to the applied force, f. Above 65 pN, i.e., above the B-S transition, the energy decreases linearly again, yet with a smaller slope. Taking the negative derivative of the calculated free-energy barrier height with respect to the force yields an effective distance between the equilibrium state and the transition state, xtst:
xtst does exhibit a rather odd force dependency (Fig. 5 b), which we explain according to geometrical considerations: Strunz and colleagues estimated an upper limit for xtst assuming that the equilibrium state is B-DNA with a contour length of 0.34 nm/basepair and that the transition state is all ssDNA (apart from two residual basepairs), with a contour length of ∼0.7 nm/basepair (31). In the case of the 30-basepair 1 × 2 DNA duplex, this corresponds to a total length difference between these two states of ∼10 nm, which is significantly larger than the corresponding values of xtst obtained from our calculations, as well as those from actual experiments (31,32). Two effects contribute to this deviation. First, xtst is the projection of the distance between the equilibrium state and the transition state onto the direction of applied force. Therefore, a more accurate estimate of xtst is the difference in end-to-end distance according to our polymer models for B-DNA and ssDNA (Fig. 5 b). Second, within the range 60–65 pN, the equilibrium state switches from a predominantly B-DNA duplex to a predominantly S-DNA duplex. The difference in end-to-end distance between the equilibrium state and the transition states is much smaller for an S-DNA duplex than for a B-DNA duplex (Fig. 5 c). Consequently, xtst decreases to a fraction of a nanometer during the B-S transition.
Figure 5.
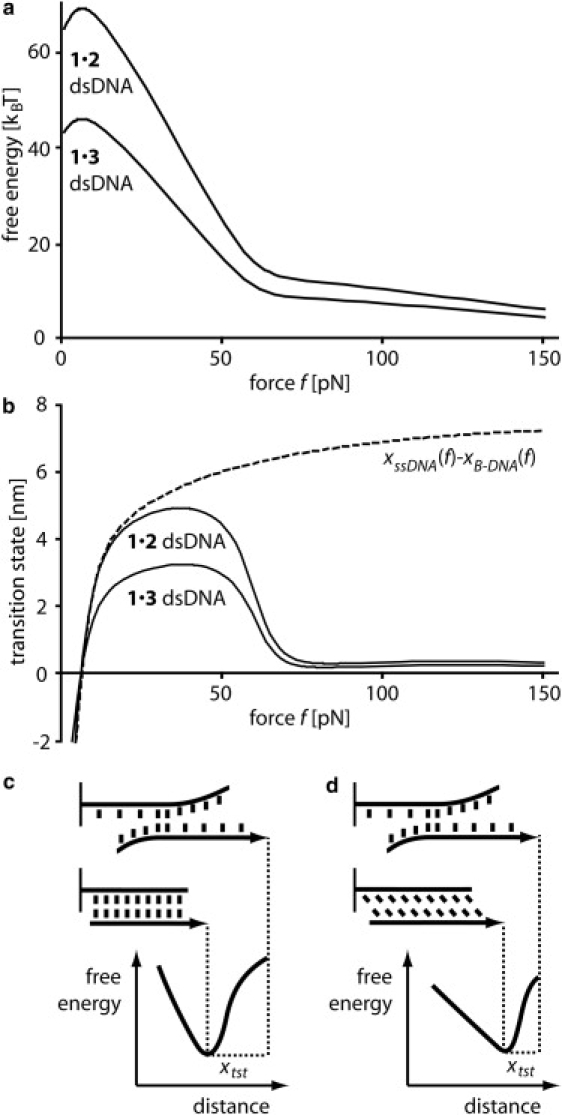
(a) Calculated effective barrier height, according to the standard Bell-Evans model. At forces between 10 and 50 pN, the free energy decreases proportionally to the applied force f. At forces >65 pN, when B-DNA is converted into S-DNA, the energy again decreases linearly, yet with a significantly smaller slope. (b) The negative derivative of the force versus free energy profile yields xtst, the effective distance between the equilibrium state and the transition state. The dashed line represents the difference in end-to-end distance for B-DNA and ssDNA for the 1 × 2 DNA duplex as a function of force. (c) For forces <60 pN, xtst reflects the increase in end-to-end distance from B-DNA to ssDNA. (d) For forces >65 pN, xtst reflects the increase in end-to-end distance from S-DNA to ssDNA.
Due to the force dependence of xtst, we conclude that the standard Bell-Evans model is only a good description of the force-induced separation of DNA duplexes for forces between 10 and 50 pN and between 65 and ∼100 pN. However, for both scenarios, a different set of free-energy landscape parameters, i.e., free-energy barrier at zero force and distance between equilibrium and transition state, need to be chosen. Our refined model, on the other hand, provides a reliable description for forces between 0 and ∼100 pN. Our results are in agreement with recent literature. Hyeon and Thirumalai (64) argue that xtst changes considerably if the molecular bond is soft or plastic, as is the case for dsDNA. Further, Dudko and colleagues (65) report that the position of the equilibrium state may depend on the applied force leading to a force dependence of the distance between the equilibrium state and the transition state and thus to a nonlinear dependence of the barrier height on the applied force.
Conclusion
The result of this work is a theoretical model that employs a combination of a three-state equilibrium model and the canonical transition state theory to describe the force-induced strand separation of dsDNA tens of basepairs long. The three-state equilibrium model serves as a basis for a free-energy trapping landscape. Double-strand separation occurs through transition states, which we identify as the states with two adjacent basepairs remaining, i.e., one remaining stacking interaction. We calculated the rate of escape as a function of force from the total flux through these transition states, assuming a basepair opening rate of 5 × 10⁸ s−1. The rate of escape in turn allowed us to explicitly calculate the rupture-force distribution for two DNA duplexes, 1 × 2 and 1 × 3. The theoretically obtained results and actual single-molecule atomic force microscopy experiments are in excellent agreement. We argue that in the case of the force-induced DNA strand separation, our model is a significant refinement of the Bell-Evans model and provides a reliable description for forces between 0 and 100 pN. In the future, we foresee this theory being applied to predict, tune, and analyze the behavior of DNA force sensors.
Supporting Material
Methods and Materials and one figure are available at http://www.biophysj.org/biophysj/supplemental/S0006-3495(09)01524-0.
Supporting Material
Acknowledgments
Financial support was provided by the Nanosystems Initiative Munich. D.H., P. S., and K. F. are grateful to the Elite Network of Bavaria (IDK-NBT) for a doctoral fellowship.
Footnotes
Julia L. Zimmermann's present address is Max-Planck-Institut für extraterrestrische Physik, Giessenbachstrasse, 85748 Garching, Germany
References
- 1.Seeman N. DNA in a material world. Nature. 2003;421:427–431. doi: 10.1038/nature01406. [DOI] [PubMed] [Google Scholar]
- 2.Martin M. DNA handles for single molecule experiments. Single Mol. 2000;1:139–144. [Google Scholar]
- 3.Essevaz-Roulet B., Bockelmann U., Heslot F. Mechanical separation of the complementary strands of DNA. Proc. Natl. Acad. Sci. USA. 1997;94:11935–11940. doi: 10.1073/pnas.94.22.11935. [DOI] [PMC free article] [PubMed] [Google Scholar]
- 4.Yan H. DNA-templated self-assembly of protein arrays and highly conductive nanowires. Science. 2003;301:1882–1884. doi: 10.1126/science.1089389. [DOI] [PubMed] [Google Scholar]
- 5.Cohen J.D., Sadowski J.P., Dervan P.B. Addressing single molecules on DNA nanostructures. Angew. Chem. Int. Ed. 2007;46:7956–7959. doi: 10.1002/anie.200702767. [DOI] [PubMed] [Google Scholar]
- 6.Winfree E., Liu F., Wenzler L.A., Seeman N.C. Design and self-assembly of two-dimensional DNA crystals. Nature. 1998;394:539–544. doi: 10.1038/28998. [DOI] [PubMed] [Google Scholar]
- 7.Shawn M.D., Dietz H., Liedl T., Högberg B., Graf F. Self-assembly of DNA into nanoscale three-dimensional shapes. Nature. 2009;459:414–418. doi: 10.1038/nature08016. [DOI] [PMC free article] [PubMed] [Google Scholar]
- 8.Liu Q., Wang L., Frutos A., Condon A., Corn R. DNA computing on surfaces. Nature. 2000;403:175–179. doi: 10.1038/35003155. [DOI] [PubMed] [Google Scholar]
- 9.Albrecht C., Blank K., Lalic-Multhaler M., Hirler S., Mai T. DNA: a programmable force sensor. Science. 2003;301:367–370. doi: 10.1126/science.1084713. [DOI] [PubMed] [Google Scholar]
- 10.Blank K., Lankenau A., Mai T., Schiffmann S., Gilbert I. Double-chip protein arrays: force-based multiplex sandwich immunoassays with increased specificity. Anal. Bioanal. Chem. 2004;379:974–981. doi: 10.1007/s00216-004-2607-0. [DOI] [PubMed] [Google Scholar]
- 11.Blank K., Mai T., Gilbert I., Schiffmann S., Rankl J. A force-based protein biochip. Proc. Natl. Acad. Sci. USA. 2003;100:11356–11360. doi: 10.1073/pnas.1934928100. [DOI] [PMC free article] [PubMed] [Google Scholar]
- 12.Dose C., Ho D., Gaub H.E., Dervan P.B., Albrecht C.H. Recognition of “mirror-image” DNA by small molecules. Angew. Chem. 2007;46:8384–8387. doi: 10.1002/anie.200703007. [DOI] [PubMed] [Google Scholar]
- 13.Ho D., Dose C., Albrecht C.H., Severin P., Falter K. Quantitative detection of small molecule/DNA complexes employing a force-based and label-free DNA microarray. Biophys. J. 2009;96:4661–4671. doi: 10.1016/j.bpj.2009.02.059. [DOI] [PMC free article] [PubMed] [Google Scholar]
- 14.Ho D., Falter K., Severin P., Gaub H.E. DNA as a force sensor in an aptamer-based biochip for adenosine. Anal. Chem. 2009;81:3159–3164. doi: 10.1021/ac802766j. [DOI] [PubMed] [Google Scholar]
- 15.Kufer S.K., Puchner E.M., Gumpp H., Liedl T., Gaub H.E. Single-molecule cut-and-paste surface assembly. Science. 2008;319:594–596. doi: 10.1126/science.1151424. [DOI] [PubMed] [Google Scholar]
- 16.Puchner E., Kufer S., Strackharn M., Stahl S., Gaub H.E. Nanoparticle self-assembly on a DNA-scaffold written by single-molecule cut-and-paste. Nano Lett. 2008;8:3692–3695. doi: 10.1021/nl8018627. [DOI] [PubMed] [Google Scholar]
- 17.Kufer S., Strackharn M., Stahl S., Gumpp H., Puchner E.M. Optically monitoring the mechanical assembly of single molecules. Nat. Nanotechnol. 2009;4:45–49. doi: 10.1038/nnano.2008.333. [DOI] [PubMed] [Google Scholar]
- 18.Rief M., Clausen-Schaumann H., Gaub H.E. Sequence dependent mechanics of single DNA molecules. Nat. Struct. Biol. 1999;6:346–349. doi: 10.1038/7582. [DOI] [PubMed] [Google Scholar]
- 19.Cao Y., Yoo T., Li H. Single molecule force spectroscopy reveals engineered metal chelation is a general approach to enhance mechanical stability of proteins. Proc. Natl. Acad. Sci. USA. 2008;105:11152–11157. doi: 10.1073/pnas.0803446105. [DOI] [PMC free article] [PubMed] [Google Scholar]
- 20.Smith S., Finzi L., Bustamante C. Direct mechanical measurements of the elasticity of single DNA molecules by using magnetic beads. Science. 1992;258:1122–1126. doi: 10.1126/science.1439819. [DOI] [PubMed] [Google Scholar]
- 21.Cluzel P., Lebrun A., Heller C., Lavery R., Viovy J. DNA: an extensible molecule. Science. 1996;271:792–794. doi: 10.1126/science.271.5250.792. [DOI] [PubMed] [Google Scholar]
- 22.Smith S.B., Cui Y.J., Bustamante C. Overstretching B-DNA: the elastic response of individual double-stranded and single-stranded DNA molecules. Science. 1996;271:795–799. doi: 10.1126/science.271.5250.795. [DOI] [PubMed] [Google Scholar]
- 23.Wang M., Yin H., Landick R., Gelles J., Block S.M. Stretching DNA with optical tweezers. Biophys. J. 2005;72:1335–1346. doi: 10.1016/S0006-3495(97)78780-0. [DOI] [PMC free article] [PubMed] [Google Scholar]
- 24.Cocco S., Yan J., Léger J., Chatenay D., Marko J. Overstretching and force-driven strand separation of double-helix DNA. Phys. Rev. E Stat. Nonlin. Soft Matter Phys. 2004;70:011910. doi: 10.1103/PhysRevE.70.011910. [DOI] [PubMed] [Google Scholar]
- 25.Storm C., Nelson P.C. Theory of high-force DNA stretching and overstretching. Phys. Rev. E Stat. Nonlin. Soft Matter Phys. 2003;67:051906. doi: 10.1103/PhysRevE.67.051906. [DOI] [PubMed] [Google Scholar]
- 26.Lebrun A., Lavery R. Modelling extreme stretching of DNA. Nucleic Acids Res. 1996;24:2260–2267. doi: 10.1093/nar/24.12.2260. [DOI] [PMC free article] [PubMed] [Google Scholar]
- 27.Konrad M., Bolonick J. Molecular dynamics simulation of DNA stretching is consistent with the tension observed for extension and strand separation and predicts a novel ladder structure. J. Am. Chem. Soc. 1996;118:10989–10994. [Google Scholar]
- 28.Rouzina I., Bloomfield V.A. Force-induced melting of the DNA double helix 1. Thermodynamic analysis. Biophys. J. 2001;80:882–893. doi: 10.1016/S0006-3495(01)76067-5. [DOI] [PMC free article] [PubMed] [Google Scholar]
- 29.Piana S. Structure and energy of a DNA dodecamer under tensile load. Nucleic Acids Res. 2005;33:7029–7038. doi: 10.1093/nar/gki1010. [DOI] [PMC free article] [PubMed] [Google Scholar]
- 30.Clausen-Schaumann H., Rief M., Tolksdorf C., Gaub H.E. Mechanical stability of single DNA molecules. Biophys. J. 2000;78:1997–2007. doi: 10.1016/S0006-3495(00)76747-6. [DOI] [PMC free article] [PubMed] [Google Scholar]
- 31.Strunz T., Oroszlan K., Schäfer R., Güntherodt H. Dynamic force spectroscopy of single DNA molecules. Proc. Natl. Acad. Sci. USA. 1999;96:11277–11282. doi: 10.1073/pnas.96.20.11277. [DOI] [PMC free article] [PubMed] [Google Scholar]
- 32.Morfill J., Kuhner F., Blank K., Lugmaier R., Sedlmair J. B-S transition in short oligonucleotides. Biophys. J. 2007;93:2400–2409. doi: 10.1529/biophysj.107.106112. [DOI] [PMC free article] [PubMed] [Google Scholar]
- 33.Friedsam C., Wehle A.K., Kuhner F., Gaub H.E. Dynamic single-molecule force spectroscopy: bond rupture analysis with variable spacer length. J. Phys. Condens. Matter. 2003;15:S1709–S1723. [Google Scholar]
- 34.Evans E., Ritchie K. Dynamic strength of molecular adhesion bonds. Biophys. J. 1997;72:1541–1555. doi: 10.1016/S0006-3495(97)78802-7. [DOI] [PMC free article] [PubMed] [Google Scholar]
- 35.Merkel R., Nassoy P., Leung A., Ritchie K., Evans E. Energy landscapes of receptor-ligand bonds explored with dynamic force spectroscopy. Nature. 1999;397:50–53. doi: 10.1038/16219. [DOI] [PubMed] [Google Scholar]
- 36.Oesterhelt F., Rief M., Gaub H.E. Single molecule force spectroscopy by AFM indicates helical structure of poly(ethylene- glycol) in water. N.J. Phys. 1999;1:1–11. [Google Scholar]
- 37.Zimm B.H., Bragg J.K. Theory of the phase transition between helix and random coil in polypeptide chains. J. Chem. Phys. 1959;31:526–535. [Google Scholar]
- 38.Bockelmann U., Essevaz-Roulet B., Heslot F. Molecular stick-slip motion revealed by opening DNA with piconewton forces. Phys. Rev. Lett. 1997;79:4489–4492. [Google Scholar]
- 39.Bockelmann U., Essevaz-Roulet B., Heslot F. DNA strand separation studied by single molecule force measurements. Phys. Rev. E Stat. Phys. Plasmas Fluids Relat. Interdiscip. Topics. 1998;58:2386–2394. [Google Scholar]
- 40.Cocco S., Monasson R., Marko J.F. Force and kinetic barriers to unzipping of the DNA double helix. Proc. Natl. Acad. Sci. USA. 2001;98:8608–8613. doi: 10.1073/pnas.151257598. [DOI] [PMC free article] [PubMed] [Google Scholar]
- 41.Bornschloegl T., Rief M. Single molecule unzipping of coiled coils: sequence resolved stability profiles. Phys. Rev. Lett. 2006;96:118102. doi: 10.1103/PhysRevLett.96.118102. [DOI] [PubMed] [Google Scholar]
- 42.Bornschloegl T., Rief M. Single-molecule dynamics of mechanical coiled-coil unzipping. Langmuir. 2008;24:1338–1342. doi: 10.1021/la7023567. [DOI] [PubMed] [Google Scholar]
- 43.Gotoh O., Tagashira Y. Stabilities of nearest-neighbor doublets in double-helical DNA determined by fitting calculated melting profiles to observed profiles. Biopolymers. 1981;20:1033–1042. [Google Scholar]
- 44.SantaLucia J. A unified view of polymer, dumbbell, and oligonucleotide DNA nearest-neighbor thermodynamics. Proc. Natl. Acad. Sci. USA. 1998;95:1460–1465. doi: 10.1073/pnas.95.4.1460. [DOI] [PMC free article] [PubMed] [Google Scholar]
- 45.Kafri Y., Mukamel D., Peliti L. Why is the DNA denaturation transition first order? Phys. Rev. Lett. 2000;85:4988. doi: 10.1103/PhysRevLett.85.4988. [DOI] [PubMed] [Google Scholar]
- 46.Hanke A., Ochoa M.G., Metzler R. Denaturation transition of stretched DNA. Phys. Rev. Lett. 2008;100:018106. doi: 10.1103/PhysRevLett.100.018106. [DOI] [PubMed] [Google Scholar]
- 47.Kafri Y., Mukamel D., Peliti L. Melting and unzipping of DNA. Eur. Phys. J. B. 2002;27:135–146. [Google Scholar]
- 48.Einert T.R., Naeger P., Orland H., Netz R.R. Impact of loop statistics on the thermodynamics of RNA folding. Phys. Rev. Lett. 2008;101:048103. doi: 10.1103/PhysRevLett.101.048103. [DOI] [PubMed] [Google Scholar]
- 49.Altan-Bonnet G., Libchaber A., Krichevsky O. Bubble dynamics in double-stranded DNA. Phys. Rev. Lett. 2003;90:138101. doi: 10.1103/PhysRevLett.90.138101. [DOI] [PubMed] [Google Scholar]
- 50.Lifson S. Partition functions of linear-chain molecules. J. Chem. Phys. 1964;40:3705–3710. [Google Scholar]
- 51.Rubinstein M., Colby R.H. Oxford University Press; Oxford, United Kingdom: 2003. Polymer Physics. [Google Scholar]
- 52.Kuhner F., Erdmann M., Sonnenberg L., Serr A., Morfill J. Friction of single polymers at surfaces. Langmuir. 2006;22:11180–11186. doi: 10.1021/la061704a. [DOI] [PubMed] [Google Scholar]
- 53.Polanyi M., Wigner E. Regarding the interference of resonant oscillations as the cause of energy fluctuations and chemical reactions. Z. Phys. Chem. Abt. A. 1928;139:439. [Google Scholar]
- 54.Hänggi P., Talkner P., Borkovec M. Reaction-rate theory: fifty years after Kramers. Rev. Mod. Phys. 1990;62:251–342. [Google Scholar]
- 55.Bockelmann U., Thomen P., Heslot F. Dynamics of the DNA duplex formation studied by single molecule force measurements. Biophys. J. 2008;87:3388–3396. doi: 10.1529/biophysj.104.039776. [DOI] [PMC free article] [PubMed] [Google Scholar]
- 56.Andreatta D., Sen S., Lustres J., Kovalenko S., Ernsting N. Ultrafast dynamics in DNA: “fraying” at the end of the helix. J. Am. Chem. Soc. 2006;128:6885–6892. doi: 10.1021/ja0582105. [DOI] [PMC free article] [PubMed] [Google Scholar]
- 57.Guéron M., Leroy J.L. Studies of base pair kinetics by NMR measurement of proton exchange. Methods Enzymol. 1995;261:383–413. doi: 10.1016/s0076-6879(95)61018-9. [DOI] [PubMed] [Google Scholar]
- 58.Butt H.J., Jaschke M. Calculation of thermal noise in atomic-force microscopy. Nanotechnology. 1995;6:1–7. [Google Scholar]
- 59.Kühner F., Erdmann M., Gaub H.E. Scaling exponent and Kuhn length of pinned polymers by single molecule force spectroscopy. Phys. Rev. Lett. 2006;97:218301. doi: 10.1103/PhysRevLett.97.218301. [DOI] [PubMed] [Google Scholar]
- 60.Albrecht C., Neuert G., Lugmaier R., Gaub H.E. Molecular force balance measurements reveal that double-stranded DNA unbinds under force in rate-dependent pathways. Biophys. J. 2008;94:4766–4774. doi: 10.1529/biophysj.107.125427. [DOI] [PMC free article] [PubMed] [Google Scholar]
- 61.Birshtein T.M., Ptitsyn O.B. John Wiley; New York: 1966. Conformations of Macromolecules. [Google Scholar]
- 62.Rupprecht A., Piskur J., Schultz J., Nordenskiöld L., Song Z. Mechanochemical study of conformational transitions and melting of Li-, Na-, K-, and CsDNA fibres in water-ethanol solutions. Biopolymers. 1994;34:897–920. [Google Scholar]
- 63.Buhot A., Halperin A. Extension of rod-coil multiblock copolymers and the effect of the helix-coil transition. Phys. Rev. Lett. 2000;84:2160–2163. doi: 10.1103/PhysRevLett.84.2160. [DOI] [PubMed] [Google Scholar]
- 64.Hyeon C., Thirumalai D. Measuring the energy landscape roughness and the transition state location of biomolecules using single molecule mechanical unfolding experiments. J. Phys. Condens. Matter. 2007;19:113101. [Google Scholar]
- 65.Dudko O.K., Filippov A.E., Klafter J., Urbakh M. Beyond the conventional description of dynamic force spectroscopy of adhesion bonds. Proc. Natl. Acad. Sci. USA. 2003;100:11378–11381. doi: 10.1073/pnas.1534554100. [DOI] [PMC free article] [PubMed] [Google Scholar]
Associated Data
This section collects any data citations, data availability statements, or supplementary materials included in this article.