

Abstract
Molecular cancer diagnostics are an important clinical advance in cancer management, but new methods are still needed. In this context, gene expression signatures obtained by microarray represent a useful molecular diagnostic. Here, we describe novel probe-level microarray analyses that reveal connections between mRNA processing and neoplasia in multiple tumor types, with diagnostic potential. We now show that characteristic differences in mRNA processing, primarily in the 3′-untranslated region, define molecular signatures that can distinguish similar tumor subtypes with different survival characteristics, with at least 74% accuracy. Using a mouse model of B-cell leukemia/lymphoma, we find that differences in transcript isoform abundance are likely due to both alternative polyadenylation (APA) and differential degradation. While truncation of the 3′-UTR is the most common observed pattern, genes with elongated transcripts were also observed, and distinct groups of affected genes are found in related, but distinct tumor types. Genes with elongated transcripts are overrepresented in ontology categories related to cell-cell adhesion and morphology. Analysis of microarray data from human primary tumor samples revealed similar phenomena. Western blot analysis of selected proteins confirms that changes in the 3′-UTR can correlate with changes in protein expression. Our work suggests that alternative mRNA processing, particularly APA, can be a powerful molecular biomarker with prognostic potential. Finally, these findings provide insights into the molecular mechanisms of gene deregulation in tumorigenesis.
Keywords: cancer, polyadenylation, microarray, biomarker, mRNA processing, tumor
Introduction
A major challenge in the clinical management of many human cancers is the early deployment of the most efficacious treatment strategy. To make optimal clinical decisions it is essential to accurately stratify patients according to risk and likelihood of favorable response. However, such stratification is confounded by significant phenotypic heterogeneity in some tumor types, often without obvious criteria for subdivision. Therefore, there is a critical need for better molecular cancer diagnostics that strongly correlate with prognosis and therapy responsiveness.
Expression microarrays provide one means of measuring molecular changes that accompany tumorigenesis, and have been used successfully to stratify tumors in a number of cancer types (1-4). Microarray-based studies of the gene expression in cancer commonly treat all isoforms of a gene as equivalent, and report only differences in overall, summarized transcript level. This simplification can blind such studies to changes in the relative abundance among isoforms that arise due to alternative processing, such as alternative splicing, polyadenylation or transcription initiation (5-7).
Selection between transcript isoforms can be regulated either at the time of generation or subsequently through isoform-specific degradation. Isoforms with APA sites necessarily differ in their 3′-untranslated region (3′-UTR), a region that frequently includes regulatory elements that mediate transcript stability, as well as translational efficiency and sub-cellular localization (8-12). Accordingly, transcript isoforms with APA sites will respond differently to trans-acting factors that target the differential part of the 3′-UTR.
Studies of corrupted 3′-UTR mediated regulation in cancer have commonly focused on deregulation of transcript stability (8, 13, 14). MicroRNAs, which preferentially target 3′-UTRs in metazoans, can be broadly deregulated in various cancers (15-17), and microarray expression profiles of miRNA have been used to classify different tumor subtypes (15, 18, 19).
More recent reports reveal a bias towards transcripts with relatively short 3′-UTRs in proliferating cells (6) and also in some cancer cell lines (20). We now extend these findings through analysis of primary tumor samples drawn from a mouse leukemia/lymphoma model system. Mice that are deficient in the nonhomologous end-joining (NHEJ) pathway of DNA double strand break repair and the tumor suppressor p53 nearly inevitably develop progenitor (pro) B-cell neoplasia. These mice develop highly similar tumor subtypes characterized by distinct chromosomal rearrangements that activate either the Myc or Mycn cellular proto-oncogene (21-25), providing us with a system to investigate mRNA processing profiles in well-defined and highly related cancer subtypes.
We report that widespread alternative mRNA 3′-processing, identified through probe-level analysis of microarray data, can be a common feature of tumorigenesis. Analysis of data from three histologically indistinguishable mouse lymphoma subtypes revealed significant and characteristic changes in mRNA processing of several hundred genes, including genes that act in development, metabolism, cell cycle control, and cell-to-cell contact and communication. Our findings imply that alternative 3′ processing may directly contribute to mechanistically important genetic deregulation in cancer. Importantly, 3′ processing signatures, defined by sets of genes with tumor-specific processing, could correctly classify subtypes with a minimum of 74% accuracy. Interestingly, we find significant processing differences between two tumor subtypes that share amplification of the Myc oncogene but differ in DNA repair capacity, resulting from the underlying DSB repair defects. Extension of our analysis to microarray data from human primary tumor samples, including breast cancer and melanoma, revealed similar distinguishing patterns. Our results provide novel insights into molecular mechanisms of tumorigenesis and potential new diagnostic biomarkers.
Materials/Methods
Mice, Tumors, and Cells
Double mutant (Lig4 Trp53 or Dclre1c/Art Trp53) mice with at least 95% C57BL/6J genetic content were generated as previously described. (26-28). Tumor subtypes are classified as LPC (Lig4, Trp53 knockout, Myc amplification), APC (Dclre1c/Art, Trp53 knockout, Myc amplification), and APN (Dclre1c/Art, Trp53 knockout, Mycn amplification). All animal work was carried out in accordance with IACUC approved protocols. Standard techniques were used for flow cytometry, histopathology, and tissue generation for microarrays. Detailed descriptions are available in Supplemental methods.
Identification of genome wide alternative processing of genes
Standard protocols for the Affymetrix GeneChip Mouse Genome 430 version 2.0 were followed to isolate RNA and generate all microarray data. Microarray data from 11 APC, 6 APN, 6 LPC and 4 mature B-cell samples were respectively compared to that from 2 normal pro-B-cell samples to determine differential processing of genes using the Rmodel algorithm (29). The array data can be accessed in GEO via accession # GSE15808.
The Rmodel algorithm (29) identifies segmentation points in the probeset for a given gene when comparing the expression in two samples. Analyzed genes were restricted to those classified as expressed in at least two samples by the MAS5 algorithm (α = 0.05) (30). The specific signature of interest is a segmentation where the sample-to-sample ratio of hybridization signal differs on either side of the segmentation point. All possible segmentation points were tested, comparing the intensity ratios of the three probes immediately upstream and downstream of the putative segmentation point using a modified t-test. Log2 ratios were calculated for each test array (tumor or mature B-cells) compared to the average of two pro-B-cell arrays. Segmentation points were called for comparisons with t-value >= 6.0 and log2-ratio difference (rdiff) greater than 1.5. Segmentations are classified as truncations when the downstream (3′) probes show decrease in signal relative to the upstream (5′) probes, and elongations for the converse. False discovery rate (FDR) for these thresholds was estimated as 0.05 based on a permutation analysis (Supplemental Methods).
The standard protocols for Affymetrix 430v2 microarray hybridization include an oligo-dT priming, and its microarray probes were accordingly designed with a significant positioning bias towards the 3′-end of most genes. This bias, combined with the general absence of introns in the 3′-UTR, makes alternate polyadenylation the most likely event to be detected. Our studies show that at least 70% of the genes that contain any processing sites have only one segmentation point (Supplemental Table S1).
Determining cell-type specific signatures
To determine the genes and segmentations best able to distinguish among the samples, rdiff was calculated for each possible segmentation point, and the ensemble of such differences was compared between all pairs of tumor types with a modified t-test. Thresholds for inclusion in the signature sets were determined empirically for best performance in the cross-validation (below) as |t| ≥ 5.0 and |Δrdiff| ≥ 0.75. Thresholds for human cancer heatmaps were also determined empirically as |t| ≥ 6.0, |Δrdiff| ≥ 2 for the melanoma set and |t| ≥ 5.0, |Δrdiff| ≥ 1 for the breast cancer set. Further details are available in Supplemental Methods. The heatmap was generated using JMP statistical software (http://www.jmp.com/), and bootstrap p-values for the clustering were generated with R (http://www.R-project.com/) using the pvclust package (31).
Cross validation analysis
An internal cross-validation analysis was performed to distinguish lymphoma subtypes from one another, repeatedly and systematically using all but one of the 11 APC, 6 APN and 6 LPC samples to generate a signature set (described above) and then testing the excluded APC, APN, and LPC sample with the signature set. Ratio differences were calculated at each segmentation point in the signature set for each of the three test samples. Treating the ratio differences as a multi-dimensional coordinate system, a Euclidean distance metric was used to classify the test samples as the closest training sample (APC, APN or LPC). In this manner, each APC sample was tested 36 times, while each LPC or APN sample was tested 66 times. A final count of success or failure in prediction of lymphoma subtype was calculated to determine the percentage of accurate predictions for each subtype of lymphoma.
Extending the analysis to human samples
Microarray data from human samples were selected from GEO for similar analysis. Samples were selected from those using the 3′-end-targeted Affymetrix HU133 Plus version 2 microarray. Analyzed samples were restricted to those with multiple biological replicates of similar tumor types drawn from primary tumors rather than cell-lines, and with the exception of the Cisplatin-resistant cell line study (GSE15709), were required to include at least one type of control normal tissue sample.
Results
p53/NHEJ-deficient mice develop lymphomas with distinct survival outcomes
Mice lacking p53 and the core NHEJ factor DNA Ligase IV (Lig4) develop pro-B-cell lymphomas with frequent genomic amplification of Myc (LPC). Mice lacking p53 and the accessory NHEJ factor Artemis (Art/Dclre1c) develop lymphomas with either Myc or Mycn amplification (APC or APN, respectively). LPC, APC and APN lymphomas are associated with significantly different survival profiles (Figure 1A), yet the tumors are histologically (Figure 1B) and immunophenotypically (Figure 1C) indistinguishable. LPC mice showed the shortest overall survival profile, with a median survival of approximately 6.6 weeks, and a maximum of 10 weeks. The APC cohort showed significantly longer overall survival, with median survival ∼9.5 weeks and maximum 13 weeks. APN mice exhibited the longest overall survival with median survival ∼13 weeks and maximum 20 weeks.
Figure 1. Histologically similar Pro-B-cell lymphoma subtypes are distinguishable only by survival.
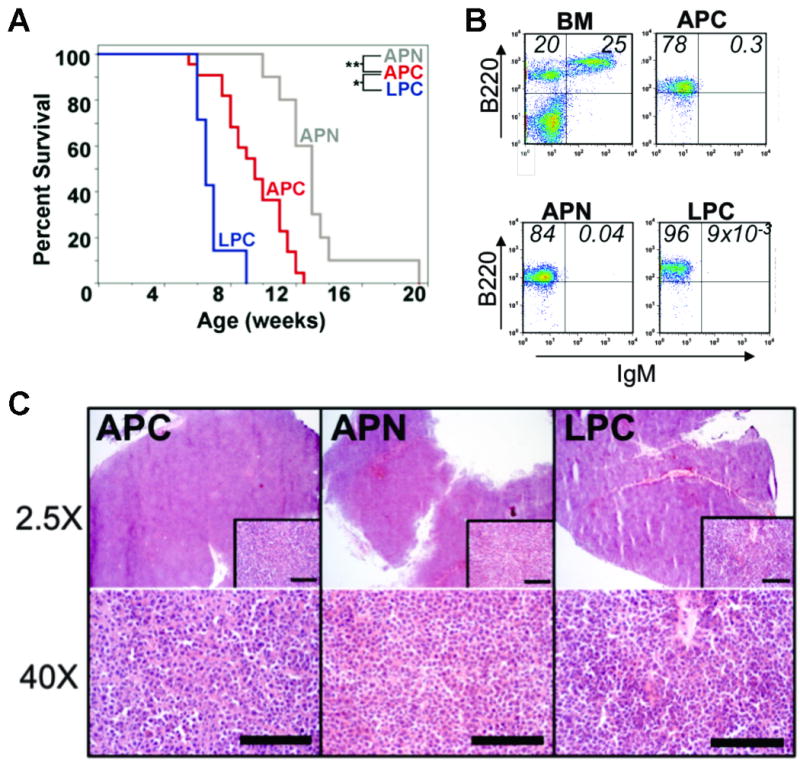
(A) Kaplan-Meier survival analysis of APN (red), APC (blue), and LPC (gray) mice. Shown is percent surviving versus age in weeks. * p=6.96×10⁻⁵, ** p=1.95×10⁻⁶ (B) Flow cytometric analysis of normal bone marrow (BM), and APC, APN, or LPC lymphomas, using cells stained for the pan-B cell marker B220, and the developmental marker IgM. Percentages of B220+ IgM- (single positive) and B220+ IgM+ (double positive) cells are indicated in the corresponding quadrants. (C) Histological analysis of APC, APN, and LPC lymphomas. Hematoxylin and esosin (H&E) stained sections were imaged at 2.5× (upper panels) or 40× magnification (inset and lower panels). Scale bar = 400 × 10-6m
Pro-B-cell lymphomas exhibit genome wide changes in mRNA processing
To analyze mRNA processing in the mouse pro-B cell lymphomas Affymetrix Mouse Genome 430 Version 2 (430v2) microarrays were prepared for each of the three subtypes of lymphomas. The samples included of 6 LPC, 11 APC, and 6 APN lymphomas, as well as 2 normal pro-B-cell samples and 4 normal mature B-cell samples. MAANOVA (32) analysis between the subtypes of lymphomas revealed inconsistent numbers of probesets with significant differential expression (Supplemental Table S2), but did not provide simple interpretation or differentiation. By contrast, a novel probe-level analysis revealed significant differences in individual mRNA isoforms in tumors versus control samples, and between tumor sub-types. All tumor samples, as well as mature B-cell controls, were compared to the normal pro-B-cells, and accordingly all reported changes in processing are relative to the processing in pro-B-cells. This analysis was limited to ∼13,000 genes that were identified as expressed in at least one of the samples (MAS 5.0, α = 0.05, (30)). By this approach, we observed alternative mRNA processing in 841, 840, 811, and 842 genes, respectively, in LPC, APC, APN and mature B-cell samples (FDR = 0.05).
To further validate the 3′UTR processing changes observed by microarray analysis, we focused additional analyses on two genes that show clear evidence of alternative processing: Ubiquitin conjugating enzyme 2A (Ube2a), which provides an example of a gene with relative loss of signal in an extended 3′-UTR; and phosphoinositide-3-kinase adaptor protein 1 (Pik3ap1) which provides the counterexample of a gene with relative gain of signal in an extended 3′-UTR (Figure 2A-B). Ube2a, whose protein product catalyzes the covalent attachment of ubiquitin and is required for post replication repair of ultraviolet damaged DNA (33), has two transcript isoforms with APA sites (Figure 2A) with no change in protein isoforms. The 430v2 microarray has 15 probes targeting Ube2a, including probes that measure both isoforms (probes 1-6) or only the extended isoform (probes 7-15). All lymphoma subtypes show a common segmentation point between probes 6 and 7, which flank the proximal polyadenylation site (Figure 2A). Probes 1-6 indicate only a slight reduction in signal in the lymphoma samples compared to the pro-B-cell. Probes 7-15 imply ∼3-fold reduction of signal in the extended 3′-UTR in the lymphoma samples. In contrast, comparison of mature B-cells and pro-B-cells reveals loss of signal at all probes with no segmentation point (green boxplot in Figure 2A), implying uniform degradation of both transcripts during normal B-cell maturation. Pik3ap1 is noteworthy in that the processing changes are not the same in all lymphoma subtypes. Only Art deficient mice (APC and APN, red and blue boxplots in Figure 2B) exhibit the segmentation point in Pik3ap1. LPC samples show a uniform decrease in signal across all probes (grey), while mature B-cells show essentially no change in signal at all probes (green).
Figure 2. Probe-level analysis of microarray expression data reveals non-uniform changes in expression within genes.

All plots shows base-2 logarithms of the ratio of normalized, background-corrected hybridization signal at each individual probe. Boxplots represent the observed values for 6 APN (gray), 11 APC (red), 6 LPC (blue), and 4 mature B-cell (green) measurements, each compared with 2 wildtype progenitor B-cell replicates. Positions of the probes along each gene are shown at the top of each plot. The ratio difference is the difference between the average base-2 logarithm expression change ratio on either side of the segmentation point. (A) Ube2a displays preferential loss of signal in the 3′-terminal portion of the transcript in all lymphoma subtypes, but uniform degradation in mature B-cells. (B) Pik3ap1 displays preferential loss of signal in the proximal 3′-UTR in APC and APN, uniform degradation in LPC, and no change in mature B-cells. (C) Cstf3 displays preferential gain in a truncated, non-translated transcript, potentially indicative of a feedback loop (37, 38). The Csft3 transcript is truncated in APN, APC, LPC and mature B-cells. The long and short isoforms are shown in blue.
The relative gain or loss of the extended 3′-UTR of 6 genes (Ube2a, Cstf3, Serbp1, Sfrs7, Pik3ap1, and Sf3b1) was independently verified via quantitative RT-PCR (Supplemental Figure S1 and Supplemental Tables S3-S4). Transcripts for testing were chosen as a mixture of truncation and elongation as well as common and disparate between samples. Consistent with previous studies (6, 20), all tumor samples, as well as mature B-cells, showed more truncation than elongation of the 3′-UTR (Figure 3).
Figure 3. Systematic changes in processing within the 3′-UTR imply trend toward net truncation of the 3′-UTR for all four samples.

The plot shows the count of genes with relative loss (truncation, e.g., Ube2a) or gain (elongation, e.g., Pik3ap1) of hybridization signal in the distal 3′-UTR compared to the proximal 3′-UTR, with analysis limited to genes with one significant processing event.
Gene Ontology (GO (34)) analysis of the specific genes targeted for alternative processing during tumorigenesis was performed with GOStat (35). Given the potentially different fates of transcripts with elongated and truncated 3′-UTR, separate lists were generated and tested for each. The truncated genes produced more significant results and were dominated by terms related to regulation and metabolism for all tumor types, as well as mature B-cells (Supplemental Table S5). In contrast, the genes with elongated transcripts in tumor samples included significant overrepresentation of processes related to cell-to-cell adhesion and structural formation (Supplemental Table S6). As a further test, we identified all genes with either a single elongation or truncation in at least two of the tumors, but not in the mature B-cells. The GOstat analysis (Supplemental Tables S7 and S8), confirmed the overrepresentation of adhesion and morphogenesis in elongated genes and regulation and metabolism in truncated genes.
Alteration of the 3′-UTR can be correlated with change in protein expression
To evaluate whether alterations in 3′-processing affected translation, protein products of Ube2a and CstF3 were measured by Western blot. UBE2A protein levels were assessed in lymphomas and mature B-cells, compared to normal pro-B-cells. The microarray analysis (Figure 2A) indicated nearly equivalent expression of the coding region of the Ube2a transcript, but a significant reduction the 3′-extended isoform, in tumors. Western blot analysis revealed elevated UBE2A protein levels in nearly all lymphoma samples (Figure 4A), but significant reduction in expression in mature B-cells. These results suggest that the difference in UBE2A protein expression is due to the loss of regulatory elements in the extended 3′-UTR. Indeed, examination of the extended 3′-UTR revealed putative miRNA targets as well as potential AU-rich elements (36) (Supplemental Figure S2).
Figure 4. Western blot analysis of UBE2A and CSTF3 protein reveals increased expression in lymphoma samples.

(A) UBE2A protein abundance is increased in lymphoma cells compared to progenitor B-cells, in contrast to portion of the transcript containing the CDS (Figure 2a), suggesting the presence of a translation suppressing element in the extended 3′-UTR. (B) CSTF3 protein expression is increased in eight of 10 lymphoma samples, but significantly decreased in mature B-cells. Bar plots at right summarize the tumor types with bars showing the standard error.
Similar analysis was performed for the RNA-processing gene CstF3, a target chosen for its regulatory role in APA, including a negative feedback loop controlling selection of its own 3′-processing site (37-39). Excess CSTF3 protein expression favors production of a truncated transcript isoform that does not produce functional CSTF3. Probe-level analysis indicated increased use of the truncated isoform in all lymphoma samples and mature B-cells (Figure 2C), which could potentially result from increased CSTF3 protein. Consistent with this prediction, western analysis confirmed that CSTF3 protein expression was increased in eight of ten lymphoma samples compared to pro-B-cells (Figure 4B). This likely indicates aberrant regulation of CSTF3, since the truncated transcripts in mature B-cells are associated with reduced protein levels. Such B-cell specific APA is consistent with previous findings, e.g., as mediated by changes in CSTF2 expression (40).
Differentially expressed isoforms in lymphoma can bear evidence of MicroRNA-based gene regulation
If the changes in isoform distribution are due to differential stability mediated by 3′-UTR regulatory elements, then a common pattern (or group of patterns) should be present within the portion of transcripts that differ between isoforms. To test this, sequences from genes were grouped in sets based on whether or not the hybridization signal in the extended isoform was relatively increased (“differentially included sequence” or DIS) or decreased (differentially excluded sequence” or DES) compared to the short isoform. Since miRNAs typically target 3′-UTRs, we searched for patterns in the DES and DIS that could be associated with known miRNAs, specifically assessing differential abundance of hexamers and subsequently intersecting significantly differential hexamers with seed regions of known miRNAs.
As in previous work (6), results were dominated by the difference in sequence length, as the DES are on average 50% longer than DIS sequences (data not shown). Several hexamers that match miRNA seeds with known deregulation in myeloid neoplasia are significantly overrepresented in the DES compared to the DIS (Supplemental Table S9). For example, CUGUUG, which matches the seed region of miR-421 (known to be upregulated in DLBCL (41)), occurs significantly more frequently in DES than DIS in LPC lymphomas, a result consistent with increased expression of miR-421 that results in destabilization of long isoforms of genes that include a miR-421 binding site in the extended 3′-UTR.
Specific differentially processed sets of genes can distinguish between tumor types
Since segmentations can vary between lymphoma subtypes (e.g., Pik3ap1), all genes and putative segmentations were examined in all lymphomas and in mature B-cells. A heatmap representation of genes with differential processing between lymphoma subtypes (Figure 5A) reveals the distinct patterns. An internal cross-validation analysis was implemented to test the diagnostic capacity of the observed mRNA processing, repeatedly splitting the microarray data into two sets, one for model training and one for subsequent testing. Using training set sizes of 10 APC, 5 APN and 5 LPC samples, the excluded LPC, APC, and APN samples were correctly assigned at rates of 100%, 92% and 74%, respectively. Inspection of the prediction errors, limited to the two Art-knockout mice, revealed that a small number of samples that were repeatedly incorrectly predicted, suggesting the possibility of heterogeneity within the tumor classes (Supplemental Tables S10-S11). GOstat analysis of the genes whose transcripts were identified as differentially processing among the tumor types showed categories related to cell cycle, protein processing, and DNA repair (Supplemental Table S12).
Figure 5. Characteristic signatures of alternative processing.

Blue and red indicate relative loss (e.g., Ube2a) or gain (e.g., Pik3ap1), of signal in downstream probes, respectively, and the intensity of the color reflects the ratio difference (Figure 2). Each column represents a single gene and segmentation point; each row represents the analysis of an individual microarray averaged over comparison with control microarrays. In this supervised clustering, genes were selected as those that best differentiated between samples. Bootstrapping probabilities are shown for selected clusters. Complete bootstrap results are available in Supplemental Figures S5-S7. (A) Mouse pro-B-cell lymphoma samples. Control samples were wildtype progenitor B-cells. (B) Human melanoma (GSE7553), including basal cell carcinoma (BCC), squamous cell carcinoma (SCC), primary melanoma (PM), and metastatic melanoma (MM) (43). Control samples were normal human skin. (C) Human breast cancer (GSE7904), including sporadic basal-like cancers (BLC), BRCA1associated cancers (BRCA1), and non BLC tumors (NBLC). Controls were normal human breast tissue.
To show the broader applicability of our findings, we analyzed publicly available (42) microarray data from several human cancer samples, including melanoma (Figure 5B, GEO Accession GSE7553 (43)) and breast cancer (Figure 5C, GEO Accession GSE7904). In each case, a supervised clustering revealed distinct, reproducible patterns among the subtypes of tumor. GOStat analyses of the differential genes revealed significantly overrepresented categories, including structural development, cell adhesion, and gene regulation in the melanoma set (Supplemental Table S13), and structural development, protein kinase activity, gene regulation, and cell differentiation in the breast cancer set (Supplemental Table S14). We intersected the GO categories identified as overrepresented (p < 0.001) in all three differential sets, and found twenty-two common terms (Supplemental Table S15), including multiple categories related to early development, vasculature, and regulatory processes.
We also obtained and analyzed replicate microarrays drawn from cell cultures generated from human ovarian cancer that are either sensitive or resistant to the chemotherapeutical agent cisplatin (GEO Accession GSE15709 (44)). The analysis revealed 158 genes with evidence of mRNA processing differences (Supplemental Table S16), including 77 truncations and 81 elongations in the comparison of resistant to sensitive cells. Indentified genes included several with known cancer phenotypes, e.g., Mybl1, Pdgfc, and Cdkn2c). GOstat analysis of the complete set (Supplemental Table S17) showed overrepresentation of development, regulation, and structural development categories. Intriguingly, separate analyses of truncated (Supplemental Table S18) and elongated (Supplemental Table S19) genes showed that elongated genes have significant overrepresented of multiple categories related to negative regulation of cellular and metabolic processes.
Discussion
Working with data from primary tumor tissues, we have shown that alterations in post-transcriptional mRNA processing are a significant component of transcriptional deregulation in multiple cancer types. We provide evidence that aberrations in post-transcriptional processing can exert systemic changes in key cancer-related pathways, suggesting that changes to post-transcriptional mRNA processing are likely to be major oncogenic events that contribute to the overall tumor phenotype. In this context, our data suggests that 3′ processing profiles could be exploited for cancer diagnosis. Indeed, consistent with this notion, we find that differences in mRNA processing, and specifically alteration of the 3′-end of the transcripts, have diagnostic capacity in discerning between closely related subtypes of tumors. Further study will determine if individual, misprocessed genes might represent therapeutic targets.
Consistent with other recent studies (6, 20), our analysis of APA sites in a common terminal exon, as well as similar analysis of genes without evidence of alternative processing (Supplemental Figure S10), reveal clear evidence that these primary tumors are biased towards truncated terminal 3′-UTRs. However, genes whose transcripts showed elongation in B-cell lymphomas significant overrepresentation of GO categories related to cell-to-cell adhesion, and structural morphogenesis and development. Similarly, analysis of the genes with elongated transcripts in cisplatin-resistant ovarian cancer cell lines, revealed overrepresentation of genes related to structural development and negative regulation of metabolism. Under the growing model that extended 3′-UTRs reduce stability and/or translation (6, 10, 20), our results suggest that while truncation is more prevalent, elongation of selected messages can also enhance tumorigenesis.
The observed changes in the 3′-terminal portion of transcripts could arise through at least three distinct mechanisms that would give identical or nearly identical microarray signatures. (1) changes in selection among APA sites; (2) differences in transcript stability that are mediated by sequences that are included or excluded based on polyA site selection; and (3) transcription initiation within the 3′-UTR (45). Our analysis supports roles for each of the first two effects, and does not eliminate the third. Our results strongly support a role for systematic alteration of polyA site selection in all classes of lymphoma compared to either progenitor or mature B-cells. CSTF3 protein is expressed at significantly higher levels in tumors (Figure 4) than in either stage of B-cell. Changes in transcript expression, either in processing or abundance is also apparent for several other 3′-processing factors (Supplemental Figures S8 and S9), including the apparent loss of normal B-cell processing changes in Cpsf2 and Pcf11 transcripts. Taken together, these data support a model with changes in the absolute expression and stoichiometry of 3′-processing factors distinct from those observed in the comparison of mature B-cells and pro-B-cells (40, 46), likely leading to changes in polyA site selection. Overrepresentation of putative miRNA target sites in the extended 3′-UTRs of up- or downregulated isoforms supports a role for changes in stability based on miRNA activity. The correlation of the abundance of putative miRNA binding sites with known activity in human B-cell lymphomas lends further support to this model. Critically, regardless of exactly which mechanism is responsible, all sources of the processing change reflect a change in regulatory activity of the cell.
Previous analyses of tumorigenesis have frequently focused on the roles of specific oncogenes such as Myc. Because the lymphomas occurring in APC and LPC mice share a common amplified oncogene (Myc), it is likely that the phenotypic differences between LPC and APC tumors – processing profiles and survival – are attributable to the differences in the underlying NHEJ deficiencies. Our findings suggest a model in which 3′-processing changes are linked, either directly or indirectly, to unrepaired DNA double strand breaks. This would provide a mechanistic connection between genotoxic stress load and large-scale changes in gene expression programs, and could suggest a novel mode of genetic deregulation in cancer development. Direct connection between mRNA polyadenylation and UV-induced DNA damage or replication stress has been reported (47-50). BARD1 (BRCA1-associated ring domain 1) protein, which forms a complex with BRCA1, interacts with CSTF1 to inhibit erroneous and potentially deleterious polyadenylation at UV-damaged DNA loci (48). We propose that an analogous DNA damage response mechanism connects DSBs to 3′-processing machinery, and that this response elicits altered 3′ processing profiles under persistent DNA damage in tumors.
Patients with the same gross cancer diagnosis often respond dramatically differently to the same treatment regimen, a likely consequence of both individual genetic variation and tumor-specific properties. Analysis of three groups of related but distinct mouse tumor types universally revealed that the pattern of genes with alternative mRNA processing was different between even seemingly closely related, but clinically distinct, tumor subtypes. The groups of common and disparate genes among the different tumors should provide novel insights into the molecular basis for their different outcomes, while also providing new biomarkers with diagnostic capability.
Our preliminary studies of two ovarian cancer cell lines that differ in resistance to cisplatin suggest that analysis of 3′ transcript processing may also have translational applicability. Our analysis revealed 158 genes with evidence of differences in mRNA processing between the samples, including multiple genes with known roles in tumor generation and metastasis. This suggests that 3′ processing signatures might provide predictive biomarkers for specific treatment responsiveness in some cancers.
Precise characterization of tumorigenic molecular anomalies will not only permit the design of highly specific therapeutics that have fewer widespread side effects, but will also allow customization of treatment regimens specifically tailored to individual patients' particular needs. The studies presented here represent a novel and general means of assessing the molecular changes that can distinguish tumors that are otherwise indistinguishable.
Supplementary Material
Acknowledgments
The authors thank Anne Peaston, Roger Sher, Janet Rowley, Daniela Kamir, and Michael Brockman for critical reading of the manuscript. The authors thank Jesse Salisbury for developmental work on Rmodel. This work was supported in part by NIH grant R01GM072706 (JHG and PS), pilot project funds from NCI Core grant 2P30CA034196 (JHG and PS), and NCI grant R01CA115665 (SMW, TLA, and KDM).
References
- 1.Bullinger L, Valk PJ. Gene expression profiling in acute myeloid leukemia. J Clin Oncol. 2005;23:6296–305. doi: 10.1200/JCO.2005.05.020. [DOI] [PubMed] [Google Scholar]
- 2.Mano H. Stratification of acute myeloid leukemia based on gene expression profiles. Int J Hematol. 2004;80:389–94. doi: 10.1532/ijh97.04111. [DOI] [PubMed] [Google Scholar]
- 3.Mischel PS, Cloughesy TF, Nelson SF. DNA-microarray analysis of brain cancer: molecular classification for therapy. Nat Rev Neurosci. 2004;5:782–92. doi: 10.1038/nrn1518. [DOI] [PubMed] [Google Scholar]
- 4.Perez-Diez A, Morgun A, Shulzhenko N. Microarrays for cancer diagnosis and classification. Adv Exp Med Biol. 2007;593:74–85. doi: 10.1007/978-0-387-39978-2_8. [DOI] [PubMed] [Google Scholar]
- 5.Kwan T, Benovoy D, Dias C, et al. Genome-wide analysis of transcript isoform variation in humans. Nat Genet. 2008;40:225–31. doi: 10.1038/ng.2007.57. [DOI] [PubMed] [Google Scholar]
- 6.Sandberg R, Neilson JR, Sarma A, Sharp PA, Burge CB. Proliferating cells express mRNAs with shortened 3′ untranslated regions and fewer microRNA target sites. Science. 2008;320:1643–7. doi: 10.1126/science.1155390. [DOI] [PMC free article] [PubMed] [Google Scholar]
- 7.Wang ET, Sandberg R, Luo S, et al. Alternative isoform regulation in human tissue transcriptomes. Nature. 2008 doi: 10.1038/nature07509. [DOI] [PMC free article] [PubMed] [Google Scholar]
- 8.Audic Y, Hartley RS. Post-transcriptional regulation in cancer. Biol Cell. 2004;96:479–98. doi: 10.1016/j.biolcel.2004.05.002. [DOI] [PubMed] [Google Scholar]
- 9.Conne B, Stutz A, Vassalli JD. The 3′ untranslated region of messenger RNA: A molecular ‘hotspot’ for pathology? Nat Med. 2000;6:637–41. doi: 10.1038/76211. [DOI] [PubMed] [Google Scholar]
- 10.Kuersten S, Goodwin EB. The power of the 3′ UTR: translational control and development. Nat Rev Genet. 2003;4:626–37. doi: 10.1038/nrg1125. [DOI] [PubMed] [Google Scholar]
- 11.Wickens M, Bernstein DS, Kimble J, Parker R. A PUF family portrait: 3′ UTR regulation as a way of life. Trends Genet. 2002;18:150–7. doi: 10.1016/s0168-9525(01)02616-6. [DOI] [PubMed] [Google Scholar]
- 12.Wilkie GS, Dickson KS, Gray NK. Regulation of mRNA translation by 5′ - and 3′-UTR-binding factors. Trends Biochem Sci. 2003;28:182–8. doi: 10.1016/S0968-0004(03)00051-3. [DOI] [PubMed] [Google Scholar]
- 13.Lebwohl DE, Muise-Helmericks R, Sepp-Lorenzino L, et al. A truncated cyclin D1 gene encodes a stable mRNA in a human breast cancer cell line. Oncogene. 1994;9:1925–9. [PubMed] [Google Scholar]
- 14.Lopez de Silanes I, Quesada MP, Esteller M. Aberrant regulation of messenger RNA 3′-untranslated region in human cancer. Cell Oncol. 2007;29:1–17. doi: 10.1155/2007/586139. [DOI] [PMC free article] [PubMed] [Google Scholar]
- 15.Calin GA, Liu CG, Sevignani C, et al. MicroRNA profiling reveals distinct signatures in B cell chronic lymphocytic leukemias. Proc Natl Acad Sci U S A. 2004;101:11755–60. doi: 10.1073/pnas.0404432101. [DOI] [PMC free article] [PubMed] [Google Scholar]
- 16.Esquela-Kerscher A, Slack FJ. Oncomirs - microRNAs with a role in cancer. Nat Rev Cancer. 2006;6:259–69. doi: 10.1038/nrc1840. [DOI] [PubMed] [Google Scholar]
- 17.Michael MZ, SM OC, van Holst Pellekaan NG, Young GP, James RJ. Reduced accumulation of specific microRNAs in colorectal neoplasia. Mol Cancer Res. 2003;1:882–91. [PubMed] [Google Scholar]
- 18.Carlson JM, Chakravarty A, DeZiel CE, Gross RH. SCOPE: a web server for practical de novo motif discovery. Nucleic Acids Res. 2007;35:W259–64. doi: 10.1093/nar/gkm310. [DOI] [PMC free article] [PubMed] [Google Scholar]
- 19.Basso K, Margolin AA, Stolovitzky G, Klein U, Dalla-Favera R, Califano A. Reverse engineering of regulatory networks in human B cells. Nat Genet. 2005;37:382–90. doi: 10.1038/ng1532. [DOI] [PubMed] [Google Scholar]
- 20.Mayr C, Bartel DP. Widespread shortening of 3′UTRs by alternative cleavage and polyadenylation activates oncogenes in cancer cells. Cell. 2009;138:673–84. doi: 10.1016/j.cell.2009.06.016. [DOI] [PMC free article] [PubMed] [Google Scholar]
- 21.Difilippantonio MJ, Petersen S, Chen HT, et al. Evidence for replicative repair of DNA double-strand breaks leading to oncogenic translocation and gene amplification. J Exp Med. 2002;196:469–80. doi: 10.1084/jem.20020851. [DOI] [PMC free article] [PubMed] [Google Scholar]
- 22.Frank KM, Sharpless NE, Gao Y, et al. DNA ligase IV deficiency in mice leads to defective neurogenesis and embryonic lethality via the p53 pathway. Mol Cell. 2000;5:993–1002. doi: 10.1016/s1097-2765(00)80264-6. [DOI] [PubMed] [Google Scholar]
- 23.Gao Y, Ferguson DO, Xie W, et al. Interplay of p53 and DNA-repair protein XRCC4 in tumorigenesis, genomic stability and development. Nature. 2000;404:897–900. doi: 10.1038/35009138. [DOI] [PubMed] [Google Scholar]
- 24.Rooney S, Sekiguchi J, Whitlow S, et al. Artemis and p53 cooperate to suppress oncogenic N-myc amplification in progenitor B cells. Proc Natl Acad Sci U S A. 2004;101:2410–5. doi: 10.1073/pnas.0308757101. [DOI] [PMC free article] [PubMed] [Google Scholar]
- 25.Zhu C, Mills KD, Ferguson DO, et al. Unrepaired DNA breaks in p53-deficient cells lead to oncogenic gene amplification subsequent to translocations. Cell. 2002;109:811–21. doi: 10.1016/s0092-8674(02)00770-5. [DOI] [PubMed] [Google Scholar]
- 26.Woo Y, Wright SM, Maas SA, et al. The nonhomologous end joining factor Artemis suppresses multi-tissue tumor formation and prevents loss of heterozygosity. Oncogene. 2007;26:6010–20. doi: 10.1038/sj.onc.1210430. [DOI] [PubMed] [Google Scholar]
- 27.Rooney S, Sekiguchi J, Zhu C, et al. Leaky Scid phenotype associated with defective V(D)J coding end processing in Artemis-deficient mice. Mol Cell. 2002;10:1379–90. doi: 10.1016/s1097-2765(02)00755-4. [DOI] [PubMed] [Google Scholar]
- 28.Donehower LA, Harvey M, Slagle BL, et al. Mice deficient for p53 are developmentally normal but susceptible to spontaneous tumours. Nature. 1992;356:215–21. doi: 10.1038/356215a0. [DOI] [PubMed] [Google Scholar]
- 29.Salisbury J, Hutchison KW, Wigglesworth K, Eppig JJ, Graber JH. Probe-level analysis of expression microarrays characterizes isoform-specific degradation during mouse oocyte maturation. PLoS One. 2009 doi: 10.1371/journal.pone.0007479. in press. [DOI] [PMC free article] [PubMed] [Google Scholar]
- 30.Pepper SD, Saunders EK, Edwards LE, Wilson CL, Miller CJ. The utility of MAS5 expression summary and detection call algorithms. BMC Bioinformatics. 2007;8:273. doi: 10.1186/1471-2105-8-273. [DOI] [PMC free article] [PubMed] [Google Scholar]
- 31.Suzuki R, Shimodaira H. Pvclust: an R package for assessing the uncertainty in hierarchical clustering. Bioinformatics. 2006;22:1540–2. doi: 10.1093/bioinformatics/btl117. [DOI] [PubMed] [Google Scholar]
- 32.Churchill GA. Using ANOVA to analyze microarray data. Biotechniques. 2004;37:173–5. 7. doi: 10.2144/04372TE01. [DOI] [PubMed] [Google Scholar]
- 33.Lyakhovich A, Shekhar MP. Supramolecular complex formation between Rad6 and proteins of the p53 pathway during DNA damage-induced response. Mol Cell Biol. 2003;23:2463–75. doi: 10.1128/MCB.23.7.2463-2475.2003. [DOI] [PMC free article] [PubMed] [Google Scholar]
- 34.Ashburner M, Ball CA, Blake JA, et al. Gene ontology: tool for the unification of biology. The Gene Ontology Consortium. Nat Genet. 2000;25:25–9. doi: 10.1038/75556. [DOI] [PMC free article] [PubMed] [Google Scholar]
- 35.Beissbarth T, Speed TP. GOstat: find statistically overrepresented Gene Ontologies within a group of genes. Bioinformatics. 2004;20:1464–5. doi: 10.1093/bioinformatics/bth088. [DOI] [PubMed] [Google Scholar]
- 36.Zhang T, Kruys V, Huez G, Gueydan C. AU-rich element-mediated translational control: complexity and multiple activities of trans-activating factors. Biochem Soc Trans. 2002;30:952–8. doi: 10.1042/bst0300952. [DOI] [PubMed] [Google Scholar]
- 37.Murthy KG, Manley JL. The 160-kD subunit of human cleavage-polyadenylation specificity factor coordinates pre-mRNA 3′-end formation. Genes Dev. 1995;9:2672–83. doi: 10.1101/gad.9.21.2672. [DOI] [PubMed] [Google Scholar]
- 38.Hatton LS, Eloranta JJ, Figueiredo LM, Takagaki Y, Manley JL, O'Hare K. The Drosophila homologue of the 64 kDa subunit of cleavage stimulation factor interacts with the 77 kDa subunit encoded by the suppressor of forked gene. Nucleic Acids Res. 2000;28:520–6. doi: 10.1093/nar/28.2.520. [DOI] [PMC free article] [PubMed] [Google Scholar]
- 39.Pan Z, Zhang H, Hague LK, Lee JY, Lutz CS, Tian B. An intronic polyadenylation site in human and mouse CstF-77 genes suggests an evolutionarily conserved regulatory mechanism. Gene. 2006;366:325–34. doi: 10.1016/j.gene.2005.09.024. [DOI] [PubMed] [Google Scholar]
- 40.Edwalds-Gilbert G, Milcarek C. Regulation of poly(A) site use during mouse B-cell development involves a change in the binding of a general polyadenylation factor in a B-cell stage-specific manner. Mol Cell Biol. 1995;15:6420–9. doi: 10.1128/mcb.15.11.6420. [DOI] [PMC free article] [PubMed] [Google Scholar]
- 41.Lawrie CH, Saunders NJ, Soneji S, et al. MicroRNA expression in lymphocyte development and malignancy. Leukemia. 2008;22:1440–6. doi: 10.1038/sj.leu.2405083. [DOI] [PubMed] [Google Scholar]
- 42.Barrett T, Edgar R. Gene expression omnibus: microarray data storage, submission, retrieval, and analysis. Methods Enzymol. 2006;411:352–69. doi: 10.1016/S0076-6879(06)11019-8. [DOI] [PMC free article] [PubMed] [Google Scholar]
- 43.Riker AI, Enkemann SA, Fodstad O, et al. The gene expression profiles of primary and metastatic melanoma yields a transition point of tumor progression and metastasis. BMC Med Genomics. 2008;1:13. doi: 10.1186/1755-8794-1-13. [DOI] [PMC free article] [PubMed] [Google Scholar]
- 44.Li M, Balch C, Montgomery JS, et al. Integrated analysis of DNA methylation and gene expression reveals specific signaling pathways associated with platinum resistance in ovarian cancer. BMC Med Genomics. 2009;2:34. doi: 10.1186/1755-8794-2-34. [DOI] [PMC free article] [PubMed] [Google Scholar]
- 45.Carninci P, Sandelin A, Lenhard B, et al. Genome-wide analysis of mammalian promoter architecture and evolution. Nat Genet. 2006;38:626–35. doi: 10.1038/ng1789. [DOI] [PubMed] [Google Scholar]
- 46.Martincic K, Campbell R, Edwalds-Gilbert G, Souan L, Lotze MT, Milcarek C. Increase in the 64-kDa subunit of the polyadenylation/cleavage stimulatory factor during the G0 to S phase transition. Proc Natl Acad Sci U S A. 1998;95:11095–100. doi: 10.1073/pnas.95.19.11095. [DOI] [PMC free article] [PubMed] [Google Scholar]
- 47.Kleiman FE, Manley JL. Functional interaction of BRCA1-associated BARD1 with polyadenylation factor CstF-50. Science. 1999;285:1576–9. doi: 10.1126/science.285.5433.1576. [DOI] [PubMed] [Google Scholar]
- 48.Kleiman FE, Manley JL. The BARD1-CstF-50 interaction links mRNA 3′ end formation to DNA damage and tumor suppression. Cell. 2001;104:743–53. doi: 10.1016/s0092-8674(01)00270-7. [DOI] [PubMed] [Google Scholar]
- 49.Kleiman FE, Wu-Baer F, Fonseca D, Kaneko S, Baer R, Manley JL. BRCA1/BARD1 inhibition of mRNA 3′ processing involves targeted degradation of RNA polymerase II. Genes Dev. 2005;19:1227–37. doi: 10.1101/gad.1309505. [DOI] [PMC free article] [PubMed] [Google Scholar]
- 50.Mirkin N, Fonseca D, Mohammed S, Cevher MA, Manley JL, Kleiman FE. The 3′ processing factor CstF functions in the DNA repair response. Nucleic Acids Res. 2008;36:1792–804. doi: 10.1093/nar/gkn005. [DOI] [PMC free article] [PubMed] [Google Scholar]
Associated Data
This section collects any data citations, data availability statements, or supplementary materials included in this article.