

Abstract
The expression levels of caspase-3, a major contributor to the execution of neuronal apoptosis, markedly decrease in the process of brain maturation. We have previously cloned the rat caspase-3 gene promoter and identified its essential regulatory elements. In the present study, we extended previous findings by examining transcriptional regulation of caspase-3 expression in the rat brain of two different ages, corresponding to the immature and mature brain. In particular, we determined that the rate of transcription initiation substantially declines during brain maturation. Furthermore, we established that mRNA levels of Ets1, Ets2 and Sp1 do not change in the brain with maturation, suggesting that these transcription factors do not contribute to age-dependent caspase-3 down-regulation. Hence, we examined a role of DNA methylation and histone modification in this process. Utilizing bisulfite DNA sequencing, we determined the presence of age-dependent differentially-methylated fragments within the caspase-3 promoter region. Strikingly, differentially methylated CpG sites correspond to the predicted binding sites for a number of transcription factors that have been previously shown to be involved in neuronal development and differentiation. Moreover, using chromatin immunoprecipitation, we found that mature brains displayed significantly lower levels of histone 3 acetylated Lys14 and histone 4 acetylated Lys5, 8, 12, and 16. This observation is consistent with the decreased level of expression of caspase-3 in the mature brain. Together with our observation that histone deacetylase inhibitor, trichostatin A, increased the level of caspase-3 mRNA in cortical neurons in vitro, these results further indicate an important role of epigenetic factors in the regulation of caspase-3 gene expression.
Keywords: DNA methylation, histone acetylation, caspase-3, promoter, rat brain
1. Introduction
Apoptosis is a genetically controlled cell death responsible for loss of nearly half of neural cells during early brain development (Haydar et al 1999). A critical role in initiation and progression of apoptosis has been attributed to members of the caspase family (Alnemri et al 1996). Among them, caspase-3 is considered a major effector in programmed neuronal loss triggered by various stimuli. Striking evidence supporting the specific role of this protease came from studies on caspase-3 knockout mice, in which brain development is profoundly altered (Kuida et al 1996). The targeted mutation of the caspase-3 gene prevents cell death in many brain regions where neuronal death is typically observed during development, including the dorsomedial wall of the diencephalon, the optic stalk, and the lamina terminalis (Kuida et al 1996). Moreover, postnatal neocortical development in caspase-3 knockout mice demonstrates a profound effect of this protease on the adult brain size and shape (Haydar et al 1999).
While being a common feature of developing CNS, apoptosis is atypical for the mature mammalian brain under normal physiological conditions (Haydar et al 1999), and several recent reports strongly indicate that suppression of apoptotic capability in the mammalian brain during the postnatal period coincides with marked down-regulation of caspase-3 expression (De Bilbao et al 1999; Yakovlev et al 2001).
In order to identify specific regulatory mechanisms that control differential caspase-3 expression during brain development, we cloned the promoter region of the rat gene and identified its essential regulatory elements (Liu et al 2002). We have also identified a corresponding promoter of the human caspase-3 gene and reported that its structure was strikingly similar to rat. Both human and rat promoters lack a TATA-box and have a common dense CpG island surrounding major transcription start sites (Liu et al 2002) that represent a characteristic feature of many housekeeping genes. More recently, our findings were confirmed and extended by cloning and functional analyses of human and mouse caspase-3 gene promoters (Sabbagh et al 2006; Sudhakar et al 2008). In the present study, we examined molecular mechanisms that can be responsible for the developmental down-regulation of caspase-3 expression in the rat brain.
Using the rat promoter, we have previously demonstrated that caspase-3 transcriptional activity is controlled by Ets- and Sp1-like transcription factors (Liu et al 2002). One of the aims of the present study was to determine whether these factors contribute to developmental regulation of caspase-3 transcription in the brain tissue.
Furthermore, it has been shown that inhibition of transcription initiation from genes with similar CpG-rich promoter structures during development and differentiation of mature cells is often associated with epigenetic factors like DNA methylation, histone methylation, acetylation, and phosphorylation, structural modifications of chromatin, and microRNAs, among others (Esteller 2006; Grolleau-Julius et al 2009; Tawa et al 1990). Therefore, in this study we tested the hypothesis that DNA methylation and chromatin modification within the caspase-3 gene promoter results in developmental down-regulation of its expression in brain tissue. Our results confirmed and extended recent reports from other investigators, demonstrating a role for chromatin modification in caspase-3 transcription in tumor cells and in the developing mouse retina (Medina et al 1997; Wallace et al 2006).
2. Material and Methods
2.1. Rat Cortical Neuronal cultures
Rat Cortical Neuronal cultures were derived from rat embryonic cortices as described previously (Yakovlev et al 2001). Briefly, cortices from 15- to 16-day-old embryos were cleaned from their meninges and blood vessels in Krebs-Ringers bicarbonate buffer containing 0.3% bovine serum albumin (BSA). Cortices were then minced and dissociated in the same buffer with 1,800 U/mL trypsin at 37°C for 20 min. Following the addition of 200 U/mL DNase I and 3,600 U/mL soybean trypsin inhibitor to the suspension, cells were triturated through a 5-mL pipette. After allowing the tissue to settle for 5 to 10 min, the supernatant was collected, and the remaining tissue pellet was retriturated. The combined supernatants were then centrifuged through a 4% BSA layer and the cell pellet was resuspended in neuronal seeding medium (NSM), consisting of Neurobasal Medium (Life Technologies) supplemented with 1.1% 100X antibiotic-antimycotic solution, 25 μM Na-glutamate, 0.5 mM l-glutamine, and 2% B27 Supplement (Life Technologies). Cells were plated at a density of 5 × 10⁵ cells/mL onto poly-D-lysine-coated (70-150 kDa) 10-cm Petri dishes (Falcon). For the experiments with the HDAC inhibitor trichostatin A (TSA), cells were allowed to mature for 2 weeks and then treated with TSA (Sigma, 100 ng/ml) for 24 hr before being harvested for total RNA isolation.
2.2. Reverse transcription-PCR
The levels of mRNA for Ets- and Sp1-like transcription factors as well as caspase-3 were analyzed using a reverse transcription (RT)-PCR approach as previously described (Yakovlev et al 1997; Yakovlev et al 2001). In brief, total RNA was isolated by acidic phenol extraction (Chomczynski and Sacchi 1987), and 10 μg of it was reverse transcribed with Moloney murine leukemia virus reverse transcriptase (Invitrogen) in 30 μl reaction mixture. The resulting cDNA (3 μl) was amplified by PCR. The primers for PCR amplification of Sp1, Ets-1, Ets-2, and caspase-3 were based on the available rat mRNA sequences (GenBank accession number IDs: NM_012655, NM_012555, XM_239510, and NM_012922, respectively). The number of cycles and reaction temperature were estimated to be optimal to provide a linear relationship between the amount of input template and the amount of PCR product generated over a wide concentration range: from 1 to 20 μg of total RNA. The amplified cDNA was analyzed by agarose gel electrophoresis. After staining with ethidium bromide, gel images were captured under the UV light and analyzed on a PC using the public domain NIH Image program (developed at the U.S. National Institutes of Health and available on the Internet at http://rsb.info.nih.gov/nih-image/). The levels of individual mRNA were expressed in arbitrary units as the proportion of individual PCR product mean optical density (inverted image) to a control product mean optical density obtained from the same RNA sample. The cDNA for glyceraldehyde-3-phosphate dehydrogenase (GAPDH) was used as internal control, because its levels remain constant with brain maturation. The identity of a PCR-generated product to a corresponding cDNA was confirmed by the sequencing of the PCR products.
2.3. Nuclear Run-On Assay
The assessment of caspase-3 transcriptional rates was performed essentially as described previously (Patrone et al 2000). In brief, nuclei from postnatal day 7 (P7) or P60 male Sprague Dawley rat brain were isolated in the cell lysis buffer (10mM Tris-HCl, pH 7.4, 3 mM MgCl2, 10 mM NaCl, 150 mM sucrose, and 0.5% NP-40) and resuspended in the freezing buffer consisting of 50 mM Tris-HCl, pH 8.3, 40% glycerol, 5 mM MCl2, and 0.1 mM EDTA). Isolated nuclei were incubated in the transcription buffer (100 mM KCl, 10 mM Tris-HCl, pH 8.0, 2.5 mM MgCl2, 2 mM DTT, 100 uM each of ATP, GTP and CTP, 100 mM sucrose, and 10% glycerol) in the presence of biotin-16-UTP (Roche Molecular BIochemicals) for 30 min at 29°C followed by capturing of the labeled RNA on Dynabeads M-280 (Dynal) according to the manufacturer's recommendations. Purified RNA was treated with RNase-free DNaseI and subjected to semi-quantitative RT-PCR using specific pairs of primers to amplify caspase-3 or β-actin. Amplified DNA products were analyzed and quantified by electrophoresis in 2% agarose gels as described above.
2.4. Bisulfite genomic DNA sequencing
Genomic DNA was isolated individually from each of the whole male Sprague Dawley rat brains, collected at P2 (n=10) and P60 (n=10), as described elsewhere (Sambrook et al 1989). Genomic DNA samples from each age group were then combined. DNA samples (20 μg) were digested to completion with a mixture of NdeI and NcoI restriction enzymes (New England Biolabs) according to the manufacturer's recommendations followed by denaturing with 0.3M NaOH for 20 min at 42°C. Bisulfite modification of DNA was performed essentially as described previously (Warnecke et al 2002). After desulfonation DNA was neutralized with ammonium acetate, precipitated with ethanol, and dried. DNA was resolved in 80 μl sterile 1 mM Tris–HCl pH 8 and stored at −20°C. The individual bisulfite treated DNA samples were PCR amplified in 50 μl reaction volume, using the JumpStart Taq ReadyMix reagent (Sigma-Aldrich). Using the BiSearch software (Tusnady et al 2005), we designed 8 pairs of PCR primers to amplify corresponding overlapping DNA fragments spanning the region from -1470 nt to +647 nt of the rat caspase-3 gene (Liu et al 2002) (Table 1). The number of amplification cycles varied from 35 to 38 depending on the amplified DNA region.
Table 1.
The primers used for PCR amplification of the appropriate fragments contained the putative altered sequence of the sense or antisense strand due to bisulfite treatment (converted cytosine residues are in bold).
| Amplified Region | Forward PCR Primers | Reverse PCR Primers |
|---|---|---|
| -1470/-1185 | 5′-TTTTCCTCCTCACTAATTCCCCACC-3′ | 5′-AGGTTGGGTAGTTGGAGTAAGAGG-3′ |
| -1435/-1215 | 5′-CAACTTTACCAAACCAATCAACATTCACACC-3′ | 5′-TGAAGTAGTTTAGGAATAGGGAGTGGG-3′ |
| -1134/-740 | 5′-GGATAAGAGGAAAGTTTTTTTGAAGAGTTATAG-3′ | 5′-TCAATCCTAAATATCCCTCAACTTCACC-3′ |
| -853/-516 | 5′-GTAAAGTAGTTAGTATATTTTATGGGGTTTAGGA-3′ | 5′-CACTCACTCCTAATCAATCAAAAACAACC-3′ |
| -548/-226 | 5′-GAGGTAAATTTAGAGAGGTTTTTAGGTTAGG-3′ | 5′-CATTTCATCAATCATATAAAATACCCCAAATCCT-3′ |
| -258/+187 | 5′-TTTTAGGAGTTGTAGATTGGGTGATAGAG-3′ | 5′-CTCCATTTAAATCTCTCCAAAAATCCAATCC-3′ |
| +59/+241 | 5′-GATTAAAGTTTAGTGTTTTTGAGGTG-3′ | 5′-CTAAAAACAACACAAAAAATCCTCC-3′ |
| +258/+647 | 5′-TTGAAGGTAGAGAAGTTGGAAATAG-3′ | 5′-CAAAAAAACTAAATCCCTTAAAACC-3′ |
Amplified DNA fragments were analyzed by electrophoresis in 2% agarose gel, cloned into pGEM-T Easy Vector (Promega) using standard procedures, and clones from each sample were sequenced using BigDye terminator reaction premix (Applied Biosystems, Foster City, CA) and ABI PRISM 377 DNA Sequencer by the Georgetown University sequencing Core Facility.
2.5. Chromatin immunoprecipitation (ChIP) assay
P2 and P60 rat brain tissue obtained from male Sprague Dawley rats was gently homogenized using a glass-teflon homogenizer in 10 volumes of the nuclei isolation buffer (NIB, 5 mM PIPES-NaOH, pH 7.4; 80 mM KCl; 15 mM NaCl; 5 mM EDTA; 1mM DTT; 0,5 mM spermidine; 0.2 mM spermine; 1 mM PMSF; 250 mM sucrose) and 0.5% Triton X-100. The homogenates were incubated on ice for 30 min followed by centrifugation at 800-1,000 g for 5 min. Pellets were suspended in NIB with 1% formaldehyde and incubated at room temperature for 15 min. Crosslinking reaction was stopped by adding 1M glycine to a final concentration of 125 mM. Cell nuclei were centrifuged as described above, washed in ice-cold phosphate-buffered saline (PBS) containing 1 μg/ml pepstatin A and 1× protease inhibitor cocktail (Roche Molecular Biochemicals) and resuspended in SDS lysis buffer (1% SDS, 10 mM EDTA, 50mM Tris–HCl pH 8.1, 1× protease inhibitor cocktail and 1 μg/ml pepstatin A) on ice.
The following steps were performed as instructed by the protocol provided with the ChIP assay kit (N17-295, Upstate). Crosslinked chromatin was sonicated on ice using a 60 Sonic-Dismembrator (Fisher Scientific) at 50% of maximal power with 20 strokes (5 sec each). DNA fragmentation to the target length of approximately 0.3-0.9 Kb was controlled by electrophoresis in 2% agarose gel. Immunoprecipitation with specific antibodies was performed overnight at +4°C in a total volume 1.5 ml with 30 μg of chromatin and 10μl of antibodies directed against each acetylated H4 (06-866; Upstate Biotechnology), H3 acetylated at Lys9 and Lys14 (06-599; Upstate), H3 acetylated only at Lys14 (07-353; Upstate), H3 dimethylated at Lys 4 (07-030; Upstate) and Lys 9 (3712, Abcam), H3 trimethylated at Lys4 (07-473; Upstate). Resulting immune complexes were collected by addition of 60 μl of salmon sperm DNA–protein A agarose slurry and incubated at 4°C with agitation for 2 h. The beads were washed several times, and the attached immune complexes were eluted with a buffer containing 1% SDS and 0.1 M NaHCO3. Cross-links were reversed by addition of 5 M NaCl and incubation at 65°C for 4 h. The samples were then treated with proteinase K for 1 h, and DNA was purified by phenol/chloroform extraction and ethanol precipitation. Immunoprecipitation was quantified by DNA amplification using ABI PRISM 7700 Sequence Detection System as described in User Bulletin #2 (PE Applied Biosystems). PCR was performed using the following amplification primers: 5′-GGTGGGATCAAAGCTTAGTG-3′ and 5′-TCTTCCTAGGACTGCAGACT-3′ spanning a region of the rat caspase-3 gene from +54 nt to +192 nt (GenBank accession number ID: AF427079).
2.6. Statistical analysis
Comparisons were made using the two-tailed Student's t-test or ANOVA with post hoc Fisher's test, as appropriate. p values < 0.05 were considered significant.
3. Results and Discussion
3.1. A role of transcription in age-dependent caspase-3 mRNA expression
Alternative mechanisms can contribute to differential levels of mRNA content in certain tissues, including transcription initiation rates and RNA degradation. In this study, transcription initiation was analyzed by the nuclear run-on assay using biotin labeling of newly synthesized RNA, magnetic bead capturing of this RNA, and its analysis by RT-PCR as described in Methods. This semi-quantitative technique revealed that newly synthesized caspase-3 RNA content was markedly decreased in adult (P60) brain tissue as compared to 2-day-old rat brains (Fig. 1).
Figure 1.
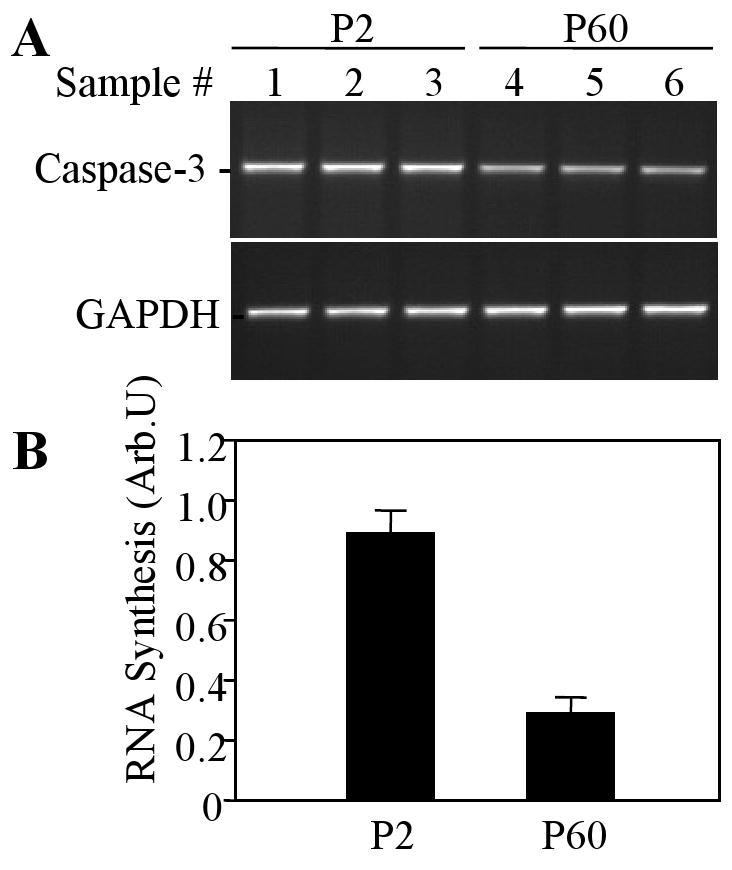
Transcription rate of caspase-3 in the rat brain at P2 and P20. Transcription initiation was measured using the nuclear run-on assay as described in Methods.
A. Agarose gel electrophoresis of the PCR products for caspase-3 and GAPDH from individual samples (n=3 for each age group). B. Quantification of caspase-3 RNA synthesis at P2 and P60. Arbitrary units (Arb.U.) represent mean ratios of caspase-3-to-GAPDH electrophoretic band optical densities ± SEM (n=3).
3.2. Expression of Sp1, Ets-1, and Ets-2 mRNA during brain development
Previously published (Liu et al 2002) analysis of the rat caspase-3 promoter revealed several essential Ets-like and Sp1-like binding sites conserved in the rat and human orthologs. Multiple Sp1 binding regions within a core promoter play an important role in maintaining steady state expression level of this gene, whereas the identified Ets site appears to be essential for caspase-3 transcription at the level of its enhancer region (Liu et al 2002). Furthermore, it has been shown that the Ets family of transcription factors controls expression of genes critical for cellular proliferation, differentiation, and transformation (Sementchenko and Watson 2000), and the expression of Ets genes is associated with embryonic development of the central nervous system (Maroulakou and Bowe 2000). Thus, in this study, we assessed the role for Sp1, Ets-1, and Ets-2 transcription factors in the regulation of caspase-3 mRNA using the semi-quantitative RT-PCR assay, as described in Methods. Results of RT-PCR experiments indicate that mRNA levels of these transcription factors did not change significantly in the whole brain tissue during development, from E17 through P60 stages (Fig. 2).
Figure 2.

Assessment of mRNA levels of Ets-1, Ets-2, and Sp1 at different stages of rat brain development: embryonic (E) day 17, postnatal (P) day 2, P7, P14, and P60. mRNA levels were measured by semi-quantitative RT-PCR and quantified as described in Methods. Arbitrary units represent mean ratios of gene-to-GAPDH electrophoretic band optical densities ± SEM (n=3).
These results suggest that mechanisms other than direct regulation of the promoter activity by Sp1 or Ets-like transcription factors are responsible for the developmental down-regulation of the caspase-3 gene expression. However, additional experiments at the levels of transcription, translation, and posttranslational protein modification are required to demonstrate conclusively that the remaining numerous members of Ets- and Sp1-like families do not underlie this phenomenon.
3.3. Analysis of caspase-3 promoter DNA methylation
Promoter regions of the rat, mouse, and human caspase-3 genes include a common dense CpG island surrounding corresponding transcription start sites (Fig. 3). We have demonstrated in this study that developmental downregulation of caspase-3 is associated with the marked decrease in the initiation of its transcription (Fig. 1).
Figure 3.
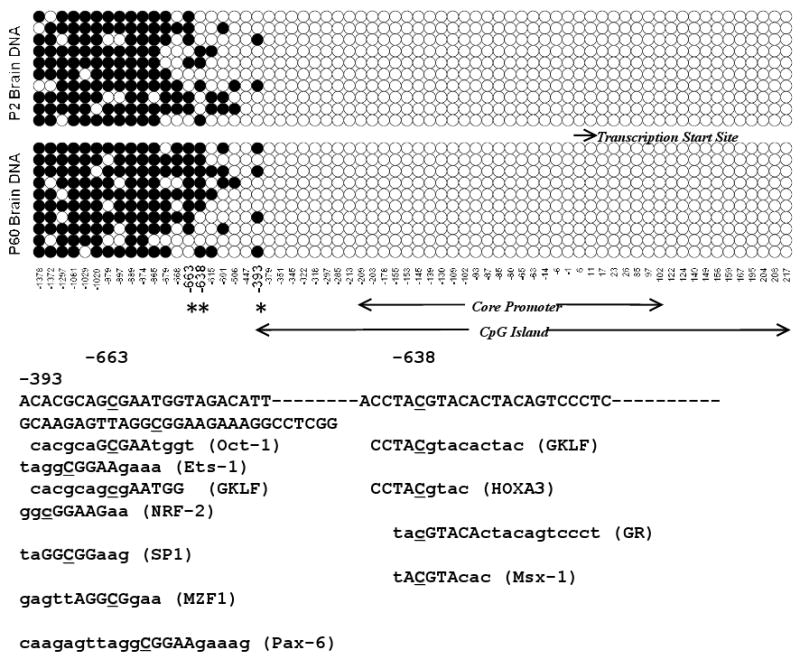
A. Comparison of the frequency and distribution of methylated CpGs in the caspase-3 promoter from newborn (P2) and adult (P60) rat brain. Open circles indicate unmethylated CpG dinucleotides. Closed circles indicate methylated CpG. Asterisks indicate positions of the age-dependent differentially-methylated nucleotides within the caspase-3 promoter. B. Predicted transcription factor binding sites within the caspase-3 promoter are indicated in parentheses.
Inhibition of transcription initiation of genes with a similar promoter structure has been shown to be associated with epigenetic regulation by hypermethylation of the CpG islands (Baylin et al 2001; Momparler and Bovenzi 2000). Moreover, a role for DNA methylation in the developmental regulation of several genes has also been suggested by recent reports (Dunlevy et al 2006; Shames et al 2007). In order to test whether this epigenetic mechanism participates in the developmental regulation of the caspase-3 gene in the brain we evaluated changes in the rat promoter DNA methylation as a function of age.
DNA methylation in P2 and P60 brains was assessed directly using a method of bisulfite sequencing, as described in Methods. Analysis of 10 individual clones demonstrated that the CpG island surrounding the core promoter and the transcription start site lacks methylated C residues in both P2 and P60 DNA sets. In contrast, the majority of C nucleotides in an upstream DNA region between positions -1378 nt and -865 nt were methylated. However, no substantial differences were found between P2 and P60 brains. The profound difference in the DNA methylation status was observed in the region between -663 and -393 nt with almost 2-fold increase in the extent of methylation in the P60 DNA, as compared to P2 DNA (Fig. 3).
Remarkably, the deletion of the region between -1026 and -626 nt leads to complete loss of the promoter activity, as we demonstrated in our previous study (Liu et al 2002), suggesting the presence in this region of one or more essential transcription factor binding sites. Using MATCH matrix search for transcription binding sites software, we found that the DNA fragments surrounding CpG dinucleotides that demonstrate the most striking difference in age-dependent methylation may include Oct-1, GKLF (at the -663 nt position), GKLF, HOXA3, GR, Msx-1 (at the -638 nt position), and Ets-1, NRF-2, Sp1, MZF1, and Pax-6 (at the -393 nt position) binding sites (Fig. 3). Notably, most of these transcription factors have been shown to play an essential role in neural development, cell death, differentiation, and tumorigenesis (Callaerts et al 1997; Chisaka and Capecchi 1991; Creuzet et al 2005; Evans and Liu 2008; Ghaleb et al 2005; Pryce 2008; Sargent 2006; Schonemann et al 1998; Ton-That et al 1997; Tsiftsoglou et al 2009; Tumpel et al 2002). Furthermore, it is also remarkable that Oct-1, GKLF, and GR physically interact and cooperate with Ets and Sp1 transcription factors that are essential for caspase-3 gene expression (Bruggemeier et al 1991; Janson and Pettersson 1990; Liu et al 2002; Mullick et al 2001; Zhang et al 1998).
Taken together, these results suggest that differential methylation of cytosine residues at positions -663, -638, and -393 in the rat caspase-3 promoter may underlie down-regulation of this gene during brain development.
3.4. Chromatin modifications of the caspase-3 gene promoter
Previous reports established that gene silencing mediated by DNA methylation involves generation of the modified chromatin structures (Razin 1998). Normally, methyl-binding proteins bind to methylated CpG units and bring together histone deacetylases (HDACs) and the co-repressor protein mSin3A leading to deacetylation of histones which results in the formation of repressive chromatin states (Wolffe 1998). It has been demonstrated that HDACs are important regulators of neuronal apoptosis (Boutillier et al 2002), and that histone acetylation controls apoptotic potential via regulation of transcription activity of the caspase-3 gene (Wallace et al 2006). Furthermore, di- and tri-methylation of the histone H3 lysine 4 (H3meK4) is known to be associated with gene expression, whereas methylation of the histone H3 lysine 9 (H3meK9) is associated with transcriptionally silent heterochromatin (Rice and Allis 2001).
In this study, we examined histone acetylation and histone methylation status within the rat caspase-3 gene promoter using the chromatin immunoprecipitation assay (ChIP) of the rat brain at P2 and P60 developmental stages. The results, shown in Fig. 4, demonstrate that the levels of lysine methylation in histone 3 and histone 4 do not change significantly with brain maturation. In contrast, the acetylation status of both histones substantially declines during development demonstrating a remarkable 2-fold decrease for histone 4 in the P60 chromatin, as compared to the P2 chromatin. The resolution of the performed ChIP assay does not allow localization of the precise positions of differentially acetylated lysine residues within the promoter, and it remains to be clarified whether the sites of differential acetylation match the sites of differentially methylated CpG dinucleotides identified in this study (see Fig. 3).
Figure 4.

Acetylation and methylation status of histones 3 and 4 within the caspase-3 promoter at P2 and P60. ChIP was performed as described in Methods using antibodies against histone 3 trimethylated at lysine 4 (H3me3K4), dimethylated at Lys 4 (H3me2K4), dimethylated at Lys 9 (H3me2K9), acetylated at Lys9 and Lys14 (H3ac), acetylated at Lys14 (H3acK14) and against histone H4 acetylated at Lys5, Lys8, Lys12 and Lys16 (H4ac). Real-time PCR of the caspase-3 promoter region was performed as described in Methods. The ratio of PCR product obtained from immunoprecipitated DNA (ChIP DNA) to the amount of PCR product obtained from total chromatin before immunoprecipitation (input DNA) was calculated. Data are presented as percentage of the P2 levels. Each value represents the average of three chromatin preparations ± SEM. Asterisks indicate significant difference from P2 (p<0.05).
To further confirm a role of histone acetylation in the regulation of caspase-3 gene expression, we used primary cultures of rat cortical neurons treated with the HDAC inhibitor trichostatin A (TSA). The use of TSA for examining the effects of histone acetylation on neuronal gene expression has been previously reported (Hohl and Thiel 2005; Huang et al 2002). Primary neuronal cultures were pretreated with TSA (100 ng/ml) for 24 h, and caspase-3 mRNA levels were measured using RT-PCR approach, as described in Methods. We observed a marked increase in caspase-3 mRNA expression following HDAC inhibition. In particular, treatment with TSA resulted in a significant increase (78 ± 5.3%; p<0.05; n=3) in caspase-3 mRNA expression over control (untreated) cultures. This observation is consistent with the previous reports on the role for histone acetylation in the regulation of caspase-3 gene expression in retina and cerebellar granular cells (Boutillier et al 2002; Wallace et al 2006). Our results support the hypothesis about essential role of histone acetylation in the expression of caspase-3 gene in cortical neurons.
In conclusion, the results obtained in this study demonstrate that developmental down-regulation of caspase-3 expression in rat brain is associated with transcriptional silencing in which age-dependent differential DNA methylation and histone acetylation appear to play essential role. Expanding on our previous findings (Liu et al 2002), further analysis of the caspase-3 promoter region revealed that the region critical for caspase-3 expression overlaps with the region expressing age-dependent differential DNA methylation. Moreover, this region contains binding sites for a number of transcription factors that have been previously shown to be critical for neuronal development and differentiation. These transcription factors are also known to interact with the members of the Ets and Sp1 family of proteins. While we demonstrate here that Ets-1, Ets-2, and Sp1 transcription factor mRNA levels were not affected by brain maturation, this, nevertheless, does not rule out involvement of these, and perhaps other, transcription factors in developmental regulation of the caspase-3 gene. In particular, this issue should be further investigated at the levels of protein expression and posttranslational modifications. Additional studies are also required to demonstrate that the remaining members of Ets- and Sp1-like families do not underlie developmental down-regulation of caspase-3 expression. Nevertheless, when taken as a whole, our results support the hypothesis that epigenetic regulation plays an essential role in the expression of caspase-3 gene during rat brain development.
Acknowledgments
This study was supported by the grants NS048974 and NS056057 from the National Institute of Neurological Disorders and Stroke. The work was also supported in part by the Intramural Research Program of the National Institute of Allergy and Infectious Disease. The authors thank Mr. Guillermo Palchik for help in preparation of the manuscript.
With the deepest regret and sorrow, the authors would like to acknowledge the passing of Dr. Maryam Khafizova, one of the major contributors to this study.
List of Abbreviations
- CNS
Central Nervous System
- BSA
bovine serum albumin
- NSM
neuronal seeding medium
- TSA
trichostatin A
- PCR
polymerase chain reaction
- RT
reverse transcription
- GAPDH
glyceraldehyde-3-phosphate dehydrogenase
- P
postnatal day
- E
embryonic day
- EDTA
ethylenediaminetetraacetic acid
- DTT
Dithiothreitol
- PIPES
Piperazine-1,4-bis(2-ethanesulfonic acid)
- PMSF
Phenylmethanesulfonyl fluoride
- NIB
nuclei isolation buffer
- PBS
phosphate-buffered saline
- SDS
sodium dodecyl sulfate
- ChIP
Chromatin immunoprecipitation
- nt
nucleotide(s)
- ANOVA
analysis of variance
- HDAC
histone deacetylase
Footnotes
Disclosure Statement: None of the authors have any actual or potential conflict of interest to disclose.
Publisher's Disclaimer: This is a PDF file of an unedited manuscript that has been accepted for publication. As a service to our customers we are providing this early version of the manuscript. The manuscript will undergo copyediting, typesetting, and review of the resulting proof before it is published in its final citable form. Please note that during the production process errors may be discovered which could affect the content, and all legal disclaimers that apply to the journal pertain.
Manuscript: GENE 36651
References
- Alnemri ES, Livingston DJ, Nicholson DW, Salvesen G, Thornberry NA, Wong WW, Yuan J. Human ICE/CED-3 protease nomenclature. Cell. 1996;87:171. doi: 10.1016/s0092-8674(00)81334-3. [DOI] [PubMed] [Google Scholar]
- Baylin SB, Esteller M, Rountree MR, Bachman KE, Schuebel K, Herman JG. Aberrant patterns of DNA methylation, chromatin formation and gene expression in cancer. Hum Mol Genet. 2001;10:687–692. doi: 10.1093/hmg/10.7.687. [DOI] [PubMed] [Google Scholar]
- Boutillier AL, Trinh E, Loeffler JP. Constitutive repression of E2F1 transcriptional activity through HDAC proteins is essential for neuronal survival. Ann N Y Acad Sci. 2002;973:438–442. doi: 10.1111/j.1749-6632.2002.tb04679.x. [DOI] [PubMed] [Google Scholar]
- Bruggemeier U, Kalff M, Franke S, Scheidereit C, Beato M. Ubiquitous transcription factor OTF-1 mediates induction of the MMTV promoter through synergistic interaction with hormone receptors. Cell. 1991;64:565–572. doi: 10.1016/0092-8674(91)90240-y. [DOI] [PubMed] [Google Scholar]
- Callaerts P, Halder G, Gehring WJ. PAX-6 in development and evolution. Annu Rev Neurosci. 1997;20:483–532. doi: 10.1146/annurev.neuro.20.1.483. [DOI] [PubMed] [Google Scholar]
- Chisaka O, Capecchi MR. Regionally restricted developmental defects resulting from targeted disruption of the mouse homeobox gene hox-1.5. Nature. 1991;350:473–479. doi: 10.1038/350473a0. [DOI] [PubMed] [Google Scholar]
- Chomczynski P, Sacchi N. Single-step method of RNA isolation by acid guanidinium thiocyanate-phenol-chloroform extraction. Anal Biochem. 1987;162:156–159. doi: 10.1006/abio.1987.9999. [DOI] [PubMed] [Google Scholar]
- Creuzet S, Couly G, Le Douarin NM. Patterning the neural crest derivatives during development of the vertebrate head: insights from avian studies. J Anat. 2005;207:447–459. doi: 10.1111/j.1469-7580.2005.00485.x. [DOI] [PMC free article] [PubMed] [Google Scholar]
- De Bilbao F, Guarin E, Nef P, Vallet P, Giannakopoulos P, Dubois-Dauphin M. Postnatal distribution of cpp32/caspase 3 mRNA in the mouse central nervous system: an in situ hybridization study. J Comp Neurol. 1999;409:339–357. doi: 10.1002/(sici)1096-9861(19990705)409:3<339::aid-cne1>3.0.co;2-q. [DOI] [PubMed] [Google Scholar]
- Dunlevy LP, Burren KA, Mills K, Chitty LS, Copp AJ, Greene ND. Integrity of the methylation cycle is essential for mammalian neural tube closure. Birth Defects Res A Clin Mol Teratol. 2006;76:544–552. doi: 10.1002/bdra.20286. [DOI] [PubMed] [Google Scholar]
- Esteller M. The necessity of a human epigenome project. Carcinogenesis. 2006;27:1121–1125. doi: 10.1093/carcin/bgl033. [DOI] [PubMed] [Google Scholar]
- Evans PM, Liu C. Roles of Krupel-like factor 4 in normal homeostasis, cancer and stem cells. Acta Biochim Biophys Sin (Shanghai) 2008;40:554–564. doi: 10.1111/j.1745-7270.2008.00439.x. [DOI] [PMC free article] [PubMed] [Google Scholar]
- Ghaleb AM, Nandan MO, Chanchevalap S, Dalton WB, Hisamuddin IM, Yang VW. Kruppel-like factors 4 and 5: the yin and yang regulators of cellular proliferation. Cell Res. 2005;15:92–96. doi: 10.1038/sj.cr.7290271. [DOI] [PMC free article] [PubMed] [Google Scholar]
- Grolleau-Julius A, Ray D, Yung RL. The Role of Epigenetics in Aging and Autoimmunity. Clin Rev Allergy Immunol. 2009 doi: 10.1007/s12016-009-8169-3. [DOI] [PMC free article] [PubMed] [Google Scholar]
- Haydar TF, Kuan CY, Flavell RA, Rakic P. The role of cell death in regulating the size and shape of the mammalian forebrain. Cereb Cortex. 1999;9:621–626. doi: 10.1093/cercor/9.6.621. [DOI] [PubMed] [Google Scholar]
- Hohl M, Thiel G. Cell type-specific regulation of RE-1 silencing transcription factor (REST) target genes. Eur J Neurosci. 2005;22:2216–2230. doi: 10.1111/j.1460-9568.2005.04404.x. [DOI] [PubMed] [Google Scholar]
- Huang Y, Doherty JJ, Dingledine R. Altered histone acetylation at glutamate receptor 2 and brain-derived neurotrophic factor genes is an early event triggered by status epilepticus. J Neurosci. 2002;22:8422–8428. doi: 10.1523/JNEUROSCI.22-19-08422.2002. [DOI] [PMC free article] [PubMed] [Google Scholar]
- Janson L, Pettersson U. Cooperative interactions between transcription factors Sp1 and OTF-1. Proc Natl Acad Sci U S A. 1990;87:4732–4736. doi: 10.1073/pnas.87.12.4732. [DOI] [PMC free article] [PubMed] [Google Scholar]
- Kuida K, Zheng TS, Na S, Kuan C, Yang D, Karasuyama H, Rakic P, Flavell RA. Decreased apoptosis in the brain and premature lethality in CPP32-deficient mice. Nature. 1996;384:368–372. doi: 10.1038/384368a0. [DOI] [PubMed] [Google Scholar]
- Liu W, Wang G, Yakovlev AG. Identification and functional analysis of the rat caspase-3 gene promoter. J Biol Chem. 2002;277:8273–8278. doi: 10.1074/jbc.M110768200. [DOI] [PubMed] [Google Scholar]
- Maroulakou IG, Bowe DB. Expression and function of Ets transcription factors in mammalian development: a regulatory network. Oncogene. 2000;19:6432–6442. doi: 10.1038/sj.onc.1204039. [DOI] [PubMed] [Google Scholar]
- Medina V, Edmonds B, Young GP, James R, Appleton S, Zalewski PD. Induction of caspase-3 protease activity and apoptosis by butyrate and trichostatin A (inhibitors of histone deacetylase): dependence on protein synthesis and synergy with a mitochondrial/cytochrome c-dependent pathway. Cancer Res. 1997;57:3697–3707. [PubMed] [Google Scholar]
- Momparler RL, Bovenzi V. DNA methylation and cancer. J Cell Physiol. 2000;183:145–154. doi: 10.1002/(SICI)1097-4652(200005)183:2<145::AID-JCP1>3.0.CO;2-V. [DOI] [PubMed] [Google Scholar]
- Mullick J, Anandatheerthavarada HK, Amuthan G, Bhagwat SV, Biswas G, Camasamudram V, Bhat NK, Reddy SE, Rao V, Avadhani NG. Physical interaction and functional synergy between glucocorticoid receptor and Ets2 proteins for transcription activation of the rat cytochrome P-450c27 promoter. J Biol Chem. 2001;276:18007–18017. doi: 10.1074/jbc.M100671200. [DOI] [PubMed] [Google Scholar]
- Patrone G, Puppo F, Cusano R, Scaranari M, Ceccherini I, Puliti A, Ravazzolo R. Nuclear run-on assay using biotin labeling, magnetic bead capture and analysis by fluorescence-based RT-PCR. Biotechniques. 2000;29:1012–1017. doi: 10.2144/00295st02. [DOI] [PubMed] [Google Scholar]
- Pryce CR. Postnatal ontogeny of expression of the corticosteroid receptor genes in mammalian brains: inter-species and intra-species differences. Brain Res Rev. 2008;57:596–605. doi: 10.1016/j.brainresrev.2007.08.005. [DOI] [PubMed] [Google Scholar]
- Razin A. CpG methylation, chromatin structure and gene silencing-a three-way connection. EMBO J. 1998;17:4905–4908. doi: 10.1093/emboj/17.17.4905. [DOI] [PMC free article] [PubMed] [Google Scholar]
- Rice JC, Allis CD. Histone methylation versus histone acetylation: new insights into epigenetic regulation. Curr Opin Cell Biol. 2001;13:263–273. doi: 10.1016/s0955-0674(00)00208-8. [DOI] [PubMed] [Google Scholar]
- Sabbagh L, Bourbonniere M, Denis F, Sekaly RP. Cloning and functional characterization of the murine caspase-3 gene promoter. DNA Cell Biol. 2006;25:104–115. doi: 10.1089/dna.2006.25.104. [DOI] [PubMed] [Google Scholar]
- Sambrook J, Fritsch E, Maniatis T. Molecular cloning: a laboratory manual. Second. Cold Spring Harbor Laboratory Press; New York: 1989. [Google Scholar]
- Sargent TD. Transcriptional regulation at the neural plate border. Adv Exp Med Biol. 2006;589:32–44. doi: 10.1007/978-0-387-46954-6_3. [DOI] [PubMed] [Google Scholar]
- Schonemann MD, Ryan AK, Erkman L, McEvilly RJ, Bermingham J, Rosenfeld MG. POU domain factors in neural development. Adv Exp Med Biol. 1998;449:39–53. doi: 10.1007/978-1-4615-4871-3_4. [DOI] [PubMed] [Google Scholar]
- Sementchenko VI, Watson DK. Ets target genes: past, present and future. Oncogene. 2000;19:6533–6548. doi: 10.1038/sj.onc.1204034. [DOI] [PubMed] [Google Scholar]
- Shames DS, Minna JD, Gazdar AF. DNA methylation in health, disease, and cancer. Curr Mol Med. 2007;7:85–102. doi: 10.2174/156652407779940413. [DOI] [PubMed] [Google Scholar]
- Sudhakar C, Jain N, Swarup G. Sp1-like sequences mediate human caspase-3 promoter activation by p73 and cisplatin. FEBS J. 2008;275:2200–2213. doi: 10.1111/j.1742-4658.2008.06373.x. [DOI] [PubMed] [Google Scholar]
- Tawa R, Ono T, Kurishita A, Okada S, Hirose S. Changes of DNA methylation level during pre- and postnatal periods in mice. Differentiation. 1990;45:44–48. doi: 10.1111/j.1432-0436.1990.tb00455.x. [DOI] [PubMed] [Google Scholar]
- Ton-That H, Kaestner KH, Shields JM, Mahatanankoon CS, Yang VW. Expression of the gut-enriched Kruppel-like factor gene during development and intestinal tumorigenesis. FEBS Lett. 1997;419:239–243. doi: 10.1016/s0014-5793(97)01465-8. [DOI] [PMC free article] [PubMed] [Google Scholar]
- Tsiftsoglou AS, Bonovolias ID, Tsiftsoglou SA. Multilevel targeting of hematopoietic stem cell self-renewal, differentiation and apoptosis for leukemia therapy. Pharmacol Ther. 2009;122:264–280. doi: 10.1016/j.pharmthera.2009.03.001. [DOI] [PubMed] [Google Scholar]
- Tumpel S, Maconochie M, Wiedemann LM, Krumlauf R. Conservation and diversity in the cis-regulatory networks that integrate information controlling expression of Hoxa2 in hindbrain and cranial neural crest cells in vertebrates. Dev Biol. 2002;246:45–56. doi: 10.1006/dbio.2002.0665. [DOI] [PubMed] [Google Scholar]
- Tusnady GE, Simon I, Varadi A, Aranyi T. BiSearch: primer-design and search tool for PCR on bisulfite-treated genomes. Nucleic Acids Res. 2005;33:e9. doi: 10.1093/nar/gni012. [DOI] [PMC free article] [PubMed] [Google Scholar]
- Wallace DM, Donovan M, Cotter TG. Histone deacetylase activity regulates apaf-1 and caspase 3 expression in the developing mouse retina. Invest Ophthalmol Vis Sci. 2006;47:2765–2772. doi: 10.1167/iovs.05-1383. [DOI] [PubMed] [Google Scholar]
- Warnecke PM, Stirzaker C, Song J, Grunau C, Melki JR, Clark SJ. Identification and resolution of artifacts in bisulfite sequencing. Methods. 2002;27:101–107. doi: 10.1016/s1046-2023(02)00060-9. [DOI] [PubMed] [Google Scholar]
- Wolffe AP. Packaging principle: how DNA methylation and histone acetylation control the transcriptional activity of chromatin. J Exp Zool. 1998;282:239–244. [PubMed] [Google Scholar]
- Yakovlev AG, Knoblach SM, Fan L, Fox GB, Goodnight R, Faden AI. Activation of CPP32-like caspases contributes to neuronal apoptosis and neurological dysfunction after traumatic brain injury. J Neurosci. 1997;17:7415–7424. doi: 10.1523/JNEUROSCI.17-19-07415.1997. [DOI] [PMC free article] [PubMed] [Google Scholar]
- Yakovlev AG, Ota K, Wang G, Movsesyan V, Bao WL, Yoshihara K, Faden AI. Differential expression of apoptotic protease-activating factor-1 and caspase-3 genes and susceptibility to apoptosis during brain development and after traumatic brain injury. J Neurosci. 2001;21:7439–7446. doi: 10.1523/JNEUROSCI.21-19-07439.2001. [DOI] [PMC free article] [PubMed] [Google Scholar]
- Zhang W, Shields JM, Sogawa K, Fujii-Kuriyama Y, Yang VW. The gut-enriched Kruppel-like factor suppresses the activity of the CYP1A1 promoter in an Sp1-dependent fashion. J Biol Chem. 1998;273:17917–17925. doi: 10.1074/jbc.273.28.17917. [DOI] [PMC free article] [PubMed] [Google Scholar]