Our retrospective reader study, which was designed to detect differences at least as large as those postulated for the primary Digital Mammographic Imaging Screening Trial (DMIST) study, did not show statistically significant differences between soft-copy digital and film mammography for Fischer, Fuji, and GE digital systems in either the full reader sets or in the subsets of women in whom digital mammography was found to be significantly superior to film mammography in the primary DMIST study.
Abstract
Purpose:
To retrospectively compare the accuracy for cancer diagnosis of digital mammography with soft-copy interpretation with that of screen-film mammography for each digital equipment manufacturer, by using results of biopsy and follow-up as the reference standard.
Materials and Methods:
The primary HIPAA-compliant Digital Mammographic Imaging Screening Trial (DMIST) was approved by the institutional review board of each study site, and informed consent was obtained. The approvals and consent included use of data for future HIPAA-compliant retrospective research. The American College of Radiology Imaging Network DMIST collected screening mammography studies performed by using both digital and screen-film mammography in 49 528 women (mean age, 54.6 years; range, 19–92 years). Digital mammography systems from four manufacturers (Fischer, Fuji, GE, and Hologic) were used. For each digital manufacturer, a cancer-enriched reader set of women screened with both digital and screen-film mammography in DMIST was constructed. Each reader set contained all cancer-containing studies known for each digital manufacturer at the time of reader set selection, together with a subset of negative and benign studies. For each reader set, six or 12 experienced radiologists attended two randomly ordered reading sessions 6 weeks apart. Each radiologist identified suspicious findings and rated suspicion of breast cancer in identified lesions by using a seven-point scale. Results were analyzed according to digital manufacturer by using areas under the receiver operating characteristic curve (AUCs), sensitivity, and specificity for soft-copy digital and screen-film mammography. Results for Hologic digital are not presented owing to the fact that few cancer cases were available. The implemented design provided 80% power to detect average AUC differences of 0.09, 0.08, and 0.06 for Fischer, Fuji, and GE, respectively.
Results:
No significant difference in AUC, sensitivity, or specificity was found between Fischer, Fuji, and GE soft-copy digital and screen-film mammography. Large reader variations occurred with each modality.
Conclusion:
No statistically significant differences were found between soft-copy digital and screen-film mammography for Fischer, Fuji, and GE digital mammography equipment.
© RSNA, 2008
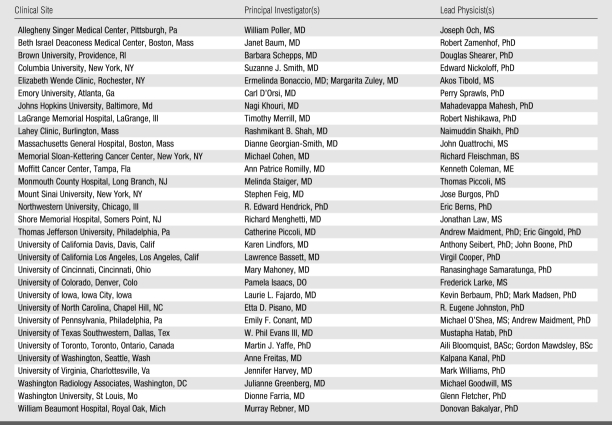
The American College of Radiology Imaging Network (ACRIN) Digital Mammographic Imaging Screening Trial (DMIST) compared full-field digital mammography (digital) with screen-film mammography (film) in screening for breast cancer (1). A total of 49 528 women were recruited at 33 institutions between October 2001 and November 2003 (Table A1 in Appendix). Five digital unit types from four manufacturers were used (Fischer SenoScan, Fischer Medical Corporation, Denver, Colo; Fuji 5000 Computed Radiography System for Mammography, Fujifilm Medical Systems, Stamford, Conn; GE Senographe 2000D, GE Healthcare, Milwaukee, Wis; and a prototype charge-coupled device [CCD] system and a newer selenium-based detector system [Selenia] from Hologic, Bedford, Mass). These digital systems differ in detector design and resulting spatial resolution. They, along with the wide variety of screen-film systems used in DMIST (Table A2 in Appendix), have been described elsewhere (1). During accrual to DMIST, these were the only digital mammography systems available for either clinical or research use.
The primary goal of DMIST was to compare single, independent readings of film and digital mammography for accuracy in cancer detection, with all digital manufacturers combined. The results of the primary study have been reported elsewhere and showed a nonsignificant difference between digital and film mammography for the entire study group (2). The primary study found significantly higher areas under the receiver operating characteristic (ROC) curve (AUCs) for digital than for film mammography in three overlapping subgroups: women younger than 50 years, pre- and perimenopausal women, and women with heterogeneously or extremely dense breasts (2). The purpose of our current study was to retrospectively compare the accuracy for cancer diagnosis of digital mammography with soft-copy interpretation with that of screen-film mammography for each digital equipment manufacturer, by using results of biopsy and follow-up as the reference standard.
MATERIALS AND METHODS
Examinations
The primary DMIST study was approved by the institutional review board of each study site, by the National Institutes of Health's Clinical Trial Evaluation Program, and by ACRIN. All participants gave written informed consent prior to enrollment in the study. In addition, the study was monitored by a study-specific Data Safety and Monitoring Board. All institutional review board approvals and consent forms included the provision that images and cancer status at follow-up could be used for future research such as this retrospective reader study. The primary study was Health Insurance Portability and Accountability Act compliant at all study sites; our retrospective study was also compliant.
To permit soft-copy interpretation in this study, Fujifilm Medical Systems USA loaned a MV Review Workstation, GE Healthcare loaned a SenoAdvantage Workstation, Fischer Imaging loaned a Fischer Review Workstation, and Hologic loaned a Selenia Review Workstation. Fuji also loaned a Fuji laser imager and provided DP-L film (laser images) for another, related research project. GE Healthcare provided technical assistance in converting saved raw images into processed digital images for soft-copy interpretation. Throughout this study, its authors maintained complete control of the data, their analyses, and the information submitted for publication.
Accrual to the primary study of 49 528 women (mean age, 54.6 years; range, 19–92 years) was chosen to ensure adequate power to detect a difference of 0.06 in AUCs on the basis of a single interpretation of the images acquired with each modality (1,2). It was anticipated that because the number of women and cancer cases accrued to each digital mammography manufacturer would be approximately one-quarter of the total number accrued, it would be necessary to conduct a retrospective reader study with multiple readers to achieve similar power in comparing the accuracy of mammography performed with each digital mammography manufacturer's equipment with that of film mammography.
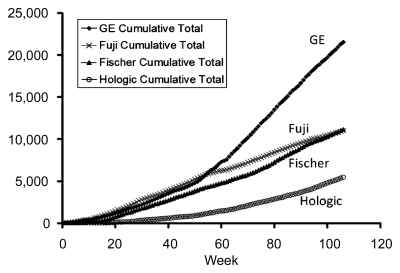
Accrual to DMIST was slower than anticipated at some sites. Some digital manufacturers, in particular Hologic, were unable to provide a sufficient number of units during the first half of the study to meet the goal of equal accrual for each digital system type. As a result, additional study sites with available digital units from other manufacturers were added. This increased the number of accrued women for one digital manufacturer, GE, to compensate for lower than anticipated accrual for other manufacturers ' digital systems (Fig 1).
Figure 1:
Graph shows cumulative accrual of women (numbers along y-axis) according to digital manufacturer during the 107 weeks of DMIST accrual.
Equipment
Five digital system types from four manufacturers were used in DMIST. These included two different unit types from Hologic: a prototype CCD detector system and the newer Selenia system, which is sold commercially. The Selenia system was introduced during the second half of accrual to DMIST. In selecting paired mammography studies for use in this retrospective reader study, the decision was made to include only Hologic studies acquired with the Selenia system (not the CCD system), because that system was the one being sold commercially; this severely limited the number of cancer studies available for Hologic digital mammography for our reader study.
Reader Study Sets and Reference Standard
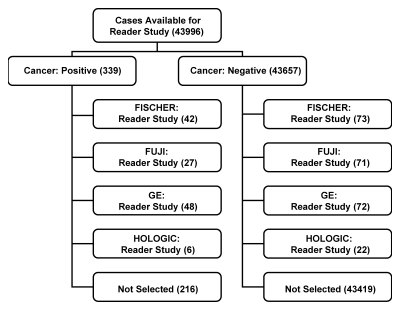
By using a subset of studies acquired in DMIST, four reader study sets were assembled—one for each digital manufacturer (Fig 2). The target design of the reader studies was to include 50 cancer-containing and 75 non–cancer-containing studies for each manufacturer. This number of studies and readers (n = 12) was chosen to ensure 80% power to detect a difference of 0.06 in average AUCs between the two modalities for each manufacturer. As detailed below, the target numbers of readers and cases were not fully achieved during this study. As a consequence, the study design as actually implemented would ensure 80% power to detect a difference of 0.06 in average AUCs for the GE study set, a difference of 0.09 for the Fischer study set, and a difference of 0.08 for the Fuji study set. As noted below, results for the fourth manufacturer (Hologic) are not presented because of very low accrual in the primary study for that manufacturer.
Figure 2:
Flowchart of study selection for this retrospective reader study.
Each reader study set consisted of paired film and digital studies, acquired in randomized order by a single technologist in each woman. The study set selected for the retrospective multireader study of each digital manufacturer's equipment included all cancers known at the time of case selection, regardless of the method of detection, along with a sample of negative and benign studies. This approach of using a cancer-enriched study set with multiple readers has been used to obtain Food and Drug Administration approval of digital systems (3,4) and in other digital studies (5–8).
For each digital manufacturer, the study set included three non–cancer-containing studies for every two cancer-containing studies. Cancers were proved with biopsy and histopathologic examination (reference standard). Non–cancer-containing studies were proved either with follow-up mammography 10 months or longer after study entry, including subsequent work-up, or other information (reference standard). No non–cancer-containing study selected for a study set was subsequently found to contain cancer at follow-up. Non–cancer-containing studies were randomly selected among the studies performed with that digital manufacturer's unit and were matched to cancer-containing studies from the same institution in terms of patient age and breast density (Table 1). In study selection, no distinction was made between normal and benign studies. Retrospectively, normal studies were defined as those that received a Breast Imaging Reporting and Data System (BI-RADS) rating of 1 at primary interpretations of both film and digital mammograms (Table 1). Benign studies were defined as non–cancer-containing studies that received a BI-RADS rating of 2 or 3 at primary interpretations of film mammograms, digital mammograms, or both.
Table 1.
Studies and Readers for Manufacturer Reader Studies

Because of time limits on DMIST funding, reading sets were selected just after study accrual ended. Thus, at the time of study selection, 1-year follow-up had occurred for fewer than half of the total number of women accrued to DMIST, and many cancer studies had not yet appeared in the DMIST database. As a result, 50 cancer-containing studies were not available for any manufacturer (Fig 2). Due to the late introduction of the Selenia system, only six cancer-containing studies were available from Hologic digital sites at the time of study selection. Consequently, results for Hologic are not presented because of the small sample size available for this manufacturer's reading set.
Readers and Reading Criteria
For each reader study set, volunteer readers were recruited, primarily from the pool of qualified radiologists who served as primary readers in DMIST. Readers were informed of the purpose of the machine-specific reader study, the total number of studies they would be required to interpret for each modality, and the time commitment required before they consented to participate. Twenty-six readers were recruited in all (including E.D.P., M.A.C., and M.R.); 24 readers had experience interpreting digital studies. Twelve volunteer readers, all of whom had previous experience interpreting digital studies, were recruited for the Fuji reader study set. No readers had experience with the Fuji digital review workstation, because it was not available until the time of the reader study. Ten of the 12 volunteer GE readers had prior experience interpreting soft-copy digital studies with the GE digital review workstation; two had no previous digital experience. Only six readers could be recruited for the Fischer reader study set; four of these readers had previous experience interpreting Fischer digital studies in both hard and soft copy; the other two readers for Fischer digital examinations had previous soft-copy digital interpretation experience only with the GE digital review workstation. Four readers participated in interpretation of two different digital mammography study sets. Overall, readers had a range of experience in breast imaging from 1.5 to 33 years and a range of experience in digital mammography from 0 to 8 years.
Study radiologists interpreted both film and digital studies in each study set in random order, with at least 6 weeks between interpretations of images acquired with the two modalities to minimize case recall. No time constraints were placed on readers for either modality. Film studies consisted of original films interpreted at a dedicated mammography alternator. Digital examinations consisted of digital images acquired with manufacturer-recommended image processing techniques and interpreted with the manufacturer's recommended soft-copy digital review workstation. Although most reviewers had soft-copy interpretation experience, prior to soft-copy interpretation, each reviewer was instructed on the specific digital review workstation used for interpretation, including instruction on its functional capabilities, navigation through a case, and basic image manipulation features (including window and level adjustment and zooming, panning, magnifying, and flipping images). All studies were masked in terms of patient identification and, where possible, in terms of source institution identification. It was not possible to mask all studies for source institution because original films were being used and because some digital displays presented that information. Interpretation of the images acquired with each modality was performed without access to prior images or patient history.
For each study acquired with each modality, each reader specified any finding, its laterality, and suspicion of malignancy by using the following seven-point scale:
1: The finding is definitely not malignant.
2: The finding is almost certainly not malignant.
3: The finding is probably not malignant.
4: The finding is possibly malignant.
5: The finding is probably malignant.
6: The finding is almost certainly malignant.
7: The finding is definitely malignant.
ROC curves were constructed by using the seven-point scale rather than BI-RADS because the seven-point scale provided a true ordinal scale for suspicion of malignancy. BI-RADS does not provide a true ordinal scale and introduces problems in assigning a degree of suspicion to BI-RADS 0 interpretations (8). The results reported here for sensitivity and specificity were also obtained by using the seven-point scale, with scores of 1–3 considered to indicate a negative study and scores of 4–7 considered to indicate a positive study (1,2).
Statistical Analysis
For each reader and each modality, we estimated the AUC, sensitivity, and specificity. These values were then averaged across readers for each digital manufacturer and for each modality. To account for the multireader, multimodality design of the study, we used a mixed model to compare the average AUC, sensitivity, and specificity of the two modalities within each digital manufacturer subgroup. In each model, the modality was entered as a fixed effect and the reader was entered as a random effect (9–11). Estimates of AUC were developed by using a parametric binormal model as implemented in ROCKIT software (Charles E. Metz, PhD, Department of Radiology, University of Chicago, Chicago, Ill; available at http://www-radiology.uchicago.edu/krl/KRL_ROC/software_index.htm). Estimates of correlations in AUCs needed for the mixed-model calculations were derived from paired analysis by using ROCKIT. Estimates of correlations for sensitivity and specificity terms were developed by using large-sample theory. P values of less than .05 were considered to indicate significant differences for AUC, sensitivity, and specificity for each digital manufacturer compared with film mammography.
For each manufacturer, the above analysis was conducted first by using the ensemble of all reader-set studies and then for three subsets of women identified as subsets of interest in the primary DMIST article: women younger than 50 years, pre- and perimenopausal women, and women with heterogeneously dense or extremely dense breasts. Premenopausal women were defined as women whose last menstrual period was within 30 days, perimenopausal women were those whose last menstrual period was between 30 and 365 days, and postmenopausal women were those who had surgical menopause or whose last menstrual period was more than 365 days from the date of their study mammogram. In the analysis of subsets, AUCs and correlations were estimated nonparametrically. For these subgroup comparisons, P values of .05 were considered to indicate significant differences for each digital manufacturer versus film mammography.
We assessed agreement between readers by using a κ statistic computed for all pairs of readers within each modality and by using the reader responses on the seven-point suspicion scale, considering both the full seven-point range and dichotomized results (with scores of 1–3 indicating negative studies and scores of 4–7 indicating positive studies).
RESULTS
AUC Values
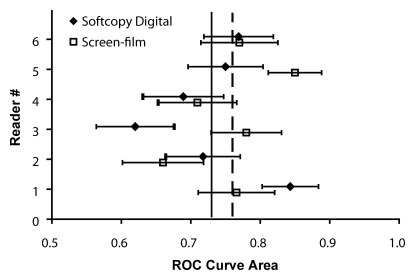
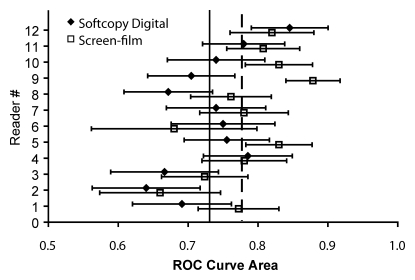
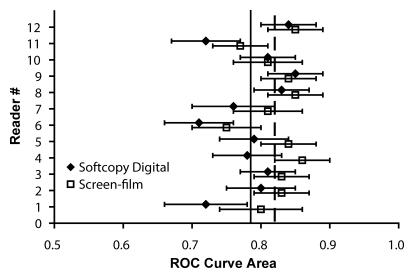
For soft-copy interpretation with the Fischer digital system, reader AUCs ranged from 0.62 to 0.84 (mean, 0.73); AUCs ranged from 0.66 to 0.85 (mean, 0.76) for the corresponding film examinations (Fig 3a). For soft-copy interpretation with the Fuji digital system, reader AUCs ranged from 0.64 to 0.85 (mean, 0.73); AUCs ranged from 0.66 to 0.88 (mean, 0.78) for the corresponding film examinations (Fig 3b). Reader AUCs for soft-copy interpretation with the GE digital system ranged from 0.71 to 0.85 (mean, 0.78); AUCs ranged from 0.75 to 0.86 (mean, 0.82) for the corresponding film examinations (Fig 3c). There was no significant difference between digital and film mammography in AUCs averaged across all readers for any of the three digital unit types evaluated. The 95% confidence interval for the difference in average AUC (between screen-film and digital mammography) was −0.08, 0.13 for Fischer (P = .59); −0.01, 0.1 for Fuji (P = .09); and −0.02, 0.09 for GE (P = .16) (Table 2).
Figure 3a:
(a) Graph shows AUC according to reader for Fischer digital versus paired screen-film mammographic studies. Solid vertical line = mean AUC across all six readers for digital studies (0.73); dashed vertical line = mean AUC across all six readers for film studies (0.76). (b) Graph shows AUC according to reader for Fuji digital versus paired screen-film mammographic studies. Solid vertical line = mean AUC across all 12 readers for digital studies (0.73); dashed vertical line = mean AUC across all 12 readers for film studies (0.78). (c) Graph shows AUC according to reader for GE digital versus paired screen-film mammographic studies. Solid vertical line = mean AUC across all 12 readers for digital studies (0.78); dashed vertical line = mean AUC across all 12 readers for film studies (0.82).
Figure 3b:
(a) Graph shows AUC according to reader for Fischer digital versus paired screen-film mammographic studies. Solid vertical line = mean AUC across all six readers for digital studies (0.73); dashed vertical line = mean AUC across all six readers for film studies (0.76). (b) Graph shows AUC according to reader for Fuji digital versus paired screen-film mammographic studies. Solid vertical line = mean AUC across all 12 readers for digital studies (0.73); dashed vertical line = mean AUC across all 12 readers for film studies (0.78). (c) Graph shows AUC according to reader for GE digital versus paired screen-film mammographic studies. Solid vertical line = mean AUC across all 12 readers for digital studies (0.78); dashed vertical line = mean AUC across all 12 readers for film studies (0.82).
Figure 3c:
(a) Graph shows AUC according to reader for Fischer digital versus paired screen-film mammographic studies. Solid vertical line = mean AUC across all six readers for digital studies (0.73); dashed vertical line = mean AUC across all six readers for film studies (0.76). (b) Graph shows AUC according to reader for Fuji digital versus paired screen-film mammographic studies. Solid vertical line = mean AUC across all 12 readers for digital studies (0.73); dashed vertical line = mean AUC across all 12 readers for film studies (0.78). (c) Graph shows AUC according to reader for GE digital versus paired screen-film mammographic studies. Solid vertical line = mean AUC across all 12 readers for digital studies (0.78); dashed vertical line = mean AUC across all 12 readers for film studies (0.82).
Table 2.
Reader Study Results according to Digital Manufacturer
Note.—Unless otherwise specified, data are mean values ± standard errors of the mean. Results for Hologic are not presented because of the small sample size available for that manufacturer's reading set.
* For film versus digital mammography; data in parentheses are 95% confidence intervals.
Sensitivity
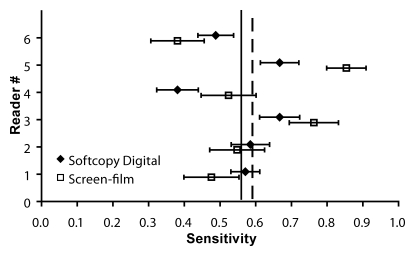
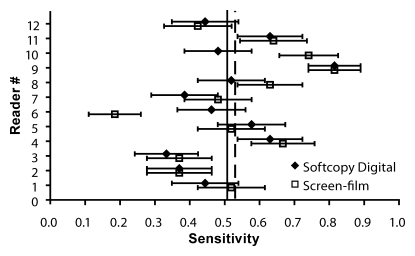
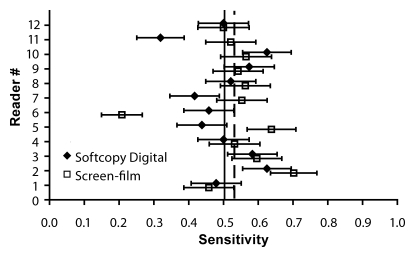
For soft-copy interpretation of Fischer digital studies, reader sensitivities ranged from 0.38 to 0.67 (mean, 0.56); sensitivities ranged from 0.38 to 0.85 (mean, 0.59) for the paired set of film studies (Fig 4a). For soft-copy interpretation of Fuji digital studies, reader sensitivities ranged from 0.33 to 0.81 (mean, 0.51); sensitivities ranged from 0.19 to 0.81 (mean, 0.53) for the paired film studies (Fig 4b). For soft-copy interpretation of GE digital studies, reader sensitivities ranged from 0.32 to 0.63 (mean, 0.50); sensitivities ranged from 0.21 to 0.70 (mean, 0.53) for the paired film studies (Fig 4c). The comparison of digital and film sensitivities averaged across all readers revealed no significant difference for any of the three digital unit types evaluated. The 95% confidence interval for the difference in average sensitivity (between screen-film and digital mammography) was −0.12, 0.18 for Fischer (P = .62); −0.07, 0.12 for Fuji (P = .61); and −0.08, 0.13 for GE (P = .56) (Table 2).
Figure 4a:
(a) Graph shows sensitivity according to reader for Fischer digital versus paired screen-film mammographic studies. Solid vertical line = mean sensitivity across readers for digital studies (0.56); dashed vertical line = mean sensitivity across readers for film studies (0.59). (b) Graph shows sensitivity according to reader for Fuji digital versus paired screen-film mammographic studies. Solid vertical line = mean sensitivity across readers for digital studies (0.51); dashed vertical line = mean sensitivity across readers for film studies (0.53). (c) Graph shows sensitivity according to reader for GE digital versus paired screen-film mammographic studies. Solid vertical line = mean sensitivity across readers for digital studies (0.50); dashed vertical line = mean sensitivity across readers for film studies (0.53).
Figure 4b:
(a) Graph shows sensitivity according to reader for Fischer digital versus paired screen-film mammographic studies. Solid vertical line = mean sensitivity across readers for digital studies (0.56); dashed vertical line = mean sensitivity across readers for film studies (0.59). (b) Graph shows sensitivity according to reader for Fuji digital versus paired screen-film mammographic studies. Solid vertical line = mean sensitivity across readers for digital studies (0.51); dashed vertical line = mean sensitivity across readers for film studies (0.53). (c) Graph shows sensitivity according to reader for GE digital versus paired screen-film mammographic studies. Solid vertical line = mean sensitivity across readers for digital studies (0.50); dashed vertical line = mean sensitivity across readers for film studies (0.53).
Figure 4c:
(a) Graph shows sensitivity according to reader for Fischer digital versus paired screen-film mammographic studies. Solid vertical line = mean sensitivity across readers for digital studies (0.56); dashed vertical line = mean sensitivity across readers for film studies (0.59). (b) Graph shows sensitivity according to reader for Fuji digital versus paired screen-film mammographic studies. Solid vertical line = mean sensitivity across readers for digital studies (0.51); dashed vertical line = mean sensitivity across readers for film studies (0.53). (c) Graph shows sensitivity according to reader for GE digital versus paired screen-film mammographic studies. Solid vertical line = mean sensitivity across readers for digital studies (0.50); dashed vertical line = mean sensitivity across readers for film studies (0.53).
Specificity
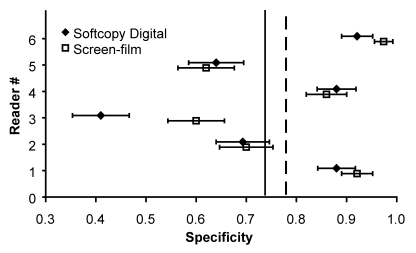
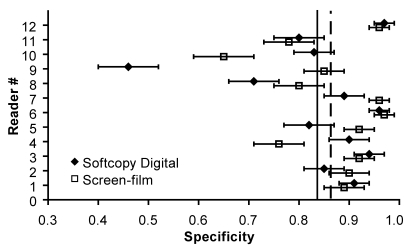
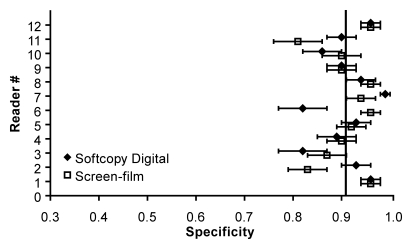
For soft-copy interpretation of Fischer digital studies, reader specificities ranged from 0.41 to 0.92 (mean, 0.74); specificities ranged from 0.60 to 0.97 (mean, 0.78) for the paired film studies (Fig 5a). For Fuji digital studies, reader specificities ranged from 0.46 to 0.97 (mean, 0.84); specificities ranged from 0.65 to 0.97 (mean, 0.86) for the paired film studies (Fig 5b). For soft-copy interpretation of GE digital studies, reader specificities ranged from 0.82 to 0.99 (mean, 0.91); specificities ranged from 0.81 to 0.96 (mean, 0.91) for the paired film studies (Fig 5c). There was no significant difference between specificities of digital and film mammography averaged across all readers for any of the three digital unit types evaluated. The 95% confidence interval for the difference in average specificity (between screen-film and digital mammography) was −0.04, 0.13 for Fischer (P = .26); −0.07, 0.11 for Fuji (P = .57); and −0.05, 0.05 for GE (P = .97) (Table 2).
Figure 5a:
(a) Graph shows specificity according to reader for Fischer digital versus paired screen-film mammographic studies. Solid vertical line = mean specificity across readers for digital studies (0.74); dashed vertical line = mean specificity across readers for film studies (0.78). (b) Graph shows specificity according to reader for Fuji digital versus paired screen-film mammographic studies. Solid vertical line = mean specificity across readers for digital studies (0.84); dashed vertical line = mean specificity across readers for film studies (0.86). (c) Graph shows specificity according to reader for GE digital versus paired screen-film mammographic studies. Solid vertical line = mean specificity across readers for both digital (0.91) and film (0.91) studies.
Figure 5b:
(a) Graph shows specificity according to reader for Fischer digital versus paired screen-film mammographic studies. Solid vertical line = mean specificity across readers for digital studies (0.74); dashed vertical line = mean specificity across readers for film studies (0.78). (b) Graph shows specificity according to reader for Fuji digital versus paired screen-film mammographic studies. Solid vertical line = mean specificity across readers for digital studies (0.84); dashed vertical line = mean specificity across readers for film studies (0.86). (c) Graph shows specificity according to reader for GE digital versus paired screen-film mammographic studies. Solid vertical line = mean specificity across readers for both digital (0.91) and film (0.91) studies.
Figure 5c:
(a) Graph shows specificity according to reader for Fischer digital versus paired screen-film mammographic studies. Solid vertical line = mean specificity across readers for digital studies (0.74); dashed vertical line = mean specificity across readers for film studies (0.78). (b) Graph shows specificity according to reader for Fuji digital versus paired screen-film mammographic studies. Solid vertical line = mean specificity across readers for digital studies (0.84); dashed vertical line = mean specificity across readers for film studies (0.86). (c) Graph shows specificity according to reader for GE digital versus paired screen-film mammographic studies. Solid vertical line = mean specificity across readers for both digital (0.91) and film (0.91) studies.
Results for AUC, sensitivity, and specificity are not given for the Hologic digital system or for film studies paired with it because of the limited number of studies and cancer cases acquired with this system (Table 1). With only 28 studies and six cancers, AUC, sensitivity, and specificity could not be determined with reliable confidence intervals for the Hologic digital studies or the corresponding film studies.
Variability in Diagnostic Performance
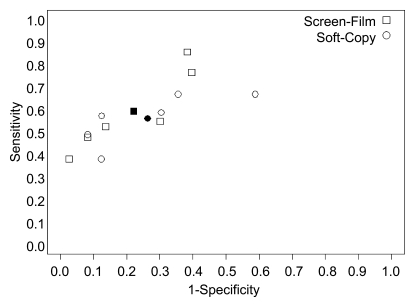
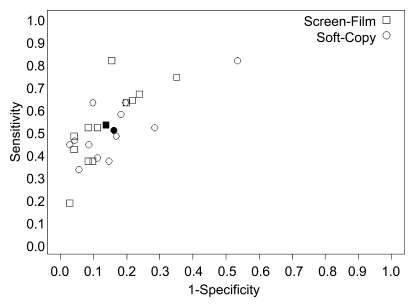
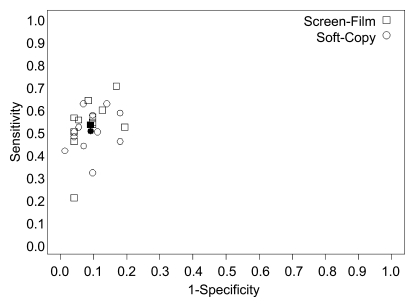
In addition to comparison of average AUCs, sensitivities, and specificities between digital and film mammography for each digital mammography manufacturer, our multireader study also permitted assessment of variability in diagnostic performance across readers. This variability (Figs 3–5) was substantial, especially for sensitivities and specificities. The sensitivity-specificity point for each reader on the ROC graph according to manufacturer indicated that some of the variation in sensitivity and specificity was due to different readers operating at different criteria for positivity on similar ROC curves (Fig 6).
Figure 6a:
Graphs show sensitivity versus 1 − specificity according to reader for (a) Fischer, (b) Fuji, and (c) GE digital reader sets. □ = sensitivity versus 1 − specificity points for each reader with screen-film mammography; ○ = points for each reader with soft-copy digital mammography. ▪ And • = sensitivity versus 1 − specificity points for film and digital mammography, respectively, averaged over all readers (n = 6 for Fischer; n = 12 for Fuji and GE).
Figure 6b:
Graphs show sensitivity versus 1 − specificity according to reader for (a) Fischer, (b) Fuji, and (c) GE digital reader sets. □ = sensitivity versus 1 − specificity points for each reader with screen-film mammography; ○ = points for each reader with soft-copy digital mammography. ▪ And • = sensitivity versus 1 − specificity points for film and digital mammography, respectively, averaged over all readers (n = 6 for Fischer; n = 12 for Fuji and GE).
Figure 6c:
Graphs show sensitivity versus 1 − specificity according to reader for (a) Fischer, (b) Fuji, and (c) GE digital reader sets. □ = sensitivity versus 1 − specificity points for each reader with screen-film mammography; ○ = points for each reader with soft-copy digital mammography. ▪ And • = sensitivity versus 1 − specificity points for film and digital mammography, respectively, averaged over all readers (n = 6 for Fischer; n = 12 for Fuji and GE).
When the full range of the seven-point scale was used, agreement was low among readers, as assessed with the κ statistic for each pair of readers. Median κ values for soft-copy digital and film mammography, respectively, were 0.10 and 0.12 for Fischer, 0.19 and 0.20 for Fuji, and 0.24 and 0.20 for GE when the full range of the seven-point scale was used.
Agreement was considerably better when dichotomized seven-point scale responses (scores of 1–3 indicating a negative study and scores of 4–7 indicating a positive study) were used. With the dichotomized seven-point scale, median κ values for soft-copy digital and film mammography, respectively, were 0.23 and 0.29 for Fischer, 0.45 and 0.45 for Fuji, and 0.51 and 0.52 for GE.
Subgroup Analysis
Because the primary DMIST study showed superior performance for digital mammography in the subgroups of women younger than 50 years, pre- and perimenopausal women, and women with heterogeneously dense or extremely dense breasts, we investigated whether similar differences existed in our reader study results for each manufacturer. The total number of women who met each of these three criteria was small for the Fischer, Fuji, and GE reader sets, ranging from 28 to 34 women who were younger than 50 years, 36 to 46 women who were pre- or perimenopausal, and 43 to 61 women with heterogeneously dense or extremely dense breasts. For example, when the reader sets were subdivided by age, for women younger than 50 years, there were only 34 Fischer studies (11 cancers), 30 Fuji studies (seven cancers), and 28 GE studies (10 cancers). No statistically significant differences were found between digital and film mammography in average AUC, average sensitivity, or average specificity in any of the three subgroups for any digital manufacturer in this multireader study.
DISCUSSION
The results of our multireader study show no statistically significant difference in diagnostic accuracy between digital and film mammography for the three digital manufacturers tested (Fuji, Fischer, and GE). Because of the paired design of DMIST, digital and film mammography were performed in each woman. The design of our retrospective reader study further matched readers for digital and film studies for a given digital manufacturer. Thus, the primary analysis of our study was to compare digital with film mammography for each digital manufacturer. Our results are not intended for comparison of one digital manufacturer's equipment with another's.
Our multireader study results agree with the primary DMIST study results in that we found no statistically significant difference in AUCs between film and digital mammography for the entire study group (2). The primary DMIST study combined all digital manufacturers, included all verifiable studies, and used one reader per modality, finding a difference in AUCs of 0.03 that favored digital mammography but lacked statistical significance (P = .18). Our reader study examined each digital manufacturer versus film mammography separately, by using all verified-positive cases (at the time of case selection) and a subset of negative cases for each manufacturer. The design as implemented achieved 80% power for a difference of 0.06 only for the GE substudy. The detectable difference was higher for Fischer and Fuji digital systems (0.09 and 0.08, respectively). None of the estimated differences in average AUC was as large as the minimum differences detectable with 80% power in this design. In addition, although all confidence intervals for the difference in average AUCs contained zero, the intervals for Fuji and GE contained values mostly in favor of screen-film mammography.
The primary DMIST study found that digital mammography was superior to film mammography in three partially overlapping subgroups. For women younger than 50 years and for pre- and perimenopausal women, digital mammography AUCs exceeded those of film mammography by 0.15 (P = .002 for both). For women with heterogeneously or extremely dense breasts, digital mammography AUC exceeded that of film mammography by 0.11 (P = .003) (2). Our multireader study failed to find statistically significant AUC differences between individual digital manufacturers and paired film studies in these three subgroups. However, this reader study was not designed to provide adequate power for these subset comparisons. Primary DMIST results were not available when our multireader study was designed; therefore, no effort was made to focus case selection on the three subgroups for our multireader study.
In the primary DMIST study, which combined all digital manufacturers, the sensitivity and specificity of both digital and film mammography were 0.41 and 0.98, respectively (2). The sensitivities reported according to digital manufacturer for our multireader study, ranging from 0.50 to 0.59, are consistently higher than those reported in the primary study, while the specificities reported in our study, ranging from 0.74 to 0.91, are consistently lower. There could be several reasons for these differences in performance. The most likely explanation is that readers performed differently in an enriched, retrospective study compared with a prospective, unenriched study or compared with the clinical setting, where a positive finding requires recall and further work-up of the patient. In a retrospective reader study with an enriched number of cancers, such as our reader study, readers may shift their operating point on the ROC curve toward increased sensitivity at the cost of lower specificity, because a positive finding has no effect on patient care.
Another possible explanation for a difference in reader performance between the two studies might be a difference in reader experience, although 24 of the 26 readers participating in our retrospective reader study had prior experience in interpreting digital mammograms. Another possible explanation might be a difference between the studies selected for our retrospective reader study and those in the primary study.
A separate multireader study has been designed within DMIST to assess the effect of breast density on the diagnostic accuracy of both digital and film mammography. Its results are being submitted for publication elsewhere.
In hindsight, it might have been better to weigh case selection in our multireader study toward the subgroups of women in whom digital mammography showed benefit in the primary study. This might have helped determine which digital manufacturers contributed to the superiority of digital over film mammography in younger women and in women with denser breasts. Unfortunately, the results of our study do not answer that question, in part because case selection for our multireader study occurred prior to analysis of the primary DMIST results.
Limitations of our study included case selection that did not meet the targeted number of cancer studies for any digital manufacturer. The reader set for Hologic included so few cancers that results for that manufacturer could not be evaluated reliably. In addition, only six readers could be recruited for the Fischer reader set, compared with 12 readers for the Fuji and GE sets. Not all readers had prior experience with the specific digital soft-copy workstation used in our reader study. In fact, no readers had prior experience with the Fuji workstation. Finally, the retrospective nature of our study and the cancer-enriched reader sets may have altered the manner in which studies were interpreted compared with the manner used in clinical practice.
In conclusion, our retrospective reader study, which was designed to detect differences at least as large as those postulated for the primary DMIST study, did not show statistically significant differences between soft-copy digital and film mammography for Fischer, Fuji, and GE digital systems in either the full reader sets or in the subsets of women in whom digital mammography was found to be significantly superior to film mammography in the primary DMIST study.
APPENDIX
The clinical sites of DMIST, as well as the principal investigators and lead physicists at each site, are listed in Table A1. Table A2 lists the screen-film mammography units with which the digital units were compared.
Table A1.
Principal Investigators and Lead Physicists at DMIST Clinical Sites
Table A2.
Screen-Film Mammography Equipment Used according to Digital Manufacturer
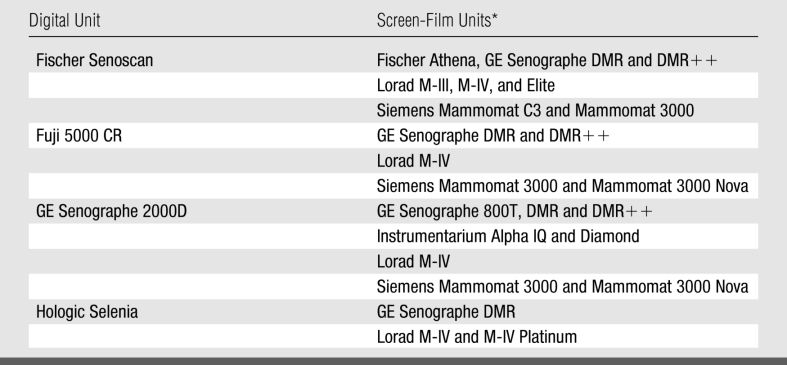
* The Lorad units were manufactured by Lorad Breast Imaging (a subsidiary of Hologic) of Danbury, Conn, and the Siemens units were manufactured by Siemens Medical Solutions USA of Malvern, Pa; Instrumentarium is now part of GE Healthcare.
Advances in Knowledge.
This retrospective reader study showed no difference in accuracy for cancer diagnosis between soft-copy digital and screen-film mammography for Fischer, Fuji, and GE digital mammography systems.
This study also found no difference between these three digital systems and screen-film mammography in women with denser breasts, pre- and perimenopausal women, and women younger than 50 years.
High variability among readers was shown in sensitivity, specificity, and areas under receiver operating characteristic curves for all three digital manufacturers and for corresponding screen-film mammography study sets.
Implication for Patient Care.
In the circumstances described in this manuscript, soft-copy digital and screen-film mammography may be used interchangeably for cancer diagnosis.
Received Mar 2, 2007; revision requested May 2; revision received Aug 16; accepted Aug 28; final version accepted Sept 26.
Funding: This work was supported by the National Cancer Institute (grant 5 U01 CA080098-09).
All members of the DMIST Investigators Group are listed in the Appendix. R.E.H. has received honoraria from GE Healthcare for continuing medical education lectures. The Univ of North Carolina has research agreements with GE from which E.B.C. receives some salary support. R.A.J. has a current research collaboration with GE Healthcare involving digital mammography. C.J.D. is a medical consultant with GE Medical and Hologic and a stockholder with Hologic.
Abbreviations:
- ACRIN
- American College of Radiology Imaging Network
- AUC
- area under the ROC curve
- BI-RADS
- Breast Imaging Reporting and Data System
- CCD
- charge-coupled device
- DMIST
- Digital Mammographic Imaging Screening Trial
- ROC
- receiver operating characteristic
References
- 1.Pisano ED, Gatsonis CA, Yaffe MJ, et al. American College of Radiology Imaging Network digital mammographic imaging screening trial: objectives and methodology. Radiology 2005;236(2):404–412 [DOI] [PubMed] [Google Scholar]
- 2.Pisano ED, Gatsonis CA, Hendrick RE, et al. Diagnostic accuracy of digital versus film mammography for breast cancer screening. N Engl J Med 2005;353(17):1773–1783. [Published correction appears in N Engl J Med 2006;355(17):1840.] [DOI] [PubMed] [Google Scholar]
- 3.Hendrick RE, Lewin JM, D'Orsi CJ, et al. Non-inferiority study of FFDM in an enriched diagnostic cohort: comparison with screen-film mammography in 625 women. In: Yaffe MJ, ed. IWDM 2000: 5th International Workshop on Digital Mammography Madison, Wis: Med Phys Publishing, 2001; 475–481 [Google Scholar]
- 4.Cole E, Pisano ED, Brown M, et al. Diagnostic accuracy of Fischer SenoScan digital mammography versus screen-film mammography in a diagnostic mammography population. Acad Radiol 2004;11(8):879–886 [DOI] [PubMed] [Google Scholar]
- 5.Pisano ED, Cole EB, Kistner EO, et al. Interpretation of digital mammograms: comparison of speed and accuracy of soft-copy versus printed-film display. Radiology 2002;223(2):483–488 [DOI] [PubMed] [Google Scholar]
- 6.Kuzmiak CM, Millnamow GA, Qaqish B, et al. Comparison of full field digital mammography to film-screen mammography with respect to diagnostic accuracy of lesion characterization in breast tissue biopsy specimens. Acad Radiol 2002;9(12):1378–1382 [DOI] [PubMed] [Google Scholar]
- 7.Cole EB, Pisano ED, Kistner EO, et al. Diagnostic accuracy of digital mammography in patients with dense breasts presenting for problem-solving mammography: image processing and lesion type effects. Radiology 2003;226(1):153–160 [DOI] [PubMed] [Google Scholar]
- 8.Skaane P, Balleyguier C, Diekmann F, et al. Breast lesion detection and classification: comparison of screen-film mammography and full-field digital mammography with softcopy reading—observer performance study. Radiology 2005;237(1):37–44 [DOI] [PubMed] [Google Scholar]
- 9.Obuchowski NA.Multireader, multimodality receiver operating characteristic curve studies: hypothesis testing and sample size estimation using an analysis of variance approach with dependent observations. Acad Radiol 1995;2(suppl 1):S22–S29 [PubMed] [Google Scholar]
- 10.Obuchowski NA.Multireader receiver operating characteristic studies: a comparison of study designs. Acad Radiol 1995;2(8):709–716 [DOI] [PubMed] [Google Scholar]
- 11.Obuchowski NA, Rockette HE.Hypothesis testing of diagnostic accuracy for multiple readers and multiple tests: an ANOVA approach with dependent observations. Commun Stat Simulat 1995;24:285–308 [Google Scholar]


