

Abstract
Bleomycin (Bm) N-acetyltransferase, BAT, is a self-resistance determinant in Bm-producing Streptomyces verticillus ATCC15003. In our present study, we crystallized BAT under both a terrestrial and a microgravity environment in the International Space Station. In addition to substrate-free BAT, the crystal structures of BAT in a binary complex with CoA and in a ternary complex with Bm and CoA were determined. BAT forms a dimer structure via interaction of its C-terminal domains in the monomers. However, each N-terminal domain in the dimer is positioned without mutual interaction. The tunnel observed in the N-terminal domain of BAT has two entrances: one that adopts a wide funnel-like structure necessary to accommodate the metal-binding domain of Bm, and another narrow entrance that accommodates acetyl-CoA (AcCoA). A groove formed on the dimer interface of two BAT C-terminal domains accommodates the DNA-binding domain of Bm. In a ternary complex of BAT, BmA2, and CoA, a thiol group of CoA is positioned near the primary amine of Bm at the midpoint of the tunnel. This proximity ensures efficient transfer of an acetyl group from AcCoA to the primary amine of Bm. Based on the BAT crystal structure and the enzymatic kinetic study, we propose that the catalytic mode of BAT takes an ordered-like mechanism.
Introduction
Bleomycin (Bm)2 (Fig. 1), which is an antibiotic produced by Streptomyces verticillus, is widely employed in the treatment of several neoplastic diseases, including non-Hodgkin lymphoma, squamous cell carcinomas, and testicular tumors (1, 2). In the Bm family, which includes bleomycinic acid, BmA2, and BmB2, the members differ by their terminal amine moiety. Phleomycin and tallysomycin, which are structurally and biosynthetically related to Bm, are other antibiotics also produced by Streptomyces species. The Fe(II)-bound Bm complex, in conjunction with a reducing agent and oxygen, causes nucleotide sequence-specific DNA cleavage (3, 4). Bm has two domains that fulfill the following functions: (i) a metal-binding domain, which provides the coordination sites required for the Fe(II) complex formation, comprising β-aminoalanine, pyrimidinylpropionamide, and β-hydroxyhistidine moieties; and (ii) a DNA-binding domain composed of terminal amine and bithiazole moieties (Fig. 1). A mechanism involving the interaction of both the bithiazole moiety and the metal-binding domain of Bm with DNA has been suggested to underlie the sequence-specific recognition of DNA (5–7), and an “activated Bm” converted from a labile Fe(II)·Bm·O2 complex can degrade DNA (3, 4). In addition, recent studies have shown that Bm can cleave the unusual tertiary structures of RNA (8, 9).
FIGURE 1.

Chemical structure of a family of Bm and its related compounds. 1) bleomycinic acid; 2) BmA2; 3) BmB2; 4) phleomycin 12; 5) phleomycin D1.
Antibiotic-producing microorganisms must be protected from the lethal effects of their own products. We have previously cloned and sequenced two genes from Bm-producing S. verticillus ATCC15003, designated blmA and blmB, which confer resistance to Bm (10). BlmA has been shown to encode an acidic protein, designated BLMA, with a strong affinity to Bm (11). We have previously determined the crystal structures of BLMA both uncomplexed and complexed with Bm (12, 13). A blmA-like gene is present in the tallysomycin producer (14) as well as in other bacteria that do not produce any Bm-related compounds (11, 15). In addition, the Escherichia coli transposon Tn5 carries a gene (designated ble) that confers resistance to Bm. The ble gene product, BLMT, is a Bm-binding protein, as is BLMA. We have also determined the crystal structures of BLMT both uncomplexed and in a complex with Bm (16). Our crystallographic analyses of BLMA and BLMT have shown that Bm is accommodated in these proteins via a binding pocket formed at the dimer interface. Furthermore, the crystal structure of Bm bound to these proteins suggests that an axial ligand for metal ions is the primary amine of its β-aminoalanine moiety (13).
Another gene, blmB, encodes a Bm N-acetyltransferase, designated BAT, which inactivates Bm using acetyl-coenzyme A (AcCoA) (10). The site of acetylation in this case was determined to be the primary amine of the β-aminoalanine moiety in Bm, which is an axial ligand of the metal ion (17). The acetylated Bm had no detectable antibacterial activity, and it did not induce in vitro DNA degradation.
In our present study, we determined the crystal structure of BAT at 2.5-Å resolution. Moreover, we successfully determined the crystal structure of BAT complexed with Bm and CoA in addition to that of BAT complexed with CoA alone. Based on these crystal structures, we propose an enzymatic reaction mechanism that takes place among BAT, AcCoA, and Bm.
EXPERIMENTAL PROCEDURES
Gene Cloning, Expression, and Purification of BAT
The blmB gene was amplified by PCR from S. verticillus genomic DNA with the forward primer, 5′-GGAATTCCATATGACCGAACACCCGCGGGC-3′ (the underline indicates an NdeI site), and the reverse primer, 5′-CCGCTCGAGTCGGACAGGAGCGGACACG-3′ (the underline indicates an XhoI site). The amplified DNA was digested with NdeI and XhoI and inserted into the pET-21a(+) vector (Novagen) to generate a bacterial expression plasmid for BAT. This expression vector was introduced into the methionine-auxotroph E. coli B834(DE3)pLysS strain. To overproduce native BAT, these E. coli cells were grown at 28 °C in the Overnight Express Autoinduction System 2 (Novagen) medium containing 100 nm vitamin B12 and an accompanying methionine solution. To obtain selenomethionine-labeled BAT, the methionine solution was replaced with l-selenomethionine (125 μg/ml). Harvested cells (1 g wet weight) were suspended in 4 ml of lysis buffer (20 mm Tris-HCl, pH 7.6, 30 mm NH4Cl, 10 mm magnesium acetate, 1 mm dithiothreitol, and 1 mm EDTA) and sonicated on ice. The lysate was clarified by centrifugation and loaded onto a 15-ml blue Sepharose column (GE Healthcare). The protein trapped to the column was eluted with a linear gradient of 0–1 m NaCl. Fractions containing BAT were pooled and further purified using a 150-ml Sephacryl S-200HR gel filtration column (GE Healthcare) with a buffer consisting of 20 mm Tris-HCl, pH 7.6, 50 mm ammonium sulfate, 1 mm dithiothreitol, and 1 mm EDTA. The homogeneity of the protein was confirmed by SDS-PAGE. The presence of sulfate ions in the final buffer was effective for long-time storage of BAT. Sulfate ions were found to be bound to the accommodation site of the pyrophosphate moiety in AcCoA to stabilize the structure.
X-ray Crystallography
Prior to crystallization, BAT was concentrated to 10 mg/ml using Amicon Ultra (Millipore). Crystals of a substrate-free form of BAT were obtained in a microgravity environment created at the International Space Station. A crystallization box was launched with the spacecraft Progress, kept in space at 20 °C for about 4 months, and then returned to Earth in the Soyuz spacecraft. The crystals were obtained in a capillary using the gel-tube counterdiffusion method (18). Other crystals used in this study were obtained using the sitting-drop vapor diffusion method. Trigonal and orthorhombic crystals of binary complexes were grown at 4 °C in the presence of 1 mm CoA. Hexagonal crystals of a ternary complex were atypically obtained at 20 °C in the presence of 1 mm BmA2 and 1 mm CoA using a protein solution diluted to 6 mg/ml. For these crystals, the orthorhombic crystals of binary complexes and the hexagonal crystals of a ternary complex were prepared using selenomethionine-labeled BAT.
The diffraction intensities of the crystals were obtained using synchrotron radiation from the BL41XU or BL38B1 stations at SPring-8, Japan. The crystals were frozen under a nitrogen gas stream (100 K), and the diffraction intensities were integrated and scaled using HKL2000 (19). Reliable phases for the orthorhombic crystal of a binary complex were obtained using the SHARP program (20). Ten selenium sites of 16 were identified with CC (test) of 0.349, and a phase set with a mean figure-of-merit of 0.228 was obtained. The accuracy of the phases was improved to the mean figure-of-merit of 0.828 by density modification, and the resulting electron density map, visualized using Xfit from the XtalView software package (21), enabled us to build a partial model. This model was further refined with simulated annealing and conventional restrained refinement methods using the CNS program (22). A subset of 5% of the reflections was used to monitor the free R factor (Rfree) (23). Each refinement cycle includes the refinement of the positional parameters, individual isotropic B-factors, and revision of the model. The structure was completed through further rounds of manual model fitting. Other crystal structures were determined by molecular replacement using Amore from the CCP4 program suit (24) and refined by CNS. The details of the crystallization procedures, data collection, and refinement statistics are shown in Table 1.
TABLE 1.
Data collection and refinement statistics
| Data set | Substrate-free | Binary-1 | Binary-2 |
Ternary | ||
|---|---|---|---|---|---|---|
| Crystallization | ||||||
| Precipitant solution | 0.75% PEG400, | 1.3% PEG400, | 1.0% PEG400, | 4.0 m sodium formate, | ||
| 1.0 m (NH4)2SO4 | 1.35 m (NH4)2SO4 | 1.33 m (NH4)2SO4 | 0.1 m Hepes | |||
| 0.1 m Hepes | 0.1 m Hepes | 0.1 m Hepes | (pH 6.6) | |||
| (pH 7.5) | (pH 7.5) | (pH 7.5) | ||||
| Space group | P3121 | P3121 | P212121 | P6522 | ||
| Cell parameters | a = b = 101.3 Å, | a = b = 69.9 Å, | a = 69.2 Å, b = 96.3 Å, c = 181.4 Å | a = b = 70.1 Å, | ||
| c = 165.4 Å | c = 227.0 Å | c = 534.9 Å | ||||
| Data collection | ||||||
| Beam line | BL41XU | BL38B1 | BL41XU | BL38B1 | ||
| Wavelength (Å) | 1.00000 | 1.00000 | 0.97924 | 0.97942 | 0.96189 | 0.97908 |
| Resolution (Å) | 50-2.5 | 50-2.4 | 50-2.7 | 50-3.0 | 50-3.1 | 50-2.8 |
| Unique reflection | 27,705 | 24,752 | 33,968 | 25,204 | 23,162 | 19,449 |
| Redundancya | 3.2 (1.6) | 4.9 (4.8) | 7.7 (5.5) | 6.9 (5.8) | 6.5 (5.5) | 5.6 (5.0) |
| Completeness (%)a | 81.5 (57.2) | 94.4 (92.8) | 100 (99.9) | 99.9 (99.8) | 99.9 (99.8) | 93.8 (96.6) |
| Rmerge (%)a,b | 7.4 (27.1) | 6.6 (47.2) | 11.1 (40.7) | 13.1 (40.6) | 15.4 (42.9) | 12.6 (44.7) |
| I/σa | 11.7 (2.3) | 11.2 (2.1) | 14.6 (4.7) | 16.0 (4.8) | 12.5 (4.0) | 10.7 (2.1) |
| Refinement | ||||||
| Resolution (Å) | 30.0-2.5 | 30.0-2.4 | 30.0-2.7 | 30.0-2.8 | ||
| Used reflections | 27,662 | 20,889 | 31,720 | 16,399 | ||
| No. of atoms | ||||||
| Protein | 4,461 | 4,418 | 8,856 | 4,418 | ||
| Ligand (CoA and BmA2) | 0 | 96 | 96 | 240 | ||
| Solvent (water and sulfate) | 128 | 221 | 290 | 11 | ||
| R (%) | 21.1 | 21.3 | 19.1 | 20.7 | ||
| Rfree (%) | 27.2 | 28.7 | 25.7 | 25.8 | ||
| Root mean square deviationsc | ||||||
| Bond length (Å) | 0.006 | 0.008 | 0.007 | 0.007 | ||
| Bond angle (°) | 1.3 | 1.5 | 1.2 | 1.3 | ||
| Wilson B-factor (Å2) | 36.0 | 49.5 | 45.4 | 34.3 | ||
| Mean B-factor (Å2) | ||||||
| Protein | 44.5 | 48.5 | 34.4 | 27.5 | ||
| Ligand | 77.0 | 31.6 | 55.2 | |||
| Solvent | 36.6 | 40.8 | 28.7 | 8.1 | ||
a Values in parentheses are for the highest resolution bin.
bRmerge = Σ|I − I〈|/ΣI, where I is the observed intensity and 〈I〉 is the mean value of I.
c Values are calculated by CNS (22).
Activity Assay of BAT
In general, the acetyltransferase activity of BAT was measured using a continuous spectrophotometric assay involving the formation of a colored product (ϵ = 13,600 m−1 cm−1 at 412 nm) from the reaction of 5,5′-dithiobis(2-nitrobenzoic acid) with CoA, which is generated from AcCoA after transferring its acetyl group to Bm. Assays were performed in a final volume of 1.0 ml in a broad range buffer (50 mm 3,3-dimethylglutaric acid, 50 mm Tris, and 50 mm 2-amino-2-methyl-1,3-propandiol) adjusted at various pH, 1.0 mm EDTA, and 0.25 mm 5,5′-dithiobis(2-nitrobenzoic acid) at 30 °C. The given concentrations of AcCoA (5–400 μm) and BmA2 (0.4–100 μm) were added to the reaction mixture. The reaction was initiated with the addition of an appropriate amount of enzyme. The acetyltransferase activity of BAT was measured on the basis of the increase of the slope at 412 nm immediately after the addition of BAT.
Product Inhibition Studies
The catalytic activity of BAT was measured in the presence of CoA and acetylated BmA2 (AcBmA2). The AcBmA2 used in this study was chemically synthesized as described previously (25). Inhibition kinetic experiments were performed by varying the concentrations of one substrate at several different fixed concentrations of the inhibitor, with the other substrate kept at a constant concentration. The reaction progress was monitored at 412 nm as in a standard kinetic assay, except for the product inhibition experiment using CoA. The inhibition pattern for CoA was obtained by monitoring the decrease in the absorbance at 232 nm (Δϵ = 4,500 m−1 cm−1), due to breakage of the thioester bond of AcCoA.
Analysis of the Kinetic Data
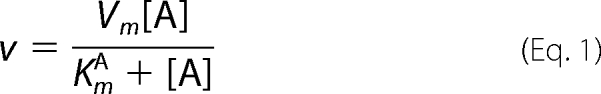
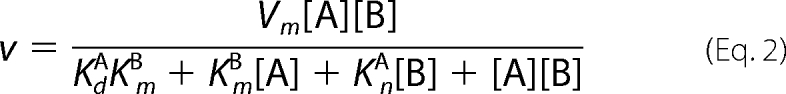
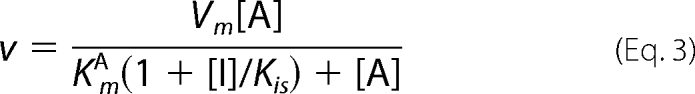
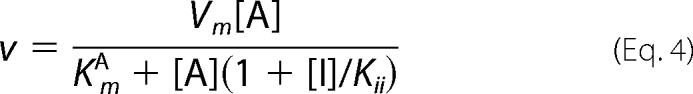
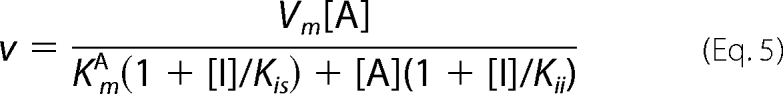
Data for the steady-state kinetics of BAT were fitted to Equation 1. Equation 2 was used to fit the initial velocity patterns. All inhibition study data were fitted to Equations 3–6 for competitive, uncompetitive, noncompetitive, and substrate inhibition, respectively.
 |
 |
 |
 |
 |
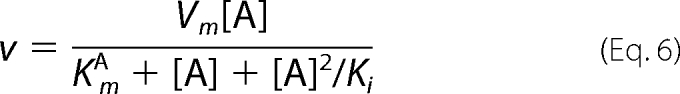 |
In all equations, v is the initial velocity, Vm is the maximum velocity, [A] and [B] are the substrate concentrations, [I] is the concentration of inhibitor, KmA and KmB are the corresponding Michaelis-Menten constants, KmA is the dissociation constant for A, Kis and Kii are the inhibition constants for the inhibitors, which are evaluated by replotting the slope or the intercept from double-reciprocal plots, respectively, versus the concentration of inhibitor, and Ki is the inhibition constant for the substrate inhibition, which is evaluated by the non-linear least square method.
RESULTS
Kinetic Study of BAT
As shown in Fig. 2A, BAT exhibited the maximal acetylating activity in the presence of 2 μm BmA2 and 400 μm AcCoA (= saturated concentration) at pH 7.5, but not virtually below pH 6.0. On the other hand, in the presence of 12 μm BmA2 and 400 μm AcCoA, the pH, which conferred the maximal activity, was 6.5. Moreover, the activity at 12 μm BmA2 was lower than that at 2 μm above pH 7 (Fig. 2A). This observation indicates that a higher concentration of BmA2 (12 μm) caused the substrate inhibition to BAT. As shown in Fig. 2B, we examined the Bm acetylating activity versus several concentrations of BmA2 in the presence of 400 μm AcCoA under different pH values (6.0, 6.5, and 7.0); the results indicated that the substrate inhibition of BAT by BmA2 occurs at these pH values. When a typical formula for the substrate inhibition (Equation 6) was applied to the data of BAT activity versus the concentration of BmA2 at pH 6.5, the Km and Ki values were calculated to be 1.3 and 19 μm, respectively. On the other hand, plots of the BAT activity versus the concentration of AcCoA exhibits typical Michaelis-Menten kinetics at various pH.
FIGURE 2.

Enzyme kinetic study of BAT. A, catalytic activity of BAT versus pH. The Bm-acetylating activity was measured in the presence of the given concentration of BmA2 (2 or 12 μm) under the saturated concentration of AcCoA (400 μm). B, catalytic activity of BAT versus the concentration of BmA2. The assay of BAT activity was conducted under the given pH values (6.0, 6.5, and 7.0) in the presence of 400 μm AcCoA. C, initial velocity pattern of BAT. The catalytic activity at pH 6 was obtained at the given concentrations of BmA2 (from 0.8 to 12.8 μm) with several fixed concentrations of AcCoA of 10, 20, and 40 μm. D, uncompetitive substrate inhibition by BmA2 with respect to AcCoA. The catalytic activity at pH 6.5 was obtained at the given concentrations of AcCoA (from 3.13 to 50 μm) with several fixed concentrations of BmA2 (12.5, 50, and 100 μm). Although each point in this figure corresponds to experimental data, the curves and lines are theoretically drawn.
Fig. 2B shows that the concentration of BmA2 giving the maximum activity of BAT is higher at pH 6.0 than 7.0. This indicates that both the Km and Ki values increase in accordance with the decrease of the enzyme reaction pH. This observation suggests that one ionizable group in Bm or BAT might be, at least, associated with the catalytic activity. Probably, Bm binds to BAT only when the ionizable group is deprotonated. The binding causes both the catalysis and inhibition to the enzyme. Based on this hypothesis, Km and Ki in Equation 6 were substituted to Km(1 + 10pKa-pH) and Ki(1 + 10pKa-pH), respectively, and the data obtained at pH 6–8 were fit to the equation. The Km and Ki values calculated that the ionizable group takes the deprotonated form were 0.16 and 3.6 μm, respectively, and the pKa was 7.5.
We subsequently investigated the kinetic mechanisms of BAT. Because the strong substrate inhibition to BAT catalysis occurs at alkaline pH, the enzyme reaction was conducted at pH 6.0. The initial velocity pattern of catalysis was examined using various concentrations of BmA2 at three fixed concentrations of AcCoA (10, 20, and 40 μm). The resulting double-reciprocal plots (Fig. 2C) exhibit intersecting lines for the enzymatic reactions, indicative of a sequential kinetic mechanism, either random or ordered. AcCoA and Bm would be bound to BAT prior to the formation and release of two enzymatic products (AcBmA2 and CoA). From the data analysis using Equation 2, the Km values for AcCoA and BmA2 at pH 6 were determined to be 12 and 11 μm, respectively.
The detailed kinetic mechanisms of an enzymatic reaction can be elucidated by determining the order of binding of substrates or release of enzymatic products. Analyses using product inhibitors are useful methods to evaluate whether the kinetic mechanism of enzymes is ordered or random, as well as to evaluate the binding order of substrates and the release order of the products. Hence, in our present study, inhibition studies with CoA and AcBmA2 were performed at pH 6. As a result, CoA was found to be a non-competitive inhibitor versus BmA2 (Kii = 80 μm, Kis = 45 μm) and a competitive inhibitor versus AcCoA (Kis = 35 μm). AcBmA2 was a non-competitive inhibitor versus AcCoA (Kii = 700 μm, Kis = 350 μm). However, it is difficult to determine whether AcBmA2 acts as a competitive or a non-competitive inhibitor, judging from the inhibition pattern of AcBmA2 versus BmA2. Because these results can be applied for both the ordered and random mechanisms, we cannot refer to the kinetic mode of BAT.
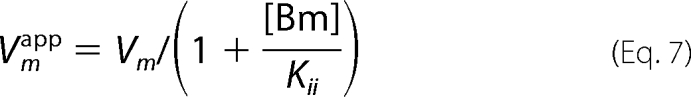
Fig. 2D shows that the kinetic experiments were conducted at pH 6.5 by varying the AcCoA concentrations at fixed concentrations of BmA2 (12.5, 50, and 100 μm). This figure demonstrates that BmA2 at the high concentration acts as an uncompetitive inhibitor (Kii = 28 μm) versus AcCoA. In other words, the apparent Vm and Km values can be represented by the following equations.
 |
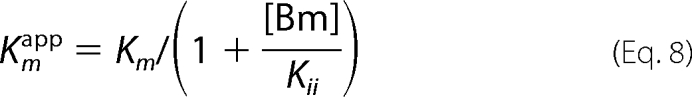 |
Furthermore, as discussed above, the Kii value in Equations 7 and 8 is dependent on the pH and decreased at higher pH. In fact, the apparent Vm and Km values, which were calculated from the plots of the BAT activity versus the concentration of AcCoA in the presence of 50 μm BmA2 at pH 6–9, decreased at higher pH values.
In summary, our present kinetic data strongly suggests that BAT takes an ordered mechanism, in which CoA is finally released from the enzyme. Furthermore, it is considered that substrate inhibition is caused by the formation of a dead-end ternary complex, BAT·CoA·Bm, which is formed by binding Bm to the binary BAT·CoA complex. With respect to the binding order of two substrates, we could not obtain a clear answer from the kinetic experiment.
Overview of the Tertiary Structure of BAT
A crystal of the substrate-free form of BAT grown in space clearly diffracts at a higher resolution (2.5 Å) than the control crystals grown on earth (3.0 Å). This improved resolution enabled us to refine the structure without the need to impose non-crystallographic symmetry restraints. We cannot conclude at this stage that a microgravity environment improves the BAT crystal quality due to the limited opportunity to use these conditions. The size of the crystal grown in space is about 0.06 × 0.06 × 0.5 mm, which is about 2-fold smaller in width than the crystals grown on earth. The small size might not be adequate to withstand long-term radiation, and data completeness is thus significantly low.
For the crystals formed using selenomethionine-labeled BAT, the diffraction intensity was measured at three wavelengths near the selenium K edge to determine the structure via the multiple wavelength anomalous dispersion method. However, we could obtain reliable phases only when using data generated from a orthorhombic crystal of a binary complex. The reason that we could not determine the phases from the hexagonal crystal of the ternary complex is possibly related to the remarkable cell length of the c-axis in this case, which makes it difficult to accurately measure the diffraction intensity. However, the diffraction data at a peak wavelength was used for structural refinement after solving the rotation and translation functions.
The tertiary structure of a BAT monomer is shown in Fig. 3A. The protein is composed of N- and C-terminal domains, as described below.
FIGURE 3.

Overall structure of BAT. Ribbon views of a monomeric (A) and a dimeric (B) form of BAT in the crystal structure of a ternary complex bound with two BmA2 and one CoA molecule. In A, the N- and C-terminal domains in a BAT monomer are shown in light-green and orange, respectively. The N and C termini are labeled, as well as the α-helices and β-strands. In B, each monomer forming a BAT dimer is shown in red and blue. A vertical line indicates the non-crystallographic symmetry axis relating two C-terminal domains in a dimer. C, superposition of one BAT monomer to its partner. Two monomers, colored in red and blue, are from the ternary complex. Residues in the C-terminal domain are maximally fitted.
N-terminal Domain
The N-terminal domain of BAT consists of residues Thr9 to Arg175 and forms an eight-stranded mixed β-sheet with five α-helices (Fig. 3A). The order of the strands in this domain is β1↑β2↓β3↑β4↓β5↑β6↑β8↓ β7↑. Three α-helices (α1–α3) connect the β2- and β3-strands. The α4 helix is positioned between the β5- and β6-strands, and α5 is present between the β6- and β7-strands. A segment connecting β2 and β3 and a loop between β7 and β8 are positioned on one side of the β-sheet. The residues linking β5 and β6 and those linking β6 and β7 are positioned on the other side of the β-sheet. These orientations form a tunnel structure through the N-terminal domain with a wide funnel-like entrance on one side (Fig. 4B). The tunnel structure on the opposite side is narrow (Fig. 4C).
FIGURE 4.

Molecular surface on a BAT dimer. A, overall view of the molecular surface. Positive and negative charges are shown in blue and red, respectively, and arrows indicate the directions of view for B and C. B, Bm-binding pocket comprised of a canyon-like groove formed by the interface of two C-terminal domains of BAT and funnel-like entrance of the tunnel formed in the N-terminal domain of BAT. The former and latter accommodate the DNA-binding and metal-binding domains of Bm, respectively. C, narrow entrance of the tunnel formed in the N-terminal domain, where the CoA molecule is inserted. D, side view of the tunnel in the N-terminal domain. The molecular slab including the tunnel is shown. The transparency of the surface is set to 70%.
C-terminal Domain
The C-terminal domain of BAT is comprised of residues Leu180 to Val301 and contains two similar βαβββ motifs (Fig. 3A). The order of strands in one βαβββ motif is β9(13)↑β12(16)↑β11(15)↓β10(14)↑. In a BAT dimer, a β9-strand from one monomer interacts in an anti-parallel manner to the β13-strand of the other (Fig. 3B). As a result, two eight-stranded β-sheets are formed by the interaction of two C-terminal domains of BAT. A loop connecting β14 and β15 in one monomer protrudes toward the other monomer, resulting in generation of two symmetrical canyon-shaped grooves at the dimer interface (Fig. 4B).
AcCoA-binding Site of BAT
In the orthorhombic crystal, only one CoA molecule for the BAT dimer was identified, whereas two CoA molecules for the dimer were observed in the trigonal crystal. CoA binds to the narrow entrance of a tunnel in the N-terminal domain with its thiol group reaching the midpoint of the tunnel. The nucleotide portion of CoA is extended outside the tunnel entrance and largely exposed to the bulk solvent. An examination of the electrostatic potential revealed a particularly basic region near the pyrophosphate and adenosine 3′-phosphate groups in CoA (Fig. 4C).
The quality of the electron density of CoA is reflected by the number of its interactions with BAT (Fig. 5A). Mercaptoethylamine, the pantothenate moieties, and the pyrophosphate group in CoA react with BAT by forming a large number of hydrogen bonds and van der Waals contacts. A linear part of CoA binds along the β5-strand and wedges between this strand and the β6-strand. The pantetheine moiety forms hydrogen bonds with the main chain atoms of Trp97 and Leu99. In addition, the side chains of Val40, Trp43, Trp44, Trp97, Leu98, Leu99, Trp104, and Ile133 contribute to the formation of a hydrophobic pocket suitable to accommodate the pantetheine moiety. The pyrophosphate group in CoA forms hydrogen bonds with the backbone amide groups of Gly105, His106, Gly107, Ala109, and Thr110 and with the side chains of Thr110, Arg139, and Arg146. The adenosine moiety in the CoA molecule is weakly defined in the electron density.
FIGURE 5.

Fo − Fc omit map of CoA (A) and BmA2 (B and C) and their surrounding residues. As shown in A, the linear part of a CoA molecule is inserted into the tunnel formed in the N-terminal domain of BAT, and its adenosine moiety is positioned at the narrow entrance of the tunnel. The DNA-binding domain of Bm is accommodated in the canyon-like groove formed by the interface of two C-terminal domains of BAT (C), whereas the metal-binding domain of Bm is bound to the funnel-like entrance of the tunnel and its β-aminoalanine moiety is deeply inserted into the tunnel (B). The carbon atoms from each monomer are shown in orange and cyan. The electron density was contoured at 3 σ (blue).
Bm-binding Site of BAT
In the ternary complex structure obtained by co-crystallization with CoA and BmA2, one CoA and two BmA2 molecules were observed to bind to a BAT dimer. The electron density of BmA2 (Fig. 5, B and C) is more weakly defined than that of CoA. As discussed above, the Km value of BAT for AcCoA is about 10 μm at pH 6. In addition, the strong substrate inhibition at alkaline pH decreases the apparent Km value. On the other hand, the Km value for BmA2 is dependent on the pH. The value was calculated to be ∼0.2 μm under alkaline pH. The strong binding affinity of BmA2 to BAT, suggested by the enzyme kinetic experiment, must therefore be derived from the broad contact area formed between BAT and BmA2. A Bm-binding site in BAT is extended from an N-terminal domain of one monomer to the dimer interface formed by the two C-terminal domains (Fig. 4B). In detail, a DNA-binding domain of Bm is accommodated in a canyon-like groove formed by the two C-terminal domains of BAT, where a bithiazole moiety of Bm is sandwiched (Fig. 5C). At one side of the bithiazole-binding groove, an indole ring of Trp280 from one monomer is positioned, whereas two benzene rings of Phe211 and Phe219 from the other monomer are present on the other side.
Metal-binding and sugar domains of Bm are bound to a funnel-like surface of the N-terminal domain of BAT (Fig. 4B). The pyrimidinylpropionamide and β-aminoalanine moieties of Bm enter deeply into the tunnel by forming a large number of van der Waals contacts with side chains of Trp44, Thr45, Leu87, Thr90, Trp132, and Tyr159 and hydrogen bonds with the side chains of Thr96 and Gln157.
Tertiary Structure of Bm Bound to BAT
The positional relationship between the N- and C-terminal domains differ between the monomers forming a BAT dimer (Fig. 3C). This may be due to weak interaction between the N- and C-terminal domains within the BAT monomer. In addition, this deviation must account for the fact that the efficiency of crystallization for BAT is low. As a result, one of the two N-terminal domains in the BAT dimer is positioned apart from the non-crystallographic 2-fold axis of the two C-terminal domains, whereas the other N-terminal domain approaches this 2-fold axis. This gives rise to the generation of asymmetricity in the entire BAT dimer (Fig. 3B). Moreover, domain analysis of the two BAT monomers forming a dimer using DynDom (26) indicates that the rotation angles for one domain after the superposition of the other differ among the obtained crystal structures (Table 2). Thus, the degree of asymmetricity in the BAT dimer is different among the obtained structures. Even in the ternary complex of BAT with CoA and BmA2, the shape of each Bm-binding pocket within the BAT dimer differs. The positional relationship between the metal-binding and DNA-binding domains is not consistent between two Bm molecules bound to BAT (Fig. 6, A and B), indicating that the Bm molecules adopt a conformation that reflects the different properties of the respective Bm-binding pockets. This is due to the fact that the connection between the bithiazole ring and the threonine moiety of Bm is flexible.
TABLE 2.
Difference of positional relationship of domains between two monomers forming dimer
| Dimer | Substrate-free (AB) | Binary-1 (AB) | Binary-2 (AB) | Binary-2 (CD) | Ternary (AB) |
|---|---|---|---|---|---|
| Root mean square deviation of whole monomer (Å) | 0.90 | 2.32 | 1.41 | 2.25 | 1.47 |
| Residues in hinge region | 120–121 | 173–174 | 174–182 | 174–176 | 175–180 |
| Rotation angle (°) | 6.4 | 19.4 | 12.8 | 20.9 | 13.9 |
| Root mean square deviation of pre-hinge domain (Å) | 0.53 | 0.38 | 0.30 | 0.33 | 0.34 |
| Root mean square deviation of post-hinge domain (Å) | 0.72 | 0.96 | 0.56 | 0.54 | 0.34 |
FIGURE 6.

Structures of Bm. The structures of Bm bound to BAT are shown in A and B, which correspond to those shown on the right and left in Fig. 3B, respectively. The structure of the Cu(II)-bound Bm complexed with BLMA is shown in C.
DISCUSSION
Tertiary Structure of BAT
A structural similarity search of proteins using the DALI program (27) suggests that the N-terminal domain of BAT is superimposed on proteins classified as a GCN5-related N-acetyltransferase (GNAT) (Fig. 7A). The N-terminal domain of BAT matches well with an acetyltransferase (Protein Data Bank code 2FSR), judging from the Z-score of 18.7. However, the former amino acid sequence shows a 29% identity with the latter one. The typical GNAT-fold is β-α-α-β-β-β-α-β-α-β (28, 29), which corresponds to β2-α1-α3-β3-β4-β5-α4-β6-α5-β8 in BAT. In the BAT N-terminal domain, an eight-stranded β-sheet is generated as a result of the addition of two β-strands (β1 and β7) to both edges of the core β-sheet. Moreover, a short helix, α2, is inserted between α1 and α3. In general, variations of the GNAT structure mostly occur at the corresponding residues connecting the β2- and β3-strands and α5 and β8 of BAT.
FIGURE 7.

Structural similarity. In A, the N-terminal domain of BAT, shown in red, is superimposed on the aminoglycoside N-6′-acetyltransferase type li (AAC(6′)-li) from Enterococcus faecium (Protein Data Bank code 1B87), shown in blue, as a representative GNAT superfamily protein. CoA and AcCoA, which are bound to the former and latter acetyltransferases, respectively, are indicated by the stick model. In B, to emphasize the difference of the binding mode of AcCoA and CoA, AAC(6′)-li is removed, and the N-terminal domain of BAT is shown as a ribbon. In C, a dimer formed by two C-terminal domains of BAT, shown in red, is superimposed on the dimer structure of BLMA, shown in blue. Two Bm molecules, which are bound to the former and latter dimers, respectively, are indicated by the stick model. In D, to emphasize the difference of binding mode of Bm, BLMA is removed, and the C-terminal domain of BAT is shown as a ribbon.
The GNAT superfamily of enzymes catalyzes the transfer of an acetyl group from AcCoA to a primary amine of a substrate. The SCOP data base (30) suggests that structures of more than 20 enzymes, including histone N-acetyltransferase and aminoglycoside N-acetyltransferase, can be classified into this family. The GNAT superfamily members, in general, adopt a dimer structure to function catalytically. However, a mycothiol synthase, MshD, produced by Mycobacterium tuberculosis (31), is catalytically active as a monomer. Because MshD harbors two repeats of a full-length GNAT domain, the monomer structure is effective catalytically as it takes a form that is similar to the dimeric forms of other GNAT proteins. The C-terminal domain of BAT is necessary for the formation of its dimeric state, whereas the two GNAT-like domains, which are present in the BAT dimer, do not mutually interact (Fig. 3B).
For most GNAT members, the active site is canyon-like to accommodate AcCoA at the bottom, whereas the longer loops in BAT close up the canyon and convert it into a tunnel-like structure (Fig. 4D). In comparison with the other GNAT family members, we show herein that the binding mode of the pantetheine domain of CoA to BAT is similar to that of other GNAT proteins (Fig. 7B). Most members of the GNAT family adopt a β-bulge structure at the middle of the β-strand, corresponding to β5 in BAT, and an acetyl moiety of AcCoA is closely positioned to this β-bulge. However, the β-bulge structure is not found in BAT. Furthermore, the CoA molecule bound to BAT takes an extended conformation, whereas the AcCoA molecules bound to other GNAT family proteins assume a conformation that is bent at the pyrophosphate moiety (Fig. 7B). The extended CoA bound to BAT is derived from a tunnel-like shape of the AcCoA-binding pocket of BAT. As a result, the adenine ring in CoA bound to BAT is exposed to the solvent, and the flexibility of the ring is greater than that of the ring bound to other GNAT proteins in which strong interactions between the protein and the ring restrict this flexibility.
On the other hand, a protein similarity search using the DALI program suggests that a number of proteins classified as members of the glyoxalase/bleomycin resistance protein/dioxygenase superfamily can be quite well superimposed onto the C-terminal domain of BAT (Fig. 7C). This superfamily includes a number of proteins with different functions, but all of them possess four βαβββ motifs, which are similar to one another, in one functional unit (32). For example, glyoxalase I and the Bm resistance protein, which have two βαβββ motifs in one monomer, adopt dimeric structures. Extradiol dioxygenase is a monomeric protein with four βαβββ motifs. Importantly, this superfamily also contains BLMA, which has a strong affinity to Bm produced by Bm-producing S. verticillus. The C-terminal domain of BAT is well superimposed on BLMA with a Z-score of 13.2, although the amino acid sequence of the C terminus exhibits a 20% identity with that of BLMA. In addition, the BLMA-encoding gene, blmA, is in a region adjacent to the BAT-encoding gene (blmB) (10). Both BLMA and BAT function as self-resistance determinants in the Bm producer.
The groove that accommodates the bithiazole moiety of the Bm molecule is also found in the crystal structures of BLMA and BLMT (13, 16). However, when the dimer structure of BAT was superimposed on that of BLMA, Bm was found to assume the opposite orientation between BAT and BLMA (Fig. 7D). Two concavities found on the molecular surface of the BLMA dimer were not present on the corresponding surface of the dimer structure formed by two C-terminal domains of BAT. We conclude from this that the difference in the orientation of Bm between both proteins is due to the absence of a concavity in the C-terminal domain of BAT.
The histone acetyltransferases HAT1 (33) and ESA1 (34) from yeast are GNAT proteins that carry another functional domain. BAT also carries another functional domain that is separate from the GNAT domain. From this structural information, it has been suggested that the primary function of the GNAT domain is to bind AcCoA. Indeed, the GNAT domain alone is sufficient to catalyze the N-acetylation of small size substrates, but, in this case, it needs to individually adopt the structure required to bind to the corresponding substrate (28, 29). On the other hand, to catalyze the N-acetylation of large size substrates, such as histone or Bm, a functional domain other than GNAT is indispensable.
Substrate Specificity of BAT
With respect to the structure of the metal-binding domain of Bm bound to BAT (Fig. 6, A and B), the equatorial ligands for the metal ion are separated from one another, suggesting that this conformation is distinguishable from that of the metal-bound complex (Fig. 6C). This is in contrast to previously obtained results, according to which BLMA accommodates both metal-free and metal-bound Bm and the conformation of metal-free Bm bound to BLMA is almost identical to that of the metal-bound form (13). These observations indicate that only BLMA can bind to activated metallo-Bm and thereby interfere with its DNA-degrading ability. In fact, BAT cannot catalyze the acetylation of Cu(II)-bound BmA2 and reacts only with the metal-free Bm, thus catalyzing the transfer of an acetyl group from AcCoA to the primary amine of Bm as a ligand of the metal. Because acetylated Bm no longer chelates the metal ion, its DNA-degrading activity is lost.
As shown in our previous report (35), neither bleomycinic acid nor phleomycin serve as substrates for BAT. The substrate specificity of BAT can be explained by the structural features of its canyon-like groove. In other words, when BAT recognizes its substrate, the electrostatic interaction between the negative-charge from Glu188 and positive charge on the terminal amine moiety of the substrate is important. Therefore, BAT cannot bind bleomycinic acid, which lacks a terminal amine moiety. The canyon-like groove adopts a structure that is sufficiently narrow to exclude the binding of phleomycin to BAT, in which a second thiazolium ring at the bithiazole moiety is reduced and nonplanar.
Catalytic Mechanism of BAT
The metal-binding domain of Bm is positioned on one side of the tunnel in the N-terminal domain of BAT (Fig. 4B), whereas the AcCoA-binding site is located on the other side of the tunnel (Fig. 4C). In a ternary complex of BAT with BmA2 and CoA, a thiol group of CoA is positioned near the primary amine of Bm at the midpoint of the tunnel (Fig. 4D). This proximity ensures the efficient transfer of an acetyl group from AcCoA to the primary amine of Bm. It has been suggested that, for the GNAT family of proteins, transfer of an acetyl group occurs by a direct nucleophilic attack of the substrate amino group to the AcCoA thioester carbon via formation of the ternary enzyme-substrate complex formed by simultaneous binding of two substrates (36–38). Our present structural and kinetic studies strongly indicate that the acetyl group-transferring reaction of BAT also occurs via the ternary enzyme-substrate complex.
Because the pKa values for the alkyl-amines are in the basic range (>9.5), the amino group of the substrate must be deprotonated to act as an effective nucleophile. The amino group of the substrate bound to the GNAT proteins is deprotonated by direct proton abstraction by an Asp or a Glu residue (39) or by proton abstraction through a series of hydrogen-bonded water molecules that, together, form a “proton wire” (40–42). A model of the ternary complex of BAT does not show the presence of any nearby residues that could directly function as a general base. However, it should be noted that the region surrounding the amino group of Bm is predominantly non-polar. In other words, extensive burial of a protonated amino group in the middle of the tunnel would be accompanied by a significant desolvation cost. No salt-bridge interactions are formed within the tunnel to offset this. Therefore, the hydrophobic environment observed at the entrance of the tunnel decreases the pKa of the primary amine of Bm. Only the deprotonated form is buried deeply in the tunnel and acts as an effective nucleophile.
We suggest that one ionizable group with a pKa of about 7.5 must be relevant to the catalytic activity of BAT. At present, we speculate that the ionizable group is the amino group of BmA2. The protonated form of Bm is expected to exhibit lower affinity to Fe(II) than the deprotonated form. In other words, BAT serves to the deprotonated form of Bm as a lethal substance for a Bm-producing microorganism.
Proposal of a Kinetic Mechanism for BAT Based on Its Crystal Structure
On the ordered mechanism, in general, binding of the first substrate to an enzyme gives rise to an increment of the binding affinity for the second substrate. To form the ternary complex of enzyme with two substrates, binding of the second substrate to the enzyme generally occurs after binding of the first substrate. After the enzyme reaction, a product from the second substrate is first released, and the other product from the first substrate is subsequently released.
The present kinetic study suggests that BAT takes an ordered kinetic mode, in which CoA is released at the end; however, we could not determine the binding order of two substrates due to the experimental difficulty. According to the general consideration, if BAT took a strict ordered mode with AcCoA as the first substrate, a BAT·Bm binary complex would not be generated. However, in the crystal structure of the ternary complex, one of two tunnels seen in the BAT dimer accommodates only Bm, whereas the other tunnel accommodates both Bm and CoA. In other words, the binding order of the two substrates might be flexible.
A comparison of the two monomers forming a BAT dimer in the substrate-free form indicates that the positional relationship between two subdomains in the N-terminal domain, which are separated by the loop between α4 and β6, is mutually different (Fig. 8A). The hinge region of this dimer is predicted by DynDom analysis to be a loop between α4 and β6 rather than between the N- and C-terminal domains (Table 2). These results suggest that the size of the substrate-binding tunnel traversing the N-terminal domains is distinguishable between the two monomers in the substrate-free dimer (Fig. 8, B and C). The large and small tunnel holes, depicted at the center of the models in Fig. 8, B and C, may correspond to the open and closed forms, respectively. The open formed tunnel is only seen in one N-terminal domain of the substrate-free BAT dimer. However, in solution, equilibrium between the open and closed conformations is expected to be maintained in the absence of AcCoA and/or Bm.
FIGURE 8.

Open and closed conformations of the N-terminal domain of BAT found in the crystal structure of the substrate-free form. A, open and closed conformations are indicated in blue and red, respectively. Two N-terminal domains are superimposed as residues from Asp127 to Arg175 are maximally fitted. The molecular surface of open and closed conformations is shown in B and C, respectively.
Because the tunnel accommodates both AcCoA and Bm, binding of either of these molecules may induce the conformational change toward the closed form. This conformational change may increase the binding affinity of BAT for another substrate.
On the other hand, the release of two enzyme products, such as CoA and AcBm, was found to be strictly ordered. Because the CoA molecule, except its adenosine moiety, is deeply inserted into the tunnel, it is difficult for the molecule to be released first. Instead, AcBm, which is bound only on the surface of BAT, is first released from the ternary BAT·AcBm·CoA complex. After the release of AcBm, a conformational change of BAT toward the open form is induced. However, due to numerous van der Waals contacts between CoA and BAT, the conformational change occurs slowly. Therefore, liberation of CoA from BAT is difficult even for the binary complex. If Bm is in a high concentration, the dead-end ternary complex, BAT·Bm·CoA, is formed. As a result, substrate inhibition might be involved.
Acknowledgments
We are grateful to the beam-line staff at SPring-8, Japan, for their kind help with x-ray data collection and Dr. M. Maruyama, H. Yoshitsu, and H. J. Jeon in our laboratory for technical assistance. We are also grateful to the Japan Aerospace Exploration Agency (JAXA) for the crystallographic experiment in space.
This work was supported by a grant from the National Project on Protein Structural and Functional Analyses, Japan (to M. S.), and a grant-in-aid for Scientific Research from the Ministry of Education, Science, and Culture of Japan (to Y. M.).
The atomic coordinates and structure factors (codes 2ZW4, 2ZW5, 2ZW6, and 2ZW7) have been deposited in the Protein Data Bank, Research Collaboratory for Structural Bioinformatics, Rutgers University, New Brunswick, NJ (http://www.rcsb.org/).
- Bm
- bleomycin
- AcCoA
- acetyl-CoA
- BAT
- bleomycin N-acetyltransferase
- GNAT
- GCN5-related N-acetyltransferase.
REFERENCES
- 1.Blum R. H., Carter S. K., Agre K. (1973) Cancer 31, 903–914 [DOI] [PubMed] [Google Scholar]
- 2.Umezawa H. (1974) Fed. Proc. 33, 2296–2302 [PubMed] [Google Scholar]
- 3.Burger R. M., Peisach J., Horwitz S. B. (1981) J. Biol. Chem. 256, 11636–11644 [PubMed] [Google Scholar]
- 4.Stubbe J., Kozarich J. W. (1987) Chem. Rev. 87, 1107–1136 [Google Scholar]
- 5.Carter B. J., de Vroom E., Long E. C., van der Marel G. A., van Boom J. H., Hecht S. M. (1990) Proc. Natl. Acad. Sci. U.S.A. 87, 9373–9377 [DOI] [PMC free article] [PubMed] [Google Scholar]
- 6.Kane S. A., Natrajan A., Hecht S. M. (1994) J. Biol. Chem. 269, 10899–10904 [PubMed] [Google Scholar]
- 7.Wu W., Vanderwall D. E., Turner C. J., Kozarich J. W., Stubbe J. (1996) J. Am. Chem. Soc. 118, 1281–1294 [Google Scholar]
- 8.Magliozzo R. S., Peisach J., Ciriolo M. R. (1989) Mol. Pharmacol. 35, 428–432 [PubMed] [Google Scholar]
- 9.Carter B. J., Murty V. S., Reddy K. S., Wang S. N., Hecht S. M. (1990) J. Biol. Chem. 265, 4193–4196 [PubMed] [Google Scholar]
- 10.Sugiyama M., Thompson C. J., Kumagai T., Suzuki K., Deblaere R., Villarroel R., Davies J. E. (1994) Gene 151, 11–16 [DOI] [PubMed] [Google Scholar]
- 11.Sugiyama M., Kumagai T., Matsuo H., Bhuiyan M. Z., Ueda K., Mochizuki H., Nakamura N., Davies J. E. (1995) FEBS Lett. 362, 80–84 [DOI] [PubMed] [Google Scholar]
- 12.Kawano Y., Kumagai T., Muta K., Matoba Y., Davies J., Sugiyama M. (2000) J. Mol. Biol. 295, 915–925 [DOI] [PubMed] [Google Scholar]
- 13.Sugiyama M., Kumagai T., Hayashida M., Maruyama M., Matoba Y. (2002) J. Biol. Chem. 277, 2311–2320 [DOI] [PubMed] [Google Scholar]
- 14.Gatignol A., Durand H., Tiraby G. (1988) FEBS Lett. 230, 171–175 [DOI] [PubMed] [Google Scholar]
- 15.Kumagai T., Nakano T., Maruyama M., Mochizuki H., Sugiyama M. (1999) FEBS Lett. 442, 34–38 [DOI] [PubMed] [Google Scholar]
- 16.Maruyama M., Kumagai T., Matoba Y., Hayashida M., Fujii T., Hata Y., Sugiyama M. (2001) J. Biol. Chem. 276, 9992–9999 [DOI] [PubMed] [Google Scholar]
- 17.Sugiyama M., Kumagai T., Shionoya M., Kimura E., Davies J. E. (1994) FEMS Microbiol. Lett. 121, 81–85 [DOI] [PubMed] [Google Scholar]
- 18.Garcia-Ruíz J. M., Gonzalez-Ramirez L. A., Gavira J. A., Otálora F. (2002) Acta Crystallogr. Sect. D Biol. Crystallogr. 58, 1638–1642 [DOI] [PubMed] [Google Scholar]
- 19.Otwinowski Z., Minor W. (1997) Methods Enzymol. 276, 307–326 [DOI] [PubMed] [Google Scholar]
- 20.de la Fortelle E., Bricogne G. (1997) Methods Enzymol. 276, 472–494 [DOI] [PubMed] [Google Scholar]
- 21.McRee D. E. (1992) J. Mol. Graph. 10, 44–46 [Google Scholar]
- 22.Brünger A. T., Adams P. D., Clore G. M., DeLano W. L., Gros P., Grosse-Kunstleve R. W., Jiang J. S., Kuszewski J., Nilges M., Pannu N. S., Read R. J., Rice L. M., Simonson T., Warren G. L. (1998) Acta Crystallogr. Sect. D Biol. Crystallogr. 54, 905–921 [DOI] [PubMed] [Google Scholar]
- 23.Brünger A. T. (1992) Nature 355, 472–475 [DOI] [PubMed] [Google Scholar]
- 24.Collaborative Computational Project Number 4 (1994) Acta Crystallogr. Sect. D Biol. Crystallogr. 50, 760–76315299374 [Google Scholar]
- 25.Oppenheimer N. J., Rodriguez L. O., Hecht S. M. (1979) Biochemistry 18, 3439–3445 [DOI] [PubMed] [Google Scholar]
- 26.Hayward S., Berendsen H. J. C. (1998) Proteins 30, 144–154 [PubMed] [Google Scholar]
- 27.Holm L., Sander C. (1993) J. Mol. Biol. 233, 123–138 [DOI] [PubMed] [Google Scholar]
- 28.Vetting M. W., S. de Carvalho L. P., Yu M., Hegde S. S., Magnet S., Roderick S. L., Blanchard J. S. (2005) Arch. Biochem. Biophys. 433, 212–226 [DOI] [PubMed] [Google Scholar]
- 29.Dyda F., Klein D. C., Hickman A. B. (2000) Annu. Rev. Biophys. Biomol. Struct. 29, 81–103 [DOI] [PMC free article] [PubMed] [Google Scholar]
- 30.Murzin A. G., Brenner S. E., Hubbard T., Chothia C. (1995) J. Mol. Biol. 247, 536–540 [DOI] [PubMed] [Google Scholar]
- 31.Vetting M. W., Roderick S. L., Yu M., Blanchard J. S. (2003) Protein Sci. 12, 1954–1959 [DOI] [PMC free article] [PubMed] [Google Scholar]
- 32.Bergdoll M., Eltis L. D., Cameron A. D., Dumas P., Bolin J. T. (1998) Protein Sci. 7, 1661–1670 [DOI] [PMC free article] [PubMed] [Google Scholar]
- 33.Dutnall R. N., Tafrov S. T., Sternglanz R., Ramakrishnan V. (1998) Cell 94, 427–438 [DOI] [PubMed] [Google Scholar]
- 34.Yan Y., Barlev N. A., Haley R. H., Berger S. L., Marmorstein R. (2000) Mol. Cell 6, 1195–1205 [DOI] [PubMed] [Google Scholar]
- 35.Matsuo H., Mochizuki H., Davies J., Sugiyama M. (1997) FEMS Microbiol. Lett. 153, 83–88 [DOI] [PubMed] [Google Scholar]
- 36.De Angelis J., Gastel J., Klein D. C., Cole P. A. (1998) J. Biol. Chem. 273, 3045–3050 [DOI] [PubMed] [Google Scholar]
- 37.Tanner K. G., Langer M. R., Denu J. M. (2000) Biochemistry 39, 11961–11969 [DOI] [PubMed] [Google Scholar]
- 38.Tanner K. G., Langer M. R., Kim Y., Denu J. M. (2000) J. Biol. Chem. 275, 22048–22055 [DOI] [PubMed] [Google Scholar]
- 39.Trievel R. C., Rojas J. R., Sterner D. E., Venkataramani R. N., Wang L., Zhou J., Allis C. D., Berger S. L., Marmorstein R. (1999) Proc. Natl. Acad. Sci. U.S.A. 96, 8931–8936 [DOI] [PMC free article] [PubMed] [Google Scholar]
- 40.He H., Ding Y., Bartlam M., Sun F., Le Y., Qin X., Tang H., Zhang R., Joachimiak A., Liu J., Zhao N., Rao Z. (2003) J. Mol. Biol. 325, 1019–1030 [DOI] [PubMed] [Google Scholar]
- 41.Hickman A. B., Namboodiri M. A., Klein D. C., Dyda F. (1999) Cell 97, 361–389 [DOI] [PubMed] [Google Scholar]
- 42.Vetting M. W., Hegde S. S., Javid-Majd F., Blanchard J. S., Roderick S. L. (2002) Nat. Struct. Biol. 9, 653–658 [DOI] [PubMed] [Google Scholar]