

Abstract
Eukaryotic gene expression is controlled at the post-transcriptional level by small noncoding RNAs called microRNAs (miRNA). miRNAs play important roles during early development and participate in gene regulatory circuits in the cell. Different high-throughput expression analysis methods including microarrays, bead-based detection, and small RNA cloning have been applied to quantitatively detect miRNAs in various tissues, cell types, and biological conditions. High-throughput expression data was collected from public repositories and processed to create a database of miRNA expression profiles. Several commonly used normalization methods were compared to identify suitable methods for cross-platform comparison of high-throughput miRNA expression data. The database provides interlaboratory and interplatform validated reference expression levels for miRNAs. The normalized expression profiles were validated by querying for well-established features of miRNA expression. Firstly, expression profiles of several tissue-specific miRNAs showed good agreement between the database and previously reported profiles. We have also identified a set of miRNAs that are constitutively expressed across mammalian tissues. Secondly, we used the database to compare the expression patterns of miRNAs belonging to the let-7 family, where the divergence in expression patterns implies that they may have diversified functionally. Lastly, we compared expression profiles of intronic and clustered miRNAs. Expression profiles of intronic miRNAs and clustered miRNAs showed either very good, or in certain cases, very poor correlation with the host gene. Interplatform comparison of miRNA expression profiles thus provides a resource of consensus expression profiles that can be used in the future for studying miRNA function and regulation.
Keywords: microarray, microRNA, expression, meta-analysis, cluster
INTRODUCTION
miRNAs are small noncoding RNA molecules, about 21–23 nucleotides (nt) in length, that negatively influence post-transcriptional expression of target genes bearing partial complementary regions in their 3′UTR, in eukaryotic cells (Bartel 2004). Several miRNAs are expressed in specific spatio-temporal patterns during development (Krichevsky et al. 2003) and in adult tissues (Liang et al. 2007). Aberrant expression of miRNAs has been reported in several cancers, leading to the suggestion that they could act as biomarkers (Cummins and Velculescu 2006). Expression patterns of miRNAs are important in the discovery of biomarkers, functional characterization of miRNAs, and in the study of gene regulation in development and disease. Due to the importance of miRNA expression patterns, many platforms have been developed for rapid high-throughput expression profiling of miRNAs (Castoldi et al. 2006; Wang et al. 2007; Chen et al. 2008). However, the expression profiles generated by these methods have not been compared. In the past, comparison of mRNA microarray data has helped in generating valuable reference expression profiles (Shi et al. 2005; Chen et al. 2007).
miRNA encoding regions fall within exons and introns of protein-coding genes, noncoding transcripts, and repetitive elements. The vast majority of miRNAs are transcribed by RNA polymerase II (Kim and Kim 2007). An unusual cluster of Alu repeat-associated miRNAs originally believed to be transcribed by RNA polymerase III (Borchert et al. 2006) has been recently shown to arise from a RNA polymerase II-transcribed noncoding RNA (Bortolin-Cavaille et al. 2009). miRNA genes give rise to long transcripts called pri-miRNA that are capped and polyadenylated (Kim 2005). Each pri-miRNA is cleaved by the heterodimeric RNase III enzyme complex, Drosha: DGCR8 in the nucleus (Lee et al. 2003; Denli et al. 2004; Han et al. 2004; Landthaler et al. 2004). The resulting precursor, called pre-miRNA, is transported into the cytoplasm by Exportin5 (Yi et al. 2003; Bohnsack et al. 2004; Lund et al. 2004) and subsequently cleaved by the cytoplasmic RNase III, Dicer, to release double-stranded RNA molecules (Bernstein et al. 2001; Hutvagner et al. 2001; Ketting et al. 2001). The RNA molecules in this duplex can bind to Ago proteins within multiprotein complexes called miRNP (Mourelatos et al. 2002). Mechanisms proposed (Tomari and Zamore 2005; Pillai et al. 2007) for the inhibitory effect of miRNPs on the translation from target mRNAs include (1) translational block or interference in functioning of the ribosomal machinery (Humphreys et al. 2005; Petersen et al. 2006); (2) destabilization of the target through deadenylation (or cleavage in case of perfectly complementary targets) (Giraldez et al. 2006; Wu et al. 2006); and (3) sequestration of mRNAs in subcellular sites (Liu et al. 2005; Bhattacharyya et al. 2006).
miRNA expression profiling methods measure the expression level of functional and mature miRNAs, distinguishing them from precursor molecules and highly homologous isoforms. Three major technologies used for miRNA expression profiling include bead-based expression profiling, miRNA microarrays, and small RNA cloning. miRNA-microarray platforms incorporate different design strategies to improve the specificity of the probes. These include locked nucleic acid-based probes (Castoldi et al. 2006) and an extended loop and 5′G to capture 3′C introduced into miRNAs during labeling in miRNA arrays (Wang et al. 2007). Although there exists a large body of data from miRNA expression profiling studies in public repositories, typically an experimentalist has to use tedious low-throughput methods like Northern blotting to establish the expression pattern of a specific miRNA of interest. While there are online resources for miRNA sequences (Griffiths-Jones et al. 2006) and computationally predicted miRNA-target pairs (John et al. 2004; Krek et al. 2005; Wang et al. 2007), miRNA expression information remains largely inaccessible.
Tissue-specific expression of a few miRNAs has been revealed by high-throughput experimental analysis using several approaches (Lagos-Quintana et al. 2002; Liu et al. 2004; Lu et al. 2005; Nelson et al. 2004; Baskerville and Bartel 2005; Mineno et al. 2006; Nakano et al. 2006). However, there has not been any systematic comparison of miRNA expression profiles generated by different platforms. Recently, normalization methods originally developed for mRNA expression profiling have been evaluated for miRNA data generated using the Agilent platform (Pradervand et al. 2009). Beside this, there have been no comprehensive studies on interlaboratory and interplatform comparison of miRNA expression profiles.
Here we have normalized and scaled expression data from high-throughput studies from different laboratories to create a compendium of miRNA expression profiles for mouse and human tissues, cell lines, cancer samples, and developmental stages. We have compared normalization methods to identify methods suitable for normalization of miRNA data. Tissue-specific miRNA expression patterns, in agreement with previously reported profiles and novel expression patterns, were found. Our analysis also identified 18 constitutively expressed miRNAs. We have also explored coregulation of intronic miRNAs arising from the same parent transcript and coordinated regulation of miRNA and mRNA transcripts. To our knowledge, this is the first attempt at comparing miRNA expression profiles from different platforms and deriving consensus expression profiles.
RESULTS AND DISCUSSION
We collected high-throughput experimental data on expression profiling of miRNAs from public microarray data repositories like Gene Expression Omnibus (GEO) (Edgar et al. 2002; Barrett et al. 2007) and Array Express (Parkinson et al. 2007). The experiments include several tissue-specific expression profiling studies using, different platforms, on cancer biopsy samples and developmental stages (summarized in Supplemental Table S1). The platforms include bead-based study and microarray platforms developed by different laboratories. Small RNA cloning and RNA-seq studies were not included, since there are very few studies using these techniques. Each data set was processed through a series of steps summarized in the flowchart provided in Figure 1. Datasets providing only relative fold change values derived from comparison with reference samples were not used, since this data is fundamentally different from expression level measurement and not suitable for comparison with other datasets. The data was subjected to a series of quality control checks to ensure that datasets with a majority of undetected spots were excluded. If the reported data was already background corrected, the data was used directly. In datasets not corrected for background, the median value of background intensities was subtracted from feature intensity. Negative values were substituted with null values and, subsequently, all null values were replaced with imputed values. KNNimpute, based on imputation of expression levels of similar miRNAs, was found to be more suitable than other methods that use mean or median (Troyanskaya et al. 2001). The low number of replicates in most datasets renders mean and median measurements unreliable for imputation. If it had not been done previously, the data were linearized using log transformation, before normalization.
FIGURE 1.

A flowchart summarizing the steps carried out to generate the normalized data.
The number of miRNAs in miRNA–microarray experiments is low, typically in hundreds, compared with a few thousands of genes measured in conventional gene expression profiling. Moreover, there is a greater diversity of gene expression profiling platforms already used in miRNA profiling: bead-based methods, massively parallel signature sequencing, and oligonucleotide arrays. Both of these factors can influence the suitability of conventional normalization methods. We investigated the suitability of several normalization methods in order to choose the method most suitable for pre-processing gene expression profiles, giving preference to measures of normalization that are independent of other datasets, since such a strategy would enable a one-time, internal normalization of each data set, irrespective of subsequent addition of newer datasets. From our total set of 1507 experiments spanning 18 datasets, we selected a subset suitable for testing normalization methods. This subset included miRNA expression profiles of six experiments (two bead-based studies and four microarray studies) corresponding to prostate tissue and four (one bead-based study and three microarray studies) related to brain tissue. The prostate datasets included two studies on a PC3 cell line that is derived from prostate cancer. The un-normalized expression values showed large differences between different methods and laboratories. In both prostate and brain datasets, normalization to mean (Fig. 2) or median (data not shown) had comparable effect. The data set after normalization had comparable central tendency, but the spread of the data was highly variable. Constitutive genes have earlier been used for normalization of gene expression profiles. Since they are measured during the experiment, they serve as internal controls in quantitating expression. A recent attempt to compare normalization methods for miRNA data generated using Agilent microarrays also reported that miRNAs based on invariant normalization performed better than other normalization methods. We used a mean of the expression levels of a set of 16 miRNAs that showed minimum variability in these datasets, as a normalization factor. This method of normalization was reasonably successful in comparing datasets generated using the same platforms. However, normalization using constitutive miRNAs was ineffective when comparing bead-based and microarray-based datasets. Quantile normalization and Z scores were both successful in transforming the data sets generating comparable means and scale. The normalization factors in mean, median, invariant, and quantile-based normalization are derived from multiple datasets. Consequently, addition of new datasets alters the normalized values of the existing datasets, making it difficult to create databases of prenormalized expression profiles. However, Z scores, unlike other normalization methods, are not influenced by the addition of new datasets. We normalized log-transformed data from all of the datasets using the Z score method for further studies. A database of Z scores from miRNA expression studies in zebrafish, Arabidopsis, mouse, and human—miRex (miRNA expression; http://miracle.igib.res.in/mirex/datasets.html)—has been constructed by our group. Z scores of 1507 experiments spanning 18 datasets used in this study are available through miRex.
FIGURE 2.

The box plots were generated using a subset of normalized data. Four brain samples and six PC3 and prostate samples were selected from bead-based (B1, B2) and oligonucleotide microarray studies (M1–M4). The distribution of log transformed un-normalized values (A), mean normalization (B), quantile normalization (C), normalization with respect to mean expression level of sixteen constitutive miRNAs (D), Z score normalization (E) is shown.
The Z score provides a mean-centered rank for the expression level in units of standard deviation (Cheadle et al. 2003). The expression levels are represented in terms of ranked normalized data. Z scores have been used previously by our group and others to compare data between experiments. This method is specially suited for database development, since the internally normalized values do not change with subsequent addition of new datasets. We internally normalized log-transformed intensity values by centering them to the respective averages. The Z scores thus provide an index of the expression level of the miRNA with respect to the cellular pool of miRNA and allow classification of miRNA with respect to their basal and tissue-specific expression levels. The Z score expression levels, expressed in terms of ranks, cannot be used directly to calculate fold change between samples. We calculated Z ratios, the equivalent of fold changes from Z scores, to overcome this limitation. miRNAs up-regulated in a certain tissue were identified using the average of Z scores from replicates of that tissue as the “test” value and the average expression profile of all of the other conditions/tissues as the “control” value. A Z ratio of 1.96, corresponding to 95% confidence interval (P-value < 0.05) (Cheadle et al. 2003), was used as a cutoff to identify tissue-specific miRNAs. We validated this approach of comparing normalized miRNA expression profiles by looking for the Z ratios for miRNAs widely acknowledged to be tissue specific. In a majority of cases, our results agree with the reported literature (Table 1). The expression of many of these tissue-specific miRNAs was also reflected in cell lines derived from these tissues; for instance, hsa-miR-15b and hsa-miR-19b were found in MCF7 cell line and breast carcinoma tissue in high levels. However, the larger number of conditions available in miRex allowed us to expand the expression profiles of some miRNAs reported to be tissue specific. For instance, hsa-miR-92 identified in a screen for fetal liver-specific miRNA (Fu et al. 2005) was found to be constitutively expressed at high levels in all conditions using miRex. On the other hand, we found that hsa-miR-133a was expressed in the heart at levels higher than the widely studied heart-specific miRNA, hsa-miR-1, thus offering a better tissue-specific miRNA signature (Lagos-Quintana et al. 2002). hsa-miR-155, previously reported to be CLL specific (Eis et al. 2005), was found at high levels in normal blood samples studied by different groups. Figure 3A provides an overview of tissue-specific expression profiles of miRNAs, newly identified in miRex. In agreement with independent experimental findings in mouse (Mishima et al. 2008), the microRNA hsa-miR-125b is amongst the most highly expressed miRNAs in testis and ovary. Interestingly, miR-125b, miR-99a, and let7c arise from the same transcript, but do not show similar expression profiles. Both miR-125b and miR-99a are expressed highly in the ovary, while let7c, in agreement with its role in neurogenesis (Wulczyn et al. 2007), is expressed highly in the fetal brain. We used Z scores to study expression profiles of miRNAs arising from genomic loci in close proximity to each other (described later) (Supplemental File 1). A subset of miRNAs (from Fig. 3A) showing high Z scores in many tissues is shown in Figure 3B. The heterogeneity of cell types in certain tissue samples like liver, lung, and blood could result in overlap with cell-type expression profiles. For instance, hsa-miR-223 reported to be expressed highly in macrophages and granulocytes (Chen et al. 2004) was also found in lung, liver, and spleen samples.
TABLE 1.
Previously reported tissue-specific miRNAs and respective Z ratios found in our study

FIGURE 3.

(A) Tissue-specific expression profiles of miRNAs based on Z ratios calculated as described in the Mterials and Methods section. The red boxes signify a z ratio of >1.96, which corresponds to a P-value of <0.05 for tissue-specific expression. (B) A subset of the miRNAs in A show a high basal level of expression across different tissues.
Although there are several reports of tissue-specific miRNAs, there have been very few reports of constitutively expressed miRNAs. We calculated averages of Z scores of data from different laboratories to derive interlaboratory validated miRNA expression profiles for various tissues. Subsequently, we clustered miRNAs according to their expression profiles in various tissues using Self Organizing Maps (Fig. 4A; Tamayo et al. 1999b). We used coefficient of variation as a measure of fluctuation in expression of miRNAs in different tissues. The miRNAs with the lowest coefficient of variation were identified. The expression profiles of these miRNAs show that constitutive miRNAs with invariant low and high levels exist (Fig. 4B).
FIGURE 4.

(A) Cluster of 130 miRNA expression profiles across 23 different tissues. Z scores for miRNA expression profiles were calculated as described in Materials and Methods. Average Z scores were calculated wherever multiple replicates of the same sample were available. Clustering was performed using Self Organizing Maps. (B) Identification of constitutive miRNAs. Coefficient of variation for Z scores of each miRNA was calculated. miRNAs with <0.65 CV were selected, and their expression profiles visualized by generating a heatmap of Z scores of 23 tissues.
Recently, Liang et al. (2007) have identified universally expressed microRNAs using real time PCR-based measurement of 345 miRNAs in 40 tissues. We compared the constitutively expressed miRNAs identified in our study with those reported in two previous experimental studies (Supplemental Table 2; Liang et al. 2007; Peltier and Latham 2008). The miRNAs identified in each study had low coefficient of variation, with four miRNAs, hsa-miR-92, hsa-miR-93, hsa-miR-191, and hsa-miR-103 being identified in multiple studies, including our own. It has been suggested that these miRNAs maybe involved in regulation of constitutive metabolic functions. We noticed that several constitutively expressed miRNAs, for instance, hsa-miR-23b, hsa-miR-26a, hsa-miR-92, and hsa-miR-18a, have been shown to occur at fragile sites in genomic regions involved in cancer (Calin et al. 2004). Beside metabolic functions, constitutive miRNAs could perhaps be involved in cell cycle, apoptosis, and growth control pathways, irrespective of cell type.
Certain miRNA families have undergone significant expansion in the human genome. Comparison with lower organisms has led to the prediction that increase in sequence variants is associated with functional diversification through an increased range of targets against the miRNA (Chen and Rajewsky 2006). If, indeed, increased sequence variants in humans are associated with specialized functions, they maybe expected to show diversified expression profiles. We checked the extent of expression diversification amongst sequence-related miRNAs, using the hsa-let-7 family members. The let-7 family of miRNAs consists of intergenic (hsa-let-7a-2, hsa-let-7i, hsa-let-7e, hsa-let-7a-1, and hsa-let-7f-1), intronic (hsa-let-7c, hsa-let-7g, hsa-let-7d, and hsa-let-7f-2), and exonic (hsa-let-7a-3 and hsa-let-7b) miRNAs. The eight members of the hsa-let7 family were clustered according to their Z scores from 140 experiments, which included samples from cell lines, in vivo tissue samples, and clinical cancer samples. Using a cutoff correlation coefficient of 0.6, hsa-let-7b and hsa-let-7e formed a separate group. The hsa-let-7b and hsa-let-7e miRNAs showed significant up-regulation in 17 cancer samples. The similarity in expression of the members of the hsa-let-7 family (Fig. 5) is not correlated to their arising from the same genomic locus, since hsa-let-7a-3 and hsa-let-7b, hsa-let-7a-1, hsa-let-7f-1, and hsa-let-7d arise from two clusters, while hsa-let-7e arises from a different genomic locus.
FIGURE 5.
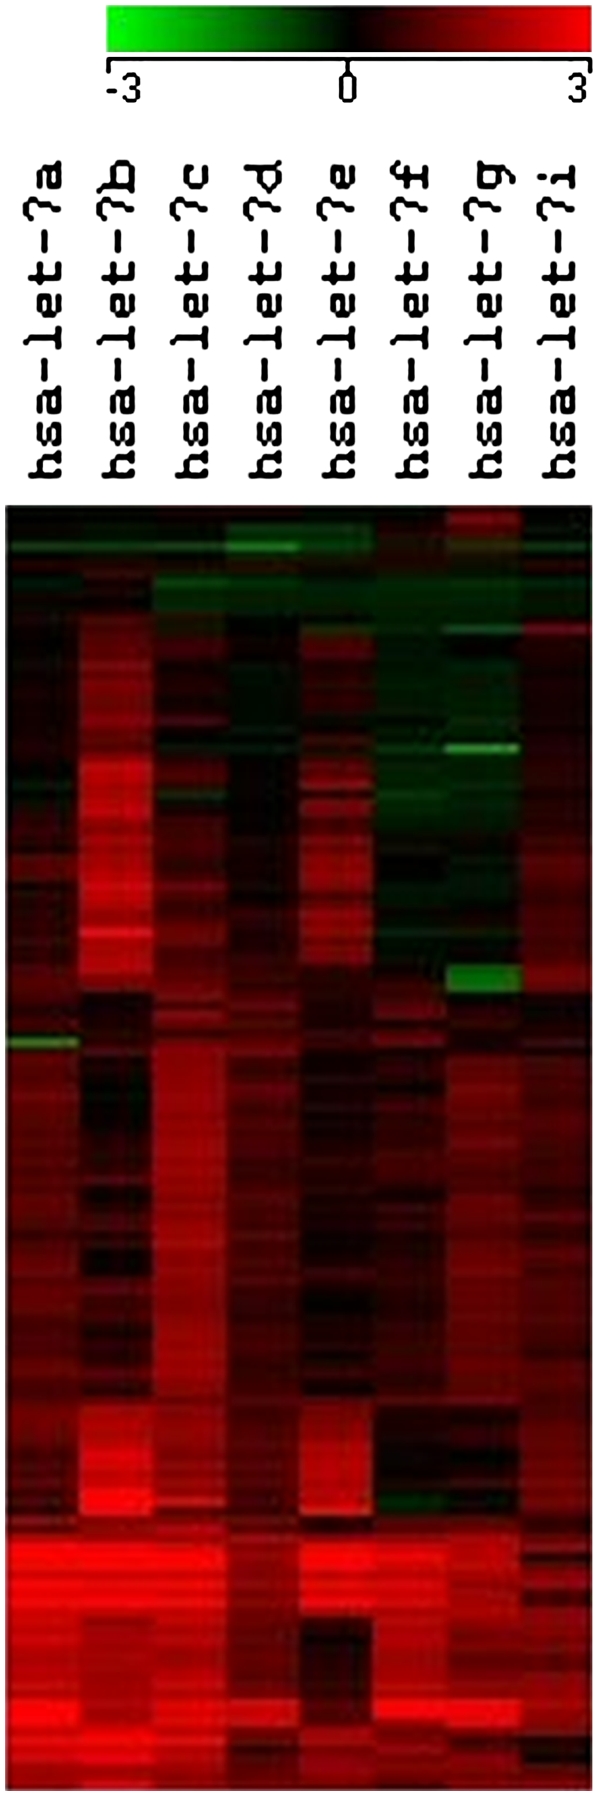
Expression levels of different members of the let-7 family of miRNAs across different samples. Z scores for expression of eight members of the hsa-let-7 family were calculated. The expression profiles for 140 experimental conditions were clustered using Self Organizing Maps.
Studies on the genomic organization of miRNAs have shown that miRNAs present in close proximity in the genome, called clusters, usually have similar expression patterns. In some cases, intronic microRNAs arising from the same gene have been shown to be coexpressed with each other and with the gene from which they arise. For instance, the functional relation between an intronic miRNA hsa-miR-208 and the corresponding host gene αMHC in cardiomyocyte hypertrophy has been described (van Rooji et al. 2007). A general correlation between intronic miRNAs and host genes would reduce the apparent complexity of gene regulatory networks, since expression patterns of the host gene, intronic miRNA, and targets would be tightly linked. However, several reports show that intronic miRNAs may be regulated by miRNA-specific promoters. Using a real-time PCR-based assay, Liang et al. (2007) also showed that only a subset of intronic miRNAs (22 out of 31) show high correlation with source transcripts in 19 out of 40 tissues. The differences in intronic miRNA expression profiles maybe attributed to differences in processing (Thomson et al. 2006), stability, and turnover (Guil and Caceres 2007). Recent attempts to identify miRNA promoters in human have also shown that intronic miRNAs may have their own promoters (Ozsolak et al. 2008). Notably, as many as one-third of intronic miRNAs in C. elegans were reported to have miRNA-specific promoters (Martinez et al. 2008). We used the consensus expression profiles to explore coregulation of clustered and intronic miRNAs. miRgen (Megraw et al. 2007), a database of positional relationships between miRNAs, was used to identify 37 clusters of miRNAs that occur within 500 nucleotides of each other. Eight of these clusters could not be analyzed further since their miRNAs did not have probes in any of the microarray studies. Seven clusters arise from introns of protein-coding genes and the remaining clusters are from intergenic transcripts. A summary of the correlation of expression in clustered miRNAs is presented in Supplemental File 1. Some of the clusters contained miRNAs with similar expression profiles; for instance, hsa-miR-183 and hsa-miR-96 showed a correlation coefficient of 0.67. Similarly, the intronic cluster of hsa-miR-15b and hsa-miR-16 arising from the SMC4L1 gene showed a high correlation (correlation coefficient = 0.8). However, in other clusters, miRNAs differed significantly in their expression patterns. One such example of a discordant pair is hsa-miR-212 and hsa-miR-132. Twenty-three pairs could be unambiguously classified as coexpressed (correlation coefficient >0.7), while 32 pairs were clearly discordantly expressed (correlation coefficient <0.3). Three miRNAs, hsa-miR-25, hsa-miR-93, and hsa-miR-106b arise from the same intron of the MCM7 gene (Fig. 6A). Scatterplots of expression over 105 samples (Fig. 6B) show high correlation between hsa-miR-25 and hsa-miR-93 (R2 = 0.7059). However, hsa-miR-106b, apparently arising from the same transcript, showed no correlation (R2 = 0.08) in expression with hsa-miR-25 and hsa-miR-93 (Fig. 6C). Our analysis may be affected by miRNAs arising from multiple locations and with closely related isoforms. For instance, hsa-miR-106a is closely related to an isoform hsa-miR-106b that arises from a different location on the genome.
FIGURE 6.

Gene structure of MCM7 and the three miRNAs (hsa-miR-25, hsa-miR-106b, and hsa-miR-93) in intron 12 and 13. (A) Z score for miRNA expression was calculated as described earlier. Scatterplots of miRNA expression over 105 experimental conditions were plotted against each other. Correlation plots of expression profiles between intronic miRNAs, (B) between hsa-miR-93 and hsa-miR-25, (C) between hsa-miR-106b and hsa-miR-25.
In summary, we have compared normalization methods to allow cross-platform validation of miRNA expression profiling data from microarray experiments. We have identified a core set of constitutively expressed miRNAs that can serve as normalization controls. We have also generated a database of prenormalized expression profiles using an internal normalization method and used the data to study the expression of miRNA family members and intronic miRNAs. This study is the first attempt to generate consensus expression profiles for miRNAs derived from interplatform and interlaboratory comparisons. Such expression profiles are a valuable resource to guide in target validation experiments and elucidation of regulatory networks.
MATERIALS AND METHODS
Source of data
We collected high-throughput experimental data on expression profiling of miRNAs from public repositories, Gene Expression Omnibus (GEO) (Edgar et al. 2002; Barrett et al. 2007), and Arrayexpress (Parkinson et al. 2007). The GNF atlas (Su et al. 2004; Ganapathi et al. 2007) containing expression data for mRNA transcripts was retrieved from GEO. miRNA sequences, flanking regions, and other miRNA-related information was downloaded from miRbase. Relationships between intronic miRNAs and host genes and positional information regarding miRNAs was visualized using the UCSC Genome Browser (Kent et al. 2002) version hg18.
KNNimpute
KNNimpute is a method of imputing missing values by replacing the missing value with a weighted average of “K” other miRNAs of a similar expression profile (nearest neighbors). Missing values were imputed using the program for implementation of the KNNimpute algorithm available from Stanford Microarray database. The parameters used include Euclidean matrix and an optimal K value of 15.
Comparison of expression profiles
miRNA expression data was downloaded and background-subtracted signal intensity values were calculated. Mean, median, constitutive miRNA, and quantile normalization were carried out using commercial microarray analysis software, Avadis. Boxplots were generated using R. The expression levels were then log transformed and Z scores (Cheadle et al. 2003) were calculated using the formula
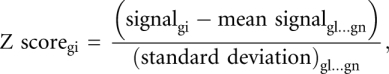 |
where g is any gene in the microarray.
The Z scores were used for clustering miRNAs using the commercial software for clustering microarray data, Avadis. Z ratios (Cheadle et al. 2003) represent the expression level of a miRNA in one tissue relative to its average expression level across all other tissues. For each miRNA, the difference between the Z score in a tissue (ZT) and the average Z scores across all other tissues (ZC) was divided by the Standard Deviation of the differences,
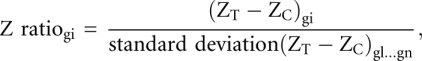 |
where g is any gene in the microarray, ZT is average Z score of gene g in a tissue (T), and ZC is average Z score for gene g across all other tissues.
Identification of constitutive miRNAs
Clustering of Z scores was performed using self-organizing maps (Tamayo et al. 1999a) in the microarray analysis software package Avadis. A coefficient of variation (CV) of Z scores was calculated for each miRNA. Since Z scores can be negative, the CV can also be negative. The mean was squared and the square root calculated to convert the CV to a positive value. The miRNAs with CV below 0.65 were selected,
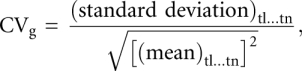 |
where g is any gene in the study. The mean and standard deviation were calculated across all tissues (t1…tn).
SUPPLEMENTAL MATERIAL
Supplemental material can be found at http://www.rnajournal.org.
ACKNOWLEDGMENTS
This work was supported by financial support from the Council for Scientific and Industrial Research (CSIR), (NWP0036) India. We thank G.P.S. Raghava and S.K. Brahmachari for their helpful comments. R.B. and M.H. received senior research fellowships from CSIR.
Footnotes
Article published online ahead of print. Article and publication date are at http://www.rnajournal.org/cgi/doi/10.1261/rna.1688110.
REFERENCES
- Barrett T, Troup DB, Wilhite SE, Ledoux P, Rudnev D, Evangelista C, Kim IF, Soboleva A, Tomashevsky M, Edgar R. NCBI GEO: Mining tens of millions of expression profiles–database and tools update. Nucleic Acids Res. 2007;35:D760–D765. doi: 10.1093/nar/gkl887. [DOI] [PMC free article] [PubMed] [Google Scholar]
- Bartel DP. MicroRNAs: Genomics, biogenesis, mechanism, and function. Cell. 2004;116:281–297. doi: 10.1016/s0092-8674(04)00045-5. [DOI] [PubMed] [Google Scholar]
- Baskerville S, Bartel DP. Microarray profiling of microRNAs reveals frequent coexpression with neighboring miRNAs and host genes. RNA. 2005;11:241–247. doi: 10.1261/rna.7240905. [DOI] [PMC free article] [PubMed] [Google Scholar]
- Bernstein E, Caudy AA, Hammond SM, Hannon GJ. Role for a bidentate ribonuclease in the initiation step of RNA interference. Nature. 2001;409:363–366. doi: 10.1038/35053110. [DOI] [PubMed] [Google Scholar]
- Beuvink I, Kolb FA, Budach W, Garnier A, Lange J, Natt F, Dengler U, Hall J, Filipowicz W, Weiler J. A novel microarray approach reveals new tissue-specific signatures of known and predicted mammalian microRNAs. Nucleic Acids Res. 2007;35 doi: 10.1093/nar/gkl1118. [DOI] [PMC free article] [PubMed] [Google Scholar]
- Bhattacharyya SN, Habermacher R, Martine U, Closs EI, Filipowicz W. Relief of microRNA-mediated translational repression in human cells subjected to stress. Cell. 2006;125:1111–1124. doi: 10.1016/j.cell.2006.04.031. [DOI] [PubMed] [Google Scholar]
- Bohnsack MT, Czaplinski K, Gorlich D. Exportin 5 is a RanGTP-dependent dsRNA-binding protein that mediates nuclear export of pre-miRNAs. RNA. 2004;10:185–191. doi: 10.1261/rna.5167604. [DOI] [PMC free article] [PubMed] [Google Scholar]
- Borchert GM, Lanier W, Davidson BL. RNA polymerase III transcribes human microRNAs. Nat Struct Mol Biol. 2006;13:1097–1101. doi: 10.1038/nsmb1167. [DOI] [PubMed] [Google Scholar]
- Bortolin-Cavaille ML, Dance M, Weber M, Cavaille J. C19MC microRNAs are processed from introns of large Pol-II, non-protein-coding transcripts. Nucleic Acids Res. 2009;37:3464–3473. doi: 10.1093/nar/gkp205. [DOI] [PMC free article] [PubMed] [Google Scholar]
- Calin GA, Sevignani C, Dumitru CD, Hyslop T, Noch E, Yendamuri S, Shimizu M, Rattan S, Bullrich F, Negrini M, et al. Human microRNA genes are frequently located at fragile sites and genomic regions involved in cancers. Proc Natl Acad Sci. 2004;101:2999–3004. doi: 10.1073/pnas.0307323101. [DOI] [PMC free article] [PubMed] [Google Scholar]
- Castoldi M, Schmidt S, Benes V, Noerholm M, Kulozik AE, Hentze MW, Muckenthaler MU. A sensitive array for microRNA expression profiling (miChip) based on locked nucleic acids (LNA) RNA. 2006;12:913–920. doi: 10.1261/rna.2332406. [DOI] [PMC free article] [PubMed] [Google Scholar]
- Cheadle C, Vawter MP, Freed WJ, Becker KG. Analysis of microarray data using Z score transformation. J Mol Diagn. 2003;5:73–81. doi: 10.1016/S1525-1578(10)60455-2. [DOI] [PMC free article] [PubMed] [Google Scholar]
- Chen K, Rajewsky N. Deep conservation of MicroRNA-target relationships and 3′UTR motifs in vertebrates, flies, and nematodes. Cold Spring Harb Symp Quant Biol. 2006;71:149–156. doi: 10.1101/sqb.2006.71.039. [DOI] [PubMed] [Google Scholar]
- Chen CZ, Li L, Lodish HF, Bartel DP. MicroRNAs modulate hematopoietic lineage differentiation. Science. 2004;303:83–86. doi: 10.1126/science.1091903. [DOI] [PubMed] [Google Scholar]
- Chen JJ, Hsueh HM, Delongchamp RR, Lin CJ, Tsai CA. Reproducibility of microarray data: A further analysis of microarray quality control (MAQC) data. BMC Bioinformatics. 2007;8:412. doi: 10.1186/1471-2105-8-412. [DOI] [PMC free article] [PubMed] [Google Scholar]
- Chen J, Lozach J, Garcia EW, Barnes B, Luo S, Mikoulitch I, Zhou L, Schroth G, Fan JB. Highly sensitive and specific microRNA expression profiling using BeadArray technology. Nucleic Acids Res. 2008;36:e87. doi: 10.1093/nar/gkn387. [DOI] [PMC free article] [PubMed] [Google Scholar]
- Cummins JM, Velculescu VE. Implications of micro-RNA profiling for cancer diagnosis. Oncogene. 2006;25:6220–6227. doi: 10.1038/sj.onc.1209914. [DOI] [PubMed] [Google Scholar]
- Denli AM, Tops BB, Plasterk RH, Ketting RF, Hannon GJ. Processing of primary microRNAs by the Microprocessor complex. Nature. 2004;432:231–235. doi: 10.1038/nature03049. [DOI] [PubMed] [Google Scholar]
- Edgar R, Domrachev M, Lash AE. Gene Expression Omnibus: NCBI gene expression and hybridization array data repository. Nucleic Acids Res. 2002;30:207–210. doi: 10.1093/nar/30.1.207. [DOI] [PMC free article] [PubMed] [Google Scholar]
- Eis PS, Tam W, Sun L, Chadburn A, Li Z, Gomez MF, Lund E, Dahlberg JE. Accumulation of miR-155 and BIC RNA in human B cell lymphomas. Proc Natl Acad Sci. 2005;102:3627–3632. doi: 10.1073/pnas.0500613102. [DOI] [PMC free article] [PubMed] [Google Scholar]
- Fu H, Tie Y, Xu C, Zhang Z, Zhu J, Shi Y, Jiang H, Sun Z, Zheng X. Identification of human fetal liver miRNAs by a novel method. FEBS Lett. 2005;579:3849–3854. doi: 10.1016/j.febslet.2005.05.064. [DOI] [PubMed] [Google Scholar]
- Ganapathi M, Singh GP, Sandhu KS, Brahmachari SK, Brahmachari V. A whole genome analysis of 5′ regulatory regions of human genes for putative cis-acting modulators of nucleosome positioning. Gene. 2007;391:242–251. doi: 10.1016/j.gene.2007.01.008. [DOI] [PubMed] [Google Scholar]
- Giraldez AJ, Mishima Y, Rihel J, Grocock RJ, van Dongen S, Inoue K, Enright AJ, Schier AF. Zebrafish MiR-430 promotes deadenylation and clearance of maternal mRNAs. Science. 2006;312:75–79. doi: 10.1126/science.1122689. [DOI] [PubMed] [Google Scholar]
- Griffiths-Jones S, Grocock RJ, van Dongen S, Bateman A, Enright AJ. miRBase: MicroRNA sequences, targets and gene nomenclature. Nucleic Acids Res. 2006;34:D140–D144. doi: 10.1093/nar/gkj112. [DOI] [PMC free article] [PubMed] [Google Scholar]
- Guil S, Caceres JF. The multifunctional RNA-binding protein hnRNP A1 is required for processing of miR-18a. Nat Struct Mol Biol. 2007;14:591–596. doi: 10.1038/nsmb1250. [DOI] [PubMed] [Google Scholar]
- Han J, Lee Y, Yeom KH, Kim YK, Jin H, Kim VN. The Drosha-DGCR8 complex in primary microRNA processing. Genes & Dev. 2004;18:3016–3027. doi: 10.1101/gad.1262504. [DOI] [PMC free article] [PubMed] [Google Scholar]
- Humphreys DT, Westman BJ, Martin DI, Preiss T. MicroRNAs control translation initiation by inhibiting eukaryotic initiation factor 4E/cap and poly(A) tail function. Proc Natl Acad Sci. 2005;102:16961–16966. doi: 10.1073/pnas.0506482102. [DOI] [PMC free article] [PubMed] [Google Scholar]
- Hutvagner G, McLachlan J, Pasquinelli AE, Balint E, Tuschl T, Zamore PD. A cellular function for the RNA-interference enzyme Dicer in the maturation of the let-7 small temporal RNA. Science. 2001;293:834–838. doi: 10.1126/science.1062961. [DOI] [PubMed] [Google Scholar]
- John B, Enright AJ, Aravin A, Tuschl T, Sander C, Marks DS. Human MicroRNA targets. PLoS Biol. 2004;2:e363. doi: 10.1371/journal.pbio.0020363. [DOI] [PMC free article] [PubMed] [Google Scholar]
- Kent WJ, Sugnet CW, Furey TS, Roskin KM, Pringle TH, Zahler AM, Haussler D. The human genome browser at UCSC. Genome Res. 2002;12:996–1006. doi: 10.1101/gr.229102. [DOI] [PMC free article] [PubMed] [Google Scholar]
- Ketting RF, Fischer SE, Bernstein E, Sijen T, Hannon GJ, Plasterk RH. Dicer functions in RNA interference and in synthesis of small RNA involved in developmental timing in C. elegans. Genes & Dev. 2001;15:2654–2659. doi: 10.1101/gad.927801. [DOI] [PMC free article] [PubMed] [Google Scholar]
- Kim VN. MicroRNA biogenesis: Coordinated cropping and dicing. Nat Rev Mol Cell Biol. 2005;6:376–385. doi: 10.1038/nrm1644. [DOI] [PubMed] [Google Scholar]
- Kim YK, Kim VN. Processing of intronic microRNAs. EMBO J. 2007;26:775–783. doi: 10.1038/sj.emboj.7601512. [DOI] [PMC free article] [PubMed] [Google Scholar]
- Krek A, Grun D, Poy MN, Wolf R, Rosenberg L, Epstein EJ, Macmenamin P, da Piedade I, Gunsalus KC, Stoffel M, et al. Combinatorial microRNA target predictions. Nat Genet. 2005;37:495–500. doi: 10.1038/ng1536. [DOI] [PubMed] [Google Scholar]
- Krichevsky AM, King KS, Donahue CP, Khrapko K, Kosik KS. A microRNA array reveals extensive regulation of microRNAs during brain development. RNA. 2003;9:1274–1281. doi: 10.1261/rna.5980303. [DOI] [PMC free article] [PubMed] [Google Scholar]
- Lagos-Quintana M, Rauhut R, Yalcin A, Meyer J, Lendeckel W, Tuschl T. Identification of tissue-specific microRNAs from mouse. Curr Biol. 2002;12:735–739. doi: 10.1016/s0960-9822(02)00809-6. [DOI] [PubMed] [Google Scholar]
- Landthaler M, Yalcin A, Tuschl T. The human DiGeorge syndrome critical region gene 8 and its D. melanogaster homolog are required for miRNA biogenesis. Curr Biol. 2004;14:2162–2167. doi: 10.1016/j.cub.2004.11.001. [DOI] [PubMed] [Google Scholar]
- Lee Y, Ahn C, Han J, Choi H, Kim J, Yim J, Lee J, Provost P, Radmark O, Kim S, et al. The nuclear RNase III Drosha initiates microRNA processing. Nature. 2003;425:415–419. doi: 10.1038/nature01957. [DOI] [PubMed] [Google Scholar]
- Liang Y, Ridzon D, Wong L, Chen C. Characterization of microRNA expression profiles in normal human tissues. BMC Genomics. 2007;8:166. doi: 10.1186/1471-2164-8-166. [DOI] [PMC free article] [PubMed] [Google Scholar]
- Liu CG, Calin GA, Meloon B, Gamliel N, Sevignani C, Ferracin M, Dumitru CD, Shimizu M, Zupo S, Dono M, et al. An oligonucleotide microchip for genome-wide microRNA profiling in human and mouse tissues. Proc Natl Acad Sci. 2004;101:9740–9744. doi: 10.1073/pnas.0403293101. [DOI] [PMC free article] [PubMed] [Google Scholar]
- Liu J, Rivas FV, Wohlschlegel J, Yates JR, III, Parker R, Hannon GJ. A role for the P-body component GW182 in microRNA function. Nat Cell Biol. 2005;7:1261–1266. doi: 10.1038/ncb1333. [DOI] [PMC free article] [PubMed] [Google Scholar]
- Lu J, Getz G, Miska EA, Avarez-Saavedra E, Lamb J, Peck D, Sweet-Cordero A, Ebert BL, Mak RH, Ferrando AA, et al. MicroRNA expression profiles classify human cancers. Nature. 2005;435:834–838. doi: 10.1038/nature03702. [DOI] [PubMed] [Google Scholar]
- Lund E, Guttinger S, Calado A, Dahlberg JE, Kutay U. Nuclear export of microRNA precursors. Science. 2004;303:95–98. doi: 10.1126/science.1090599. [DOI] [PubMed] [Google Scholar]
- Martinez NJ, Ow MC, Reece-Hoyes JS, Barrasa MI, Ambros VR, Walhout AJ. Genome-scale spatiotemporal analysis of Caenorhabditis elegans microRNA promoter activity. Genome Res. 2008;18:2005–2015. doi: 10.1101/gr.083055.108. [DOI] [PMC free article] [PubMed] [Google Scholar]
- Megraw M, Sethupathy P, Corda B, Hatzigeorgiou AG. miRGen: A database for the study of animal microRNA genomic organization and function. Nucleic Acids Res. 2007;35:D149–D155. doi: 10.1093/nar/gkl904. [DOI] [PMC free article] [PubMed] [Google Scholar]
- Mineno J, Okamoto S, Ando T, Sato M, Chono H, Izu H, Takayama M, Asada K, Mirochnitchenko O, Inouye M, et al. The expression profile of microRNAs in mouse embryos. Nucleic Acids Res. 2006;34:1765–1771. doi: 10.1093/nar/gkl096. [DOI] [PMC free article] [PubMed] [Google Scholar]
- Mishima T, Takizawa T, Luo SS, Ishibashi O, Kawahigashi Y, Mizuguchi Y, Ishikawa T, Mori M, Kanda T, Goto T, et al. MicroRNA (miRNA) cloning analysis reveals sex differences in miRNA expression profiles between adult mouse testis and ovary. Reproduction. 2008;136:811–822. doi: 10.1530/REP-08-0349. [DOI] [PubMed] [Google Scholar]
- Mourelatos Z, Dostie J, Paushkin S, Sharma A, Charroux B, Abel L, Rappsilber J, Mann M, Dreyfuss G. miRNPs: A novel class of ribonucleoproteins containing numerous microRNAs. Genes & Dev. 2002;16:720–728. doi: 10.1101/gad.974702. [DOI] [PMC free article] [PubMed] [Google Scholar]
- Nakano M, Nobuta K, Vemaraju K, Tej SS, Skogen JW, Meyers BC. Plant MPSS databases: Signature-based transcriptional resources for analyses of mRNA and small RNA. Nucleic Acids Res. 2006;34:D731–D735. doi: 10.1093/nar/gkj077. [DOI] [PMC free article] [PubMed] [Google Scholar]
- Nelson PT, Baldwin DA, Scearce LM, Oberholtzer JC, Tobias JW, Mourelatos Z. Microarray-based, high-throughput gene expression profiling of microRNAs. Nat Methods. 2004;1:155–161. doi: 10.1038/nmeth717. [DOI] [PubMed] [Google Scholar]
- Ozsolak F, Poling LL, Wang Z, Liu H, Liu XS, Roeder RG, Zhang X, Song JS, Fisher DE. Chromatin structure analyses identify miRNA promoters. Genes & Dev. 2008;22:3172–3183. doi: 10.1101/gad.1706508. [DOI] [PMC free article] [PubMed] [Google Scholar]
- Parkinson H, Kapushesky M, Shojatalab M, Abeygunawardena N, Coulson R, Farne A, Holloway E, Kolesnykov N, Lilja P, Lukk M, et al. ArrayExpress–a public database of microarray experiments and gene expression profiles. Nucleic Acids Res. 2007;35:D747–D750. doi: 10.1093/nar/gkl995. [DOI] [PMC free article] [PubMed] [Google Scholar]
- Peltier HJ, Latham GJ. Normalization of microRNA expression levels in quantitative RT-PCR assays: Identification of suitable reference RNA targets in normal and cancerous human solid tissues. RNA. 2008;14:844–852. doi: 10.1261/rna.939908. [DOI] [PMC free article] [PubMed] [Google Scholar]
- Petersen CP, Bordeleau ME, Pelletier J, Sharp PA. Short RNAs repress translation after initiation in mammalian cells. Mol Cell. 2006;21:533–542. doi: 10.1016/j.molcel.2006.01.031. [DOI] [PubMed] [Google Scholar]
- Pillai RS, Bhattacharyya SN, Filipowicz W. Repression of protein synthesis by miRNAs: How many mechanisms? Trends Cell Biol. 2007;17:118–126. doi: 10.1016/j.tcb.2006.12.007. [DOI] [PubMed] [Google Scholar]
- Pradervand S, Weber J, Thomas J, Bueno M, Wirapati P, Lefort K, Dotto GP, Harshman K. Impact of normalization on miRNA microarray expression profiling. RNA. 2009;15:493–501. doi: 10.1261/rna.1295509. [DOI] [PMC free article] [PubMed] [Google Scholar]
- Sempere LF, Freemantle S, Pitha-Rowe I, Moss E, Dmitrovsky E, Ambros V. Expression profiling of mammalian microRNAs uncovers a subset of brain-expressed microRNAs with possible roles in murine and human neuronal differentiation. Genome Biol. 2004;5:R13. doi: 10.1186/gb-2004-5-3-r13. [DOI] [PMC free article] [PubMed] [Google Scholar]
- Shi L, Tong W, Fang H, Scherf U, Han J, Puri RK, Frueh FW, Goodsaid FM, Guo L, Su Z, et al. Cross-platform comparability of microarray technology: Intra-platform consistency and appropriate data analysis procedures are essential. BMC Bioinformatics. 2005;6(Suppl 2):S12. doi: 10.1186/1471-2105-6-S2-S12. [DOI] [PMC free article] [PubMed] [Google Scholar]
- Su AI, Wiltshire T, Batalov S, Lapp H, Ching KA, Block D, Zhang J, Soden R, Hayakawa M, Kreiman G, et al. A gene atlas of the mouse and human protein-encoding transcriptomes. Proc Natl Acad Sci. 2004;101:6062–6067. doi: 10.1073/pnas.0400782101. [DOI] [PMC free article] [PubMed] [Google Scholar]
- Tamayo P, Slonim D, Mesirov J, Zhu Q, Kitareewan S, Dmitrovsky E, Lander ES, Golub TR. Interpreting patterns of gene expression with self-organizing maps: Methods and application to hematopoietic differentiation. Proc Natl Acad Sci. 1999a;96:2907–2912. doi: 10.1073/pnas.96.6.2907. [DOI] [PMC free article] [PubMed] [Google Scholar]
- Tamayo P, Slonim D, Mesirov J, Zhu Q, Kitareewan S, Dmitrovsky E, Lander ES, Golub TR. Interpreting patterns of gene expression with self-organizing maps: Methods and application to hematopoietic differentiation. Proc Natl Acad Sci. 1999b;96:2907–2912. doi: 10.1073/pnas.96.6.2907. [DOI] [PMC free article] [PubMed] [Google Scholar]
- Thomson JM, Newman M, Parker JS, Morin-Kensicki EM, Wright T, Hammond SM. Extensive post-transcriptional regulation of microRNAs and its implications for cancer. Genes & Dev. 2006;20:2202–2207. doi: 10.1101/gad.1444406. [DOI] [PMC free article] [PubMed] [Google Scholar]
- Tomari Y, Zamore PD. Perspective: Machines for RNAi. Genes & Dev. 2005;19:517–529. doi: 10.1101/gad.1284105. [DOI] [PubMed] [Google Scholar]
- Troyanskaya O, Cantor M, Sherlock G, Brown P, Hastie T, Tibshirani R, Botstein D, Altman RB. Missing value estimation methods for DNA microarrays. Bioinformatics. 2001;17:520–525. doi: 10.1093/bioinformatics/17.6.520. [DOI] [PubMed] [Google Scholar]
- van Rooji E, Sutherland LB, Qi X, Richardson JA, Hill J, Olson EN. Control of stress-dependent cardiac growth and gene expression by a microRNA. Science. 2007;316:575–579. doi: 10.1126/science.1139089. [DOI] [PubMed] [Google Scholar]
- Wang H, Ach RA, Curry B. Direct and sensitive miRNA profiling from low-input total RNA. RNA. 2007;13:151–159. doi: 10.1261/rna.234507. [DOI] [PMC free article] [PubMed] [Google Scholar]
- Wu L, Fan J, Belasco JG. MicroRNAs direct rapid deadenylation of mRNA. Proc Natl Acad Sci. 2006;103:4034–4039. doi: 10.1073/pnas.0510928103. [DOI] [PMC free article] [PubMed] [Google Scholar]
- Wulczyn FG, Smirnova L, Rybak A, Brandt C, Kwidzinski E, Ninnemann O, Strehle M, Seiler A, Schumacher S, Nitsch R. Post-transcriptional regulation of the let-7 microRNA during neural cell specification. FASEB J. 2007;21:415–426. doi: 10.1096/fj.06-6130com. [DOI] [PubMed] [Google Scholar]
- Yi R, Qin Y, Macara IG, Cullen BR. Exportin-5 mediates the nuclear export of pre-microRNAs and short hairpin RNAs. Genes & Dev. 2003;17:3011–3016. doi: 10.1101/gad.1158803. [DOI] [PMC free article] [PubMed] [Google Scholar]