

Abstract
Mesenchymal stem cells (MSC) are multipotent cells which can be obtained from several adult and fetal tissues including human umbilical cord units. We have recently shown that umbilical cord tissue (UC) is richer in MSC than umbilical cord blood (UCB) but their origin and characteristics in blood as compared to the cord remains unknown. Here we compared, for the first time, the exonic protein-coding and intronic noncoding RNA (ncRNA) expression profiles of MSC from match-paired UC and UCB samples, harvested from the same donors, processed simultaneously and under the same culture conditions. The patterns of intronic ncRNA expression in MSC from UC and UCB paired units were highly similar, indicative of their common donor origin. The respective exonic protein-coding transcript expression profiles, however, were significantly different. Hierarchical clustering based on protein-coding expression similarities grouped MSC according to their tissue location rather than original donor. Genes related to systems development, osteogenesis and immune system were expressed at higher levels in UCB, whereas genes related to cell adhesion, morphogenesis, secretion, angiogenesis and neurogenesis were more expressed in UC cells. These molecular differences verified in tissue-specific MSC gene expression may reflect functional activities influenced by distinct niches and should be considered when developing clinical protocols involving MSC from different sources. In addition, these findings reinforce our previous suggestion on the importance of banking the whole umbilical cord unit for research or future therapeutic use.
Electronic supplementary material
The online version of this article (doi:10.1007/s12015-009-9098-5) contains supplementary material, which is available to authorized users.
Keywords: Human umbilical cord, Human umbilical cord blood, Mesenchymal stem cells, Comparative gene expression profile
Introduction
Multipotent mesenchymal stem cells (MSC) are an immature cell type with ability to self-renew and differentiate into specific functional cell types including chondrocytes, osteocytes, adipocytes, myocytes, and neurons. Phenotypic and genetic lines of evidence suggest that MSC are a useful model for developmental biology studies in normal and disease backgrounds, in addition to their therapeutic potential [1–4].
MSC were originally isolated from bone marrow (BM). Subsequently, similar populations have been reported in other tissues, such as adipose tissue [5, 6], dental pulp [7], placenta, umbilical cord blood (UCB) and umbilical cord tissue (UC), as well as from a variety of fetal tissues, such as spleen, lung, pancreas, kidney, and amniotic fluid during midgestation [8–13]. According to some authors, MSC are located in the vascular wall, constituting a MSC compartment extending throughout the entire organism [14–18]. In fact, it is known that many tissues contain lineage-committed progenitor cells for their maintenance and repair and several studies have demonstrated the presence of uncommitted MSC within the perivascular niche of several organs in animal models, where their function is to stabilize blood vessels, and to contribute to tissue homeostasis [19–21]. On the other hand, MSC seem to be absent from the circulating blood under normal physiological conditions [17, 22] and their presence in term UCB is controversial; some researchers successfully isolated MSC from UCB [10, 23–25], whereas others failed or obtained cells at low yield [11, 22, 26, 27]. We have recently shown that UC is much richer in MSC than UCB [11]. However, the question of whether the cells obtainable from both compartments were actually the same entity or not remained unanswered.
Several studies based on protein-coding gene expression profiling have been conducted with the aim of enhancing our understanding on MSC biology and ontogeny [28–33]. Further, recent investigation has demonstrated that noncoding RNAs, in addition to protein-coding genes, encompass several functions related to stem cell biology, including the maintenance of pluripotency and induction of cellular differentiation programs [34]. Given their presence in other cell-types and tissue, the noncoding transcripts are likely to be involved in other aspects of mammalian developmental and cellular biology [34–38]. More specifically, there are already a few examples of cellular mechanisms involving noncoding RNAs such as: an antisense noncoding RNA regulating usage of alternatively spliced isoforms of the Fas protein-coding gene transcribed from the same locus [39]; an antisense noncoding RNA regulating translation of the host PU.1 protein-coding gene [40]; and an intronic noncoding RNA from the CFTR locus regulating the expression of genes for specific cellular processes related to the function of the CFTR protein-coding gene [41].
Considering that large-scale expression studies are commonly restricted to protein-coding genes [28–33], studying the new and expanding class of noncoding RNA transcripts in a genome-wide scale is of great interest and may enhance our understanding of their biological functions in MSC.
Here, we analyzed, for the first time, the exonic protein-coding and intronic noncoding RNA expression profiles from match-paired UCB and UC samples, which were harvested from the same donors, processed simultaneously, and kept under the same culture conditions. The intronic noncoding RNA expression pattern of MSC from UC and UCB paired samples were highly similar suggesting that they share a common cellular origin. Surprisingly, we found significant differences in the global exonic protein-coding transcript expression patterns of MSC from UCB and UC paired samples, suggesting tissue specificity. These findings provide new insights on the biology and ontogeny of MSC in vivo, and add new information to be considered when developing clinical protocols involving MSC obtained from different sources.
Materials and Methods
Harvesting of UC and UCB
Sixty-five human UC and UCB matching units were collected after informed consent from all mothers and in accordance with the ethical committee of Jesus, José e Maria Hospital, University Hospital and Institute of Bioscience of University of São Paulo.
UCB was harvested from each sample, and conserved with 100 mM EDTA anticoagulant at 22°C. Sections of 8–10 cm of umbilical cords, which are routinely discarded, were internally washed with phosphate-buffered saline (PBS), supplemented with 3% penicillin/streptomycin (Invitrogen-Gibco, Grand Island, NY, http://www.invitrogen.com) and immediately immersed in Dulbecco’s modified Eagle’s medium-low glucose (DMEM-LG; Invitrogen-Gibco) supplemented with 10% fetal bovine serum (FBS; Invitrogen-Gibco) and 3% penicillin/streptomycin (Invitrogen-Gibco). All samples were processed within 12–15 h after collection.
Isolation and Culture of Adherent Cells from UCB and UC
After blood dilution of 3:1 with RPMI 1640 medium (Invitrogen-Gibco), mononuclear cells (MNCs) were isolated by density gradient centrifugation at 400 x g for 30 min at room temperature (25°C) using Ficoll-Paque Premium (GE Healthcare, Little Chalfont, U.K., http://www.gehealthcare.com). MNCs were washed twice with PBS and resuspended in proliferation medium consisting of DMEM-LG, 10% FBS, 100 U/ml penicillin and 1% penicillin/streptomycin. Cells were plated at a density of 5 × 10⁷ cells per ml in culture flasks (25 cm2) and maintained at 37°C in a humidified atmosphere containing 5% CO2.
UCs were filled with 0.1% collagenase (Sigma-Aldrich, St. Louis, http://www.sigmaaldrich.com/sigma-aldrich/home.html) in PBS and incubated at 37°C for 20 min. Each UC was washed with proliferation medium, and the detached cells were harvested after gentle massage of the UC. Cells were centrifuged at 300 g for 10 min, resuspended in proliferation medium, and seeded in 25-cm2 flasks at a density of 5 × 10⁷ cells per ml.
After 24 h of incubation, non-adherent cells were removed, and culture medium was replaced every 3 days.
Immunophenotyping
To analyze cell-surface expression of typical protein markers, adherent cells were incubated with the following anti-human primary antibodies: CD29-PECy5, CD34-PerCP, CD31-phycoerythrin (PE), CD45-fluorescein isothiocyanate (FITC), CD90-R-PE, CD73-PE, CD13-PE, CD44-PE, CD117-PE, human leukocyte antigen (HLA)-ABC-FITC, HLA-DR-R-PE (Becton, Dickinson and Company, Franklin Lakes, NJ, http://www.bd.com). A total of 10,000 labeled cells were analyzed using a Guava EasyCyte flow cytometer running Guava ExpressPlus software (Guava Technologies Hayward, CA, http://www.guavatechnologies.com).
Cell Differentiation Procedures
To evaluate MSC properties, adherent cells (third passage, at 80–90% confluence) were subjected to adipogenic, chondrogenic, and osteogenic differentiation in vitro, according to established protocols [4, 11].
RNA Preparation
At 90% confluence, the MSC from four UC tissues and UCB paired samples (n = 4),at the second passage, were briefly rinsed with ice-cold PBS and lysed in TRIZOL reagent (Invitrogen, Carlsbad, CA, http://www.invitrogen.com) for RNA extraction. RNA purification and treatment with DNase I was performed in the ‘on-column DNase digestion’, according to protocol of the Qiagen RNeasy kit (Qiagen, Valencia, CA, USA). All RNA samples were checked for purity using a ND-1000 spectrophotometer (NanoDrop Technologies, Wilmington, DE, USA) and for integrity by electrophoresis on a 2100 BioAnalyzer (Agilent Technologies, Santa Clara, CA, USA).
Sample Labeling and Microarray Hybridization Procedures
Cy5- and Cy3-labeled cRNAs were obtained using 300 ng total RNA as template for amplification of poly(A) RNA by T7-RNA polymerase with the Agilent Low RNA Input Fluorescent Linear Amplification kit. The T7-polymerase amplified cRNA labeling approach advantageously replaces the reverse-transcriptase cDNA labeling used in early microarray experiments, because T7-RNA polymerase labeling of cRNA preserves the strand orientation of the original mRNA template. Reverse-transcriptase labeling can eventually generate a complementary cDNA second strand and cause artifactual labeling of a target with the opposite sense to that of the original message.
Hybridization of 825 ng of Cy3- or Cy5-labeled RNA (dye swap technical replicate) from each UC sample with its paired UCB sample was performed with Agilent in situ Hybridization kit-plus, as recommended by the manufacturer, using a total of 4 intron-exon 44K expression oligoarrays. This array comprises a total of 13,699 exonic probes representing different protein-coding genes, along with custom-designed intronic probes for the antisense or sense strand, as illustrated in Supplemental Figure 1 [37] (Figure S1).
Slides were washed and processed according to the Agilent Two-Color Microarray-Based Gene Expression Analysis protocol (Version 5.5) and scanned on a GenePix 4000B scanner (Molecular Devices, Sunnyvale, CA, USA). Fluorescence intensities were extracted using Feature Extraction (FE) software (version 9.0; Agilent). A gene was considered expressed if its probe intensity was significantly higher than the local background intensity, as calculated by the FE software. Then, the software applies local background subtraction and corrects for unequal dye incorporation using the default LOWESS (locally weighted linear regression) method. We have included into further statistical analyses only those genes that were detected as expressed in at least all UC samples or all CB samples as described below.
Microarray data has been deposited at the GEO database. The platform Access number is GPL9193 and the experimental series Access number is GSE18134.
Statistical Analyses of Expression
In order to identify differentially expressed transcripts between UC and UCB samples, we employed the Statistical Analysis of Microarray (SAM) approach [42] (http://www-stat.stanford.edu/tibs/SAM/), using the following parameters: one-class analysis, 256 permutations, automatic K-Nearest Neighbors Imputer and a significance cutoff at 5% False Discovery Rate. We performed a detailed functional annotation and description of the top 30 genes that were most significantly over-expressed in MSC from UC or UCB. To generate this list we started with the differentially expressed genes determined by the SAM analysis, ranked them by significance (q-value) and subsequently by fold change, and we further eliminated the eventual duplicate probes for the same locus; the resulting two lists contain the 30 unique protein-coding genes over-expressed in MSC from either UC or UCB.
The set of differentially expressed protein-coding genes was further annotated by Gene Ontology (GO) terms and over-representation in functional categories was analyzed by hypergeometric distribution with the Benjamini-Hochberg correction for multiple testing (p ≤ 0.05) using the eGOn tool [43]. Canonical pathways enrichment analyses of differentially expressed genes were performed using the Ingenuity Pathway Analysis (IPA) software (Ingenuity Systems, Redwood City, CA). This software uses a numerical value to rank the canonical pathways according to how relevant they are to the genes in the input dataset. The value is calculated taking into account the number of focus genes in the pathway and the size of the pathway in order to approximate how relevant this pathway is to the original list of focus genes. The significance value (p ≤ 0.05) is computed using the right-tailed Fisher’s Exact Test and the p-value is corrected for multiple testing with the Benjamini-Hochberg method. The canonical pathway identified as significantly enriched (p < 0.05) is then presented as a graph indicating the molecular relationships between genes/gene products.
Using the SAM approach with the same parameters mentioned above, we found a very small number of intronic noncoding genes with statistically significant differential expression between UC and UCB samples (see Results). Therefore, in this case we chose to look for over-representation of GO functional categories and of enriched functions among the top 33% most highly expressed intronic noncoding RNAs in each sample. For this purpose, each intronic noncoding transcript was functionally annotated according to the protein-coding gene of the same genomic locus and further classified by Gene Ontology terms.
Real-Time Quantitative Polymerase Chain Reaction Analysis
Differential expressions observed by microarray analysis were verified by Real-time Quantitative Polymerase Chain Reaction Analysis (RT-Q-PCR) for 7 differentially regulated genes and 1 housekeeping gene. Total RNA samples were reverse transcribed into cDNA using Superscript III reverse transcription kit (Invitrogen) and quantitative real-time PCR was performed using 1 µg of cDNA and SYBR Green PCR master mix in an ABI Prism 7500 system (Applied Biosystems). Authenticity of the PCR products was verified by melt-curve analysis and agarose gel electrophoresis. Amplification efficiency of PCR products was determined by calculating the slope after semi-logarithmic plotting of the values against cycle number. Samples were run in triplicates, and the threshold suggested by the instrument software was used to calculate Ct. Differential expression was calculated in relation to GAPDH. Data were analyzed statistically by Mann-Whitney test at a 0.05 level of significance. Primer sequences are provided in Supplemental Table 1 (Table S1).
Results
Isolation and Characterization of MSC from UC and UCB
MSC could be isolated from all 65 UC samples (100%), but only from 6 out of 65 UCB samples (9%). Previously, we had reported that the efficiency in isolating MSC from UCB stands around 10% [11].
All isolated MSC populations displayed a spindle-shaped morphology (Fig. 1b, d). To evaluate MSC properties, their immunophenotype and differentiation capacity were considered. A panel of surface markers was tested by flow cytometry. MSC from all paired samples were negative for CD31 (endothelial cell marker), CD34, CD45, CD117 (hematopoietic cell markers), and HLA-DR (human leukocyte differentiation antigen class II), whereas they were positive for CD29, CD44 (adhesion markers), CD90, CD73, CD13 (mesenchymal markers), and HLA-ABC (human leukocyte differentiation antigen class I; Fig. 1a, c; Table 1). In vitro differentiation analysis confirmed that all isolated MSC from each matching units exhibited a comparable capacity to differentiate into osteoblasts, chondrocytes and adipocytes thus confirming their multipotent potential (Fig. 1e).
Fig. 1.

Characterization of adherent cells isolated from UCB and UC. a, c Flow cytometric analysis of cell surface markers of MSC from UCB and UC, respectively. Representative histograms are demonstrated, and their respective controls are shown by the black lines. b, d Morphology of adherent cells isolated from UCB and UC. After 15 days in culture, all isolated MSC populations displayed a spindle-shaped morphology. e Differentiation potential of adherent cells isolated from UCB and UC. Osteogenic differentiation of adherent cells from UCB and UC was demonstrated by calcium deposition shown by von Kossa stain; Adipogenesis was detected by the formation of intracytoplasmic lipid droplets stained with oil red O; Cell spheres from UCB and UC were stained with toluidine blue to confirm chondrogenic differentiation. Mucopolysaccharide-rich extracellular matrix is shown in pinkish metachromatic areas. Abbreviations: CD cluster of differentiation; HLA-ABC human leukocyte antigen-ABC; HLA-DR human leukocyte antigen-DR; UCB umbilical cord blood; UC umbilical cord
Table 1.
Summary of surface markers expression in MSC from UCB and UC
| Surface Marker | UCB (%) | UC (%) |
|---|---|---|
| Control | 0.84 | 0.98 |
| CD 13 | 98.18 | 96.64 |
| CD 29 | 97.88 | 97.94 |
| CD 44 | 97.72 | 97.18 |
| CD73 | 98.26 | 98.84 |
| CD 34 | 1.46 | 3.26 |
| CD 45 | 1.10 | 4.54 |
| CD 117 | 1.88 | 1.38 |
| CD 31 | 1.22 | 1.28 |
| HLA-ABC | 93.10 | 99.82 |
| HLA-DR | 1.68 | 1.94 |
Data represent the mean of 3 different samples (n = 3). The results showed are percentage of positive cells
HLA-ABC human leukocyte antigen-ABC; HLA-DR human leukocyte antigen-DR; UC umbilical cord; UCB umbilical cord blood
Large-Scale Gene Expression Measurements in UC and UCB Paired Samples
The observation that both populations of cells exhibit comparable properties and differentiation capacity, characteristic of MSC, does not exclude the possibility that they may differ in their potential to originate different cell lineages. To further evaluate how similar were MSC from UCB and UC paired samples, we examined their respective gene expression profiles (n = 4) using the 44 k intron-exon oligoarray previously designed by our group [37].
A total of 38,960 probes are present in the oligoarray, comprising probes for exons of 13,699 protein-coding transcripts, along with 7,515 pairs of probes for totally intronic noncoding (TIN) transcripts, both for the sense (S-TIN) and anti-sense (AS-TIN) strands, plus 4,920 probes for antisense partially intronic noncoding (AS-PIN) transcripts (Table 2). The term AS-PIN is used to identify a transcript that overlaps an exon and is transcribed from the opposite strand extending at least 30 bases into the adjacent introns over both ends of the exon [37] (Figure S1).
Table 2.
Protein-coding and noncoding genes expressed in MSC from UC and UCB tissues
| Exonic | Intronic | All ncRNAs | ||||||||||
|---|---|---|---|---|---|---|---|---|---|---|---|---|
| probes | % | AS-TIN | S-TIN | AS-PIN | Other ncRNA | |||||||
| probes | % | probes | % | probes | % | probes | % | probes | % | |||
| On the Array | 13699 | 100 | 7515 | 100 | 7515 | 100 | 4920 | 100 | 662 | 100 | 20612 | 100 |
| Expressed in UC and UCB | 10935 | 80 | 1645 | 22 | 2420 | 32 | 2651 | 54 | 454 | 69 | 7170 | 35 |
| probes | %a | probes | %a | probes | %a | probes | %a | probes | %a | probes | %a | |
| Over-expressed in UC (FDR 5%) | 1054 | 10 | 30 | 2 | 68 | 3 | 118 | 5 | 18 | 4 | 234 | 3 |
| Over-expressed in UCB (FDR 5%) | 816 | 8 | 25 | 2 | 124 | 5 | 51 | 2 | 19 | 4 | 219 | 3 |
| Total differentially expressed | 1870 | 18 | 55 | 4 | 192 | 8 | 169 | 7 | 37 | 8 | 453 | 6 |
UCB umbilical cord blood; UC umbilical cord
aPercent over-expressed probes is calculated in relation to the total number of probes of this category that are expressed in UC and UCB
A total of 10,935 exonic, 1,645 AS-TIN, 2,651 AS-PIN and 2,420 S-TIN transcripts were found to be expressed in UCB and UC samples (Table 2) and were further analyzed for differential expression as described in the next section.
Reproducibility in the microarray experiments was assessed by dye swap technical replicate using separately prepared target RNA from each MSC sample. The correlation coefficient between two microarray datasets obtained from repeated experiments was greater than 0.98, indicating that not only each microarray system per se, but also the overall experimental procedures were highly reproducible (Figure S2).
Protein-Coding Expressed Transcripts
The entire set of expressed protein-coding genes was used for a non-supervised hierarchical clustering analysis. The dendrogram in Fig. 2a evidences that MSC isolated from the same tissue (UC or UCB) clustered together, while MSC from different tissues of the same donor were found in different clusters.
Fig. 2.

Non-supervised hierarchical clustering of a all 10,935 protein-coding genes and b all 7,170 intronic noncoding RNAs, expressed in MSC from UC and UCB. Each row represents the relative levels of expression for a single gene, calculated as the number of standard deviations above (red) or below (green) the mean expression level of that gene across the samples. Each column represents the average expression of two technical replicate (Cy3 and Cy5) measurements of each sample. In a MSC isolated from the same tissue clustered together while MSC from different tissues (UC or UCB) and same donors are found in different clusters. In b MSC isolated from different tissues (UC or UCB) and the same donor clustered together while MSC from the same tissue and different donors are found in different clusters
These results indicated that gene expression profiles of MSC from the same tissue were more similar than those of MSC obtained from different tissues (UC versus UCB) of the same donor, suggesting the existence of a core gene expression profile for the MSC from each tissue, independent of the inter-donor differences.
In order to determine the statistical significance of such patterns, correlation coefficients were calculated for all possible combinations of expression measurements and a Student t-test was applied, as described below. Considering the exonic probes for protein-coding genes, the correlation coefficient among UC samples was in the range 0.899 to 0.972 (Table 3A, Figure S3 A). A similar trend was observed in the UCB group, where the correlation coefficient was in the range 0.901 to 0.955 (Figure S3 D). In contrast, the correlation coefficient between paired UC versus UCB MSC samples from the same individuals (for example, UC1 versus UCB1) was in the range 0.837 to 0.925 (Figure S3 B, C).
Table 3.
Correlation coefficients (r2) among expression profiles
| r2 within same tissue | UC vs UCB | p-value | ||
|---|---|---|---|---|
| r2 within same donor | ||||
| A) Protein-coding gene expression: analysis of correlations between MSC from UC and UCB | ||||
| UC | 0.94 ± 0.025 | 0.89 ± 0.041 | 0.026 | |
| UCB | 0.92 ± 0.019 | 0.89 ± 0.041 | 0.067 | |
| B) Noncoding gene expression: analysis of correlations between MSC from UC and UCB | ||||
| UC | 0.98 ± 0.005 | 0.99 ± 0.006 | 0.060 | |
| UCB | 0.98 ± 0.007 | 0.99 ± 0.006 | 0.029 | |
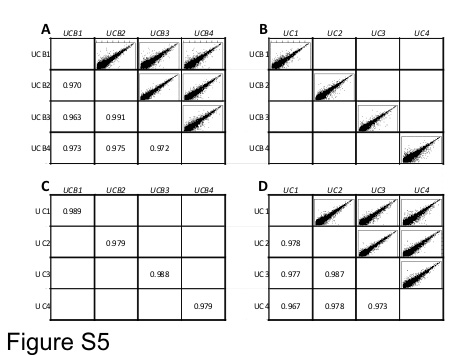
Data shown are mean ± SD from r2 values within each group (r2 data from Figure S5)
UCB umbilical cord blood; UC umbilical cord
The correlation coefficient for comparisons within UC samples (Table 3A) was significantly higher than the correlation for comparisons between UC versus UCB within the same individual (p = 0.026) (Table 3A). A similar trend was observed for the UCB samples, although this difference was not statistically significant (p = 0.067) (Table 3A).
Differential Gene Expression of Protein-Coding Genes in UC and UCB Tissues
To identify the individual gene expression signature of each group of MSC, we used a one-class paired analysis with the SAM statistical approach (Fig. 3).
Fig. 3.

Expression signature of protein-coding transcripts in MSC from UC and UCB. A total of 1,870 genes with significantly different levels among MSC from UC and UCB samples were identified by SAM one-class statistical analysis (FDR < 5%) and hierarchically clustered as described in Materials and Methods. Each row represents the relative levels of expression for a single gene, calculated as the number of standard deviations above (red) or below (green) the average expression level of that gene across the samples. Each column represents the average expression of two technical replicate (Cy3 and Cy5) measurements of each sample
A total of 1,054 different protein-coding genes were expressed at significantly higher levels in MSC from UC while 816 genes were significantly higher in MSC from UCB (Table 2). The full list of differentially expressed genes is shown in Supplemental Table 2 (Table S2).
Functional Annotation of Protein-Coding Genes Over-Expressed in MSC from UC
Genes that were found to be over-expressed in MSC from UC were functionally annotated and analyzed with two different tools. First, enriched gene ontology (GO) terms were identified with the eGOn tool. A statistically significant over-representation of genes involved in morphogenesis, cell adhesion and secretion GO categories were identified (Table S3).
Next, the Ingenuity Pathway Analysis (IPA) software was used for identifying canonical pathways that were significantly enriched. We found that the “Synaptic Long Term Depression” pathway was significantly over-represented (adjusted p-value = 0.042). A total of 17 genes out of 139 genes in this pathway were found to be over-expressed in MSC from UC. A scheme of the pathway (Figure S4) and the full list of genes involved (Table S4) are shown.
Further, we ranked genes by significance (SAM q-value) and chose the top 30 genes that were significantly more expressed in MSC from UC (Table 4). The over- expressed genes in MSC from UC included genes involved in neurogenesis, such as SYNPO2 (synaptoidin) and NRP2, and angiogenesis, such as FLT1 (vascular endothelial growth factor-VEGF).
Table 4.
Top 30 over-expressed protein-coding genes in MSC from UC
| Overexpressed in UC | |||||
|---|---|---|---|---|---|
| Entrez Gene ID | Gene Symbol | Mapping.location | Description | SAM q-value (%) | Fold Change |
| 139065 | SLITRK4 | Xq27.3 | SLIT and NTRK-like family, member 4 | 0 | 126.1 |
| 590 | BCHE | 3q26.1-q26.2 | butyrylcholinesterase | 0 | 88.4 |
| 10580 | SORBS1 | 10q23.3-q24.1 | sorbin and SH3 domain containing 1 | 0 | 57.8 |
| 10788 | IQGAP2 | 5q13.3 | IQ motif containing GTPase activating protein 2 | 0 | 53.4 |
| 2321 | FLT1 | 13q12 | fms-related tyrosine kinase 1 (vascular endothelial growth factor/vascular permeability factor receptor) | 0 | 52.7 |
| 9699 | RIMS2 | 8q22.3 | regulating synaptic membrane exocytosis 2 | 0 | 27.2 |
| 7980 | TFPI2 | 7q22 | tissue factor pathway inhibitor 2 | 0 | 25.7 |
| 25849 | DKFZP564O0823 | 4q13.3-q21.3 | DKFZP564O0823 protein | 0 | 25.4 |
| 753 | C18orf1 | 18p11.2 | chromosome 18 open reading frame 1 | 0 | 23.8 |
| 171024 | SYNPO2 | 4q26 | synaptopodin 2 | 0 | 21.1 |
| 57110 | HRASLS | 3q29 | HRAS-like suppressor | 0 | 19.9 |
| 144100 | PLEKHA7 | 11p15.1 | pleckstrin homology domain containing, family A member 7 | 0 | 19.0 |
| 244 | ANXA8 | 10q11.2 | annexin A8 | 0 | 17.4 |
| 1803 | DPP4 | 2q24.3 | dipeptidyl-peptidase 4 (CD26, adenosine deaminase complexing protein 2) | 0 | 16.8 |
| 55691 | FRMD4A | 10p13 | FERM domain containing 4A | 0 | 16.1 |
| 121551 | BTBD11 | 12q23.3 | BTB (POZ) domain containing 11 | 0 | 16.1 |
| 50507 | NOX4 | 11q14.2-q21 | NADPH oxidase 4 | 0 | 15.1 |
| 6653 | SORL1 | 11q23.2-q24.2 | sortilin-related receptor, L(DLR class) A repeats-containing | 0 | 14.9 |
| 158038 | LRRN6C | 9p21.2-p21.1 | leucine rich repeat neuronal 6C | 0 | 14.7 |
| 22998 | DKFZP686A01247 | 4p13 | hypothetical protein | 0 | 11.3 |
| 104 | ADARB1 | 21q22.3 | adenosine deaminase, RNA-specific, B1 (RED1 homolog rat) | 0 | 11.2 |
| 7163 | TPD52 | 8q21 | tumor protein D52 | 0 | 11.0 |
| 23555 | TSPAN15 | 10q21.3 | tetraspanin 15 | 0 | 10.7 |
| 55022 | FLJ20701 | 2q36.3 | hypothetical protein FLJ20701 | 0 | 9.4 |
| 8828 | NRP2 | 2q33.3 | neuropilin 2 | 0 | 9.3 |
| 54361 | WNT4 | 1p36.23-p35.1 | wingless-type MMTV integration site family, member 4 | 0 | 9.3 |
| 256435 | ST6GALNAC3 | 1p31.1 | 1,3)-N-acetylgalactosaminide alpha-2,6-sialyltransferase 3 | 0 | 9.3 |
| 5924 | RASGRF2 | 5q13 | Ras protein-specific guanine nucleotide-releasing factor 2 | 0 | 9.1 |
Functional Annotation of Protein-Coding Genes Over-Expressed in MSC from UCB
Using a method similar to the aforementioned analysis of MSC from UC, we examined the gene expression profile of MSC from UCB. Gene ontology analysis revealed a significantly higher representation of genes involved in anatomical structure development and multicellular organism development (Table S3). Using the Ingenuity Pathway Analysis (IPA) tool we could not find any significantly over-represented canonical pathway.
Among the top 30 genes that were significantly more expressed in MSC from UCB there were genes involved in osteogenesis, such as SPP1 (secreted phosphoprotein 1, osteopontin) and POSTN (periostin, osteoblast specific factor) (Table 5), and development of B-lymphoid cells, such as EBF1 and EBF3 (early B-cell factor 1, 3).
Table 5.
Top 30 over-expressed protein-coding genes in MSC from UCB
| Overexpressed in UC | |||||
|---|---|---|---|---|---|
| Entrez Gene ID | Gene Symbol | Mapping.location | Description | SAM q-value (%) | Fold Change |
| 84302 | C9orf125 | 9q31.1 | chromosome 9 open reading frame 125 | 0 | 51.5 |
| 81578 | COL21A1 | 6p12.3-p11.2 | collagen, type XXI, alpha 1 | 0 | 40.0 |
| 3679 | ITGA7 | 12q13 | integrin, alpha 7 | 0 | 28.1 |
| 79614 | C5orf23 | 5p13.3 | chromosome 5 open reading frame 23 | 0 | 25.7 |
| 2044 | EPHA5 | 4q13.1 | EPH receptor A5 | 0 | 25.0 |
| 2006 | ELN | 7q11.23 | elastin (supravalvular aortic stenosis, Williams-Beuren syndrome) | 0 | 23.9 |
| 7373 | COL14A1 | 8q23 | collagen, type XIV, alpha 1 (undulin) | 0 | 23.9 |
| 10631 | POSTN | 13q13.3 | periostin, osteoblast specific factor | 0 | 22.3 |
| 5168 | ENPP2 | 8q24.1 | ectonucleotide pyrophosphatase/phosphodiesterase 2 (autotaxin) | 0 | 16.7 |
| 5137 | PDE1C | 7p15.1-p14.3 | phosphodiesterase 1C, calmodulin-dependent 70kDa | 0 | 15.3 |
| 8839 | WISP2 | 20q12-q13.1 | WNT1 inducible signaling pathway protein 2 | 0 | 15.2 |
| 183 | AGT | 1q42-q43 | angiotensinogen (serpin peptidase inhibitor, clade A, member 8) | 0 | 14.4 |
| 8490 | RGS5 | 1q23.1 | regulator of G-protein signalling 5 | 0 | 13.9 |
| 182 | JAG1 | 20p12.1-p11.23 | jagged 1 (Alagille syndrome) | 0 | 13.1 |
| 1879 | EBF1 | 5q34 | early B-cell factor 1 | 0 | 12.5 |
| 253738 | EBF3 | 10q26.3 | early B-cell factor 3 | 0 | 12.3 |
| 2012 | EMP1 | 12p12.3 | epithelial membrane protein 1 | 0 | 11.7 |
| 6696 | SPP1 | 4q21-q25 | secreted phosphoprotein 1 (osteopontin, bone sialoprotein I, early T-lymphocyte activation 1) | 0 | 10.9 |
| 23136 | EPB41L3 | 18p11.32 | erythrocyte membrane protein band 4.1-like 3 | 0 | 10.7 |
| 3983 | ABLIM1 | 10q25 | actin binding LIM protein 1 | 0 | 10.5 |
| 3783 | KCNN4 | 19q13.2 | potassium intermediate/small conductance calciumactivated channel, subfamily N, member 4 | 0 | 10.2 |
| 342184 | FMN1 | 15q13.3 | formin 1 | 0 | 10.1 |
| 5328 | PLAU | 10q24 | plasminogen activator, urokinase | 0 | 9.2 |
| 130916 | MTERFD2 | 2q37.3 | MTERF domain containing 2 | 0 | 8.6 |
| 9510 | ADAMTS1 | 21q21.2 | ADAM metallopeptidase with thrombospondin type 1 motif, 1 | 0 | 8.5 |
| 9783 | RIMS3 | 1pter-p22.2 | regulating synaptic membrane exocytosis 3 | 0 | 7.9 |
| 57520 | HECW2 | 2q32.3-q33.1 | HECT, C2 and WW domain containing E3 ubiquitin protein ligase 2 | 0 | 7.9 |
| 4629 | MYH11 | 16p13.11 | myosin, heavy chain 11, smooth muscle | 0 | 7.8 |
| 255488 | IBRDC2 | 6p22.3 | IBR domain containing 2 | 0 | 6.8 |
Partially and Totally Intronic Noncoding Transcripts Expressed in UC and UCB Paired Samples
Table 2 shows the number of protein-coding and intronic noncoding probes expressed in all UCB and UC samples. While 80% of protein-coding messages were expressed, only 22% of antisense TIN, 54% of antisense PIN and 32% of sense TIN transcripts were expressed in the tissues. This reveals that the diversity of intronic noncoding messages was lower than that of protein-coding messages.
We looked at the overall pattern of noncoding expression using a non-supervised hierarchical clustering (Fig. 2b). One can see that the MSC isolated from different tissues of the same donor clustered together while MSC from the same tissue and different donors were found in different clusters, thus suggesting that the intraindividual intronic noncoding expression profile was less variable between MSC from UC versus UCB than among the individuals.
The correlation coefficients between the UC and UCB paired samples from the same donor were in the range 0.979–0.989 (Figure S5 B, C), while the correlation coefficients among the UCB samples from different donors were in the range 0.963–0.991 (Figure S5 A), and among UC samples in the range 0.967–0.987 (Figure S5 D). Table 3B shows that the average correlation coefficient between UC versus UCB of the same donors was significantly higher (p = 0.029) than the average correlation coefficient among MSC from UCBs of different donors. A similar comparison with the average correlation coefficient among MSC from UCs of different donors showed the same trend, although the difference was not statistically significant (p = 0.060) (Table 3B). The statistical analysis of correlation coefficients showed that the intronic noncoding expression profile was almost invariable among the individuals and even less variable between MSC from UC versus UCB of the same donor.
Using the same statistical significance analyses, a total of 4% expressed antisense PIN, 7% antisense TIN and 8% sense TIN transcripts were detected as differentially expressed between UC and UCB paired samples, while 18% protein-coding transcripts were detected as differentially expressed in these samples (Table 2). This indicates that the tissue signature of intronic noncoding expression was more similar than the protein-coding messages between the UC and UCB paired samples.
Functional Annotation of ncRNA Over-Expressed in MSC from UCB and UC
The top 33% most highly expressed TIN transcripts in each group of MSC (Table S5) were functionally annotated using Gene Ontology terms. The only statistically significant (adjusted p-value = 0.048) enriched GO categories in MSC from UC comprise genes involved in transcription, including regulation of transcription, regulation of transcription-DNA dependent, regulation of RNA metabolic process and biopolymer biosynthetic process (Table S6). The same GO categories were the most enriched ones in MSC from UCB, although this over-representation was not statistically significant (adjusted p-value = 0.153) (Table S6).
Next, the Ingenuity Pathway Analysis (IPA) software was used for identifying functions that were significantly enriched among the top 33% most highly expressed TIN transcripts in MSC from UC and UCB. Functions related to Lymphoid Tissue Structure and Development, Cellular Development and Organ Development were shared between the samples from UC and UCB, while Visual System Development and Function was only enriched in UC. The entire list of identified functions and the genes involved are shown in Supplemental Tables 7 and 8 (Tables S7 and S8).
Validation of Microarray Results with Real-Time Quantitative PCR
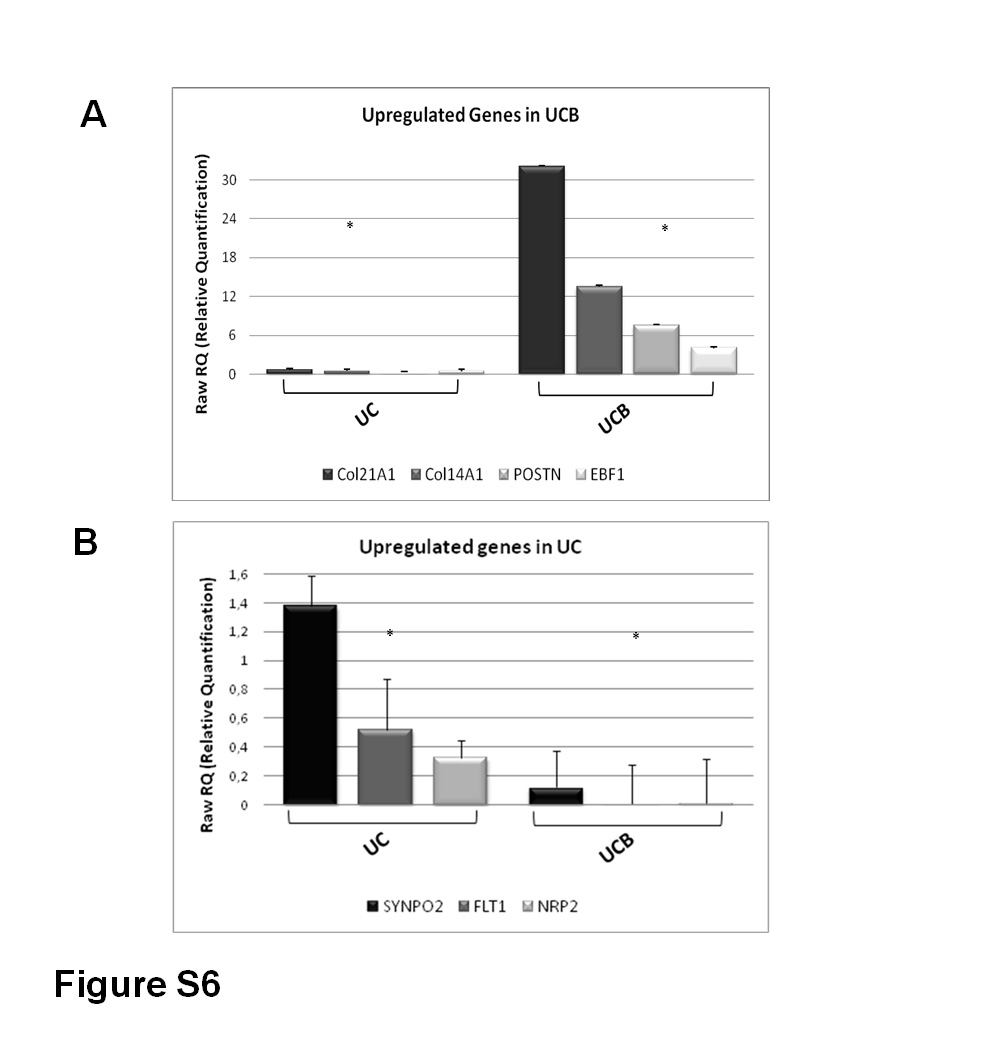
Reproducibility of our microarray results has been shown to be fairly high [37] (Figure S2). Nevertheless, we have selected seven differentially expressed genes between UC and UCB samples and assessed their expression levels in 8 UC and 6 UCB units through RT-Q-PCR. Genes analyzed were significantly differentially expressed between UC and UCB samples (p ≤ 0.05; Figure S6). The results were entirely consistent with DNA microarray data. Therefore, based on these results, we opted not to exhaustively reanalyze all genes of interest with RT-Q-PCR. In fact, recent microarray validation studies [44] have shown that the Agilent oligoarray technology, used in the present study, has been optimized to attain reproducible results.
Discussion
MSC are Isolated at Higher Yields from UC Compared with UCB
MSC have been defined by their plastic adherent growth and subsequent expansion under specific culture conditions, in addition to their in vitro differentiation potential into several cell types. Previous reports indicate that MSC can be found in perivascular niches of several organs [14–18] but they seem to be absent from the circulating blood under normal physiological conditions [17, 22]. However, their presence in UCB is controversial: some researchers successfully isolated MSC from UCB [23–25, 45], whereas others failed to isolate them or obtained a low yield [11, 22, 26, 27].
Based on a sample of 10 umbilical cord units, we had previously reported that under the same culture conditions, MSC could be obtained from all 10 UC and, in contrast, from only one UCB [11, 12]. In the present study, these results were confirmed in a larger sampling, where MSC could be obtained from all 65 UC and from only 6 UCB. They support our previous observation on the importance of banking the whole umbilical cord unit as a source of MSC.
Genomic studies have provided another dimension for a detailed understanding of the MSC biology and ontogeny. Several authors have analyzed the gene expression profile of MSC, focusing mostly on three aspects: (i) changes induced during in vitro differentiation to specific cell lineages [46–50], (ii) direct comparison of gene expression profiles in population of MSC obtained from several sources [28–31, 45], and (iii) estimation of the absolute expression levels in MSC [30, 32, 33]. However these comparative studies were performed with different lineages of MSC obtained from various sources and processed under different conditions, which introduces many variables in the analysis of global gene expression profiles. A systematic comparison of the tissue expression signature of exonic and intronic noncoding transcripts of MSC derived from related sources and from match-paired samples analyzed under the same culture conditions had not been described previously.
Intronic Noncoding Transcripts are Abundantly Expresses in MSC from UC and UCB
We identified that 35% of all intronic noncoding transcripts on the array were expressed in MSC from UC and UCB, as opposed to 80% of exonic protein-coding genes on the array (Table 2). This reflects the fact that intronic noncoding RNAs have tissue and cell-type specific expression patterns, as demonstrated by our and other groups [34–38].
Interestingly, looking at the genomic loci of the most highly expressed noncoding transcripts in MSC from UC, the only statistically significant enriched GO categories were those associated with genes involved with regulation of transcription. The pattern found in MSC from umbilical cord samples is similar to that already observed for kidney, prostate and liver [37], emphasizing the importance of noncoding RNAs in providing an additional layer of regulatory functions in a number of different tissues [37, 51].
We also showed that both lineages of MSC share the high expression of a considerable number of intronic noncoding transcripts belonging to significantly enriched shared functional categories such as Lymphoid Tissue Structure and Development, Cellular Development and Organ Development (Tables S5, S6, S7 and S8), which supports a growing body of evidence in the literature indicating that the noncoding RNAs are related to the maintenance of pluripotency and the induction of alternative differentiation programs in stem cells [34]. Recently, Efroni et al. [52] demonstrated widespread transcription in protein-coding and noncoding regions in undifferentiated embryonic stem cells, whereas the lineage specification is driven by reduction of the transcribed portion of the genome. Since the MSC from UCB and UC analyzed here are undifferentiated and shared similar characteristics and differentiation potential, it seems reasonable that the most abundantly intronic expressed transcripts are, in fact, common to most of the cells in the culture instead of being expressed by a small subset of cells.
Nevertheless, the widespread expression of noncoding RNAs in undifferentiated cells and during the differentiation process support the hypothesis that these transcripts enclose several functions related to stem cells biology and therefore need to be considered to further understanding several fundamental biological processes of development, including ontogeny.
Exonic Protein-Coding Expression Profile in MSC from UC Versus UCB
Comparative correlation coefficients of exonic protein-coding expression profiles indicated that MSC from distinct UC samples are more similar to each other than to their UCB donor counterparts. In fact, MSC from different tissues (UC versus UCB) did not cluster together, even in paired MSC samples isolated from the same subject.
Previous studies comparing MSC obtained from unrelated individuals and different sources showed controversial results; Wagner et al. [53] demonstrated significant differences in the global gene expression patterns of MSC from adipose tissue, UCB and BM. Other studies have demonstrated that MSC populations obtained from different sources might exhibit significant differences in global gene expression patterns that are likely related to their differentiation capacities [3, 31, 54, 55]. On the other hand, some authors have reported that the gene expression profile of MSC of different sources were highly similar [28, 45]. However, all these results should be regarded with caution, because the expression analysis was based on cell cultures obtained from different donors, and processed by different methodologies that might explain, at least in part, the observed diversity and/or similarity. Indeed, it had been previously reported that culture conditions have a significant impact on the gene expression profile [45]. Since the isolation of MSC is primarily based on adherence to plastic and growth under specific culture conditions, it is not surprising that culture media, the number of passages and growth factors might play a significant role in the selection of cell populations. To exclude such variables, all our experiments were performed in MSC isolated from the same donor, cultivated under the same culture conditions and processed in the same culture passage.
Despite that, our initial analysis using the entire set of expressed protein-coding genes demonstrated a significant difference in the exonic protein-coding transcript expression profiles of MSC from UC and UCB paired samples. Therefore, we have focused on the differentially expressed genes between them. Among the genes that were exclusively over-expressed in UCB are osteopontin and osteoblast specific factor, which are involved in osteogenesis. In fact, many of the integrin ligands implicated in the adherence of osteoblasts to the extracellular matrix are expressed at higher levels in MSC from UCB including type XXI and XIV collagen and alpha 7 integrin [55]. Other genes more expressed in UCB are EBF 1 and EBF 3, recognized to be transcript factors related to development of B-lymphoid cells [56]. Given that UCB could be representing the neonatal defense system against the earliest encountered pathogens, it is not surprising that the genes related to the immune system were over-expressed in MSC from UCB.
Among the genes that were exclusively or expressed at higher levels by MSC from UC is FLT1 (vascular endothelial growth factor), a growth factor recognized to be a main regulator of angiogenesis [55]. Other genes more expressed in MSC from UC include SYNPO2, NRP2, CDH2 and NPY [57–60]. All these genes could be related to neurogenesis or synaptic transmission and regulation of neurotransmitter secretion. In fact, the only significantly enriched canonical pathway related to the genes over-expressed in MSC from UC was “Synaptic Long Term Depression”, a pathway of neurophysiological processes. It has been recently shown that MSC isolated from BM also can express neuronal markers without induction [61, 62]. Alternatively, considering the anatomic position of BM, it is possible that their stroma is innervated and contains nerve terminals, which may be responsible for the expression of neuron-related proteins [31]. In any case, it will be of great interest to verify whether the differential expression of some tissue specific genes in MSC from distinct sources turns them more prone to differentiate into distinct cell lines. For example, MSC from UC, in their undifferentiated state, could be more appropriate for treatment of neurodegenerative syndromes while MSC from UCB could be more suitable for bone repair. In accordance to these findings, recent functional studies in vivo have indicated that MSC from UC may be therapeutically useful in treating central nervous systems disorders, which could be mediated by their ability to promote angiogenesis and/or neurogenesis [63–66].
Although MSC of both origins are highly similar in the noncoding transcript expression pattern, the differences in their respective protein-coding gene expression profiles might be due to the influence of the distinct local environment in which they are located, reflecting the importance of the niche in establishing the phenotype of its residing stem cells [67]. Functional classification of differentially expressed genes according to the Gene Ontology categories has demonstrated an enrichment of genes in the categories of development in UCB while cell adhesion, morphogenesis, and secretion in UC. In order to determine the role of individual genes on cell fate and differentiation potential, additional functional studies will be necessary and are currently underway.
Origin of MSC in Umbilical Cord Blood
Based on the technique used for cord blood harvesting, we had previously suggested that MSC from UCB might be derived from the umbilical cord tissue, which has been shown to be an alternative source for MSC [11]. However, results from the present study, demonstrating significant differences in the global gene expression patterns of MSC from UC and UCB paired samples, led us to suggest that these cells are not the same. The origin of MSC in UCB, however, remains to be elucidated.
Since the first report, several works have postulated that multipotent stem cells are present in the perivascular niche of various tissues [68]. The hypothesis that both hematopoietic and MSC are travelling, via cord blood, from early fetal hematopoietic sites to the newly formed bone marrow [24] suggests that MSC from UCB might be derived from the perivascular niche from fetal hematopoietic sites. The observation that the quantity of MSC in UCB decreases substantially with gestational age supports this hypothesis: the highest concentration of progenitors was observed during transition from hepatic to bone marrow hematopoiesis and the decline occurred with the termination of this process at birth [69–72]. Furthermore, several lines of evidence indicate that the MSC from UCB, liver and bone marrow are similar to those present in adult bone marrow. Despite the fact that MSC from UC and UCB are not the same cells, they may share a common origin, such as the perivascular niche.
The comparative gene expression profile observed in the present study provides additional support to this hypothesis. For example, the cluster analysis strongly indicates that MSC from UC and UCB share a close relationship based on the intronic noncoding transcripts, and this relationship may reflect their common ontogeny and differentiation status. On the other hand, clustering based on the protein-coding gene expression profiles could indicate the activation of specific sets of genes related to the tissue from which they were isolated.
Conclusion
In conclusion, we demonstrated, for the first time, that the intronic noncoding transcript expression patterns of MSC from UCB and UC paired samples are highly similar, suggesting that they share a common ontogeny and differentiation status. We showed significant differences in the protein-coding gene expression profile patterns of MSC from UC and UCB paired samples. A set of genes related to osteogenesis and immune systems was more expressed in MSC from UCB, whereas higher expression in MSC from UC tissue was observed for genes that participate in pathways related to angiogenesis and neurogenesis. These results suggest that MSC from a specific source may be more efficient for a particular therapeutic target, which may have important clinical implications. They reinforce our previous suggestion on the importance of keeping the whole umbilical cord unit by umbilical cord blood banks for research or future therapeutic uses, in addition to providing insight into MSC biology and ontogeny.
Electronic supplementary material
Below is the link to the electronic supplementary material.
Primer pairs designed for RT-Q-PCR analysis. (DOC 32 kb)
Over Expressed in UC. (DOC 2651 kb)
Classification of differentially expressed protein-coding genes according to Gene Ontology terms. (DOC 37 kb)
Canonical Pathway Synaptic - Long Term Depression Benjamini-Hochberg p-value = 0.0417 Number of molecules: 17/139. (DOC 60 kb)
Top 33% most hi ghly expressed noncoding RN As in all UC samples. (DOC 4281 kb)
Classification of the 33% most highly expressed intronic transcripts according to Gene Ontology terms. (DOC 27 kb)
Significantly enriched functional categories of intronic noncoding RNAs* over-expressed in MSC from UC. (DOC 47 kb)
Significantly enriched functional categories of intronic noncoding RNAs* over-expressed in MSC from UCB. (DOC 38 kb)
Schematic view of the 44 k gene-oriented intron-exon expression oligoarray. The figure illustrates probes for protein-coding transcripts (probes 2 and 5 above red block and red arrow), for antisense Partially Intronic Noncoding (PIN) transcripts (probe 1 below blue arrow), and for antisense and sense Totally Intronic Noncoding (TIN) transcripts (probes 3 and 4, respectively, on black arrows). (GIF 29.3 KB)
Scatter plots and correlation coefficients of the dye-swap technical replicates in UC and UCB. Note that all the correlation coefficient values were greater than 0.984, indicating the high reproducibility in the microarray experiments. (GIF 71.8 KB)
Protein-coding genes expression. Correlation analyses performed between MSC isolated from the same tissue (UC or UCB) or between MSC harvested from the same donor (for example, UC1 versus UCB1). Abbreviations: UC, umbilical cord; UCB, umbilical cord blood. The donor is identified by a number. A: Correlations and scatterplots of all UC samples; B: Scatterplots between UC and UCB of each donor. C: Correlation coefficients between UC and UCB of each donor. D: Scatterplots and correlation coefficients of all UCB samples. The correlation coefficient mean ± SD values are summarized in Table 3A. (GIF 64.7 KB)
Ingenuity Pathway Analysis has identified that the “Synaptic Long Term Depression” canonical pathway was significantly enriched (p = 0.042) among the genes found to be over-expressed in MSC from UC (marked in red). (GIF 265 KB)
Intronic noncoding expression. Correlation analyses performed between MSC isolated from the same tissue (UC or UCB) or between MSC harvested from the same donor (for example, UC1 versus UCB1). Donors are identified by different numbers. A: Correlations and scatterplots of all UC samples; B: Scatterplots between UC and UCB of each donor. C: Correlation coefficients between UC and UCB of each donor. D: Scatterplots and correlation coefficients of all UCB samples. The mean ± SD of the correlation coefficients of each group is shown in Table 3B. Abbreviations: UC, umbilical cord; UCB, umbilical cord blood. (GIF 57.1 KB)
Validation of microarray results with real-time quantitative PCR. According to microarray results, four or three genes that were upregulated in CB (A) and UC (B), respectively, were selected for further analysis with RT-Q-PCR. Results were derived from 8 UC lines and 6 UCB lines. The genes analyzed were significantly differentially expressed between the UC and UCB samples (*). Data are normalized to GAPDH expression and represented as mean ± S.E. (GIF 80.7 KB)
Acknowledgements
Collaboration of the following persons is gratefully acknowledged: members from the Jesus José e Maria and University Hospital, Paula Onofre, Maria Denise Fernandes Carvalho, Marcos Valadares, Agnes Nishimura, Cleber Trujillo, Constancia Urbani, Daniela Bueno, Roberto Fanganiello, Antonia M. P. Cerqueira, Dr. Maria Rita Passos-Bueno and Dr. Mariz Vainzof for helpful suggestions. This work was supported by a grant from CEPID-FAPESP (Centro de Pesquisa, Inovação e Difusão-Fundação de Amparo a Pesquisa do Estado de São Paulo), and by grants from FAPESP, CNPq (Conselho Nacional de Desenvolvimento Científico e Tecnológico) and INCT (Instituto Nacional de Ciência e Tecnologia).
Disclosures
The authors indicate no potential conflicts of interest.
Open Access
This article is distributed under the terms of the Creative Commons Attribution Noncommercial License which permits any noncommercial use, distribution, and reproduction in any medium, provided the original author(s) and source are credited.
Abbreviations
- MSC
Mesenchymal stem cells
- HSC
Hematopoietic stem cells
- UC
Umbilical cord
- UCB
Umbilical cord blood
- BM
Bone marrow
Footnotes
Mariane Secco and Yuri B. Moreira contributed equally to this work.
References
- 1.Gang EJ, Jeong JA, Hong SH, Hwang SH, Kim SW, Yang IH, et al. Skeletal myogenic differentiation of mesenchymal stem cells isolated from human umbilical cord blood. Stem Cells. 2004;22:617–624. doi: 10.1634/stemcells.22-4-617. [DOI] [PubMed] [Google Scholar]
- 2.Karahuseyinoglu S, Cinar O, Kilic E, Kara F, Akay GG, Demiralp DO, et al. Biology of stem cells in human umbilical cord stroma: in situ and in vitro surveys. Stem Cells. 2007;25:319–331. doi: 10.1634/stemcells.2006-0286. [DOI] [PubMed] [Google Scholar]
- 3.Kern S, Eichler H, Stoeve J, Kluter H, Bieback K. Comparative analysis of mesenchymal stem cells from bone marrow, umbilical cord blood, or adipose tissue. Stem Cells. 2006;24:1294–1301. doi: 10.1634/stemcells.2005-0342. [DOI] [PubMed] [Google Scholar]
- 4.Zuk PA, Zhu M, Ashjian P, De Ugarte DA, Huang JI, Mizuno H, et al. Human adipose tissue is a source of multipotent stem cells. Mol Biol Cell. 2002;13:4279–4295. doi: 10.1091/mbc.E02-02-0105. [DOI] [PMC free article] [PubMed] [Google Scholar]
- 5.Vieira NM, Brandalise V, Zucconi E, Jazedje T, Secco M, Nunes VA, et al. Human multipotent adipose-derived stem cells restore dystrophin expression of Duchenne skeletal-muscle cells in vitro. Biol Cell. 2008;100:231–241. doi: 10.1042/BC20070102. [DOI] [PubMed] [Google Scholar]
- 6.Vieira NM, Bueno CR, Jr, Brandalise V, Moraes LV, Zucconi E, Secco M, et al. SJL dystrophic mice express a significant amount of human muscle proteins following systemic delivery of human adipose-derived stromal cells without immunosuppression. Stem Cells. 2008;26:2391–2398. doi: 10.1634/stemcells.2008-0043. [DOI] [PubMed] [Google Scholar]
- 7.Kerkis I, Kerkis A, Dozortsev D, Stukart-Parsons GC, Gomes Massironi SM, Pereira LV, et al. Isolation and characterization of a population of immature dental pulp stem cells expressing OCT-4 and other embryonic stem cell markers. Cells Tissues Organs. 2006;184:105–116. doi: 10.1159/000099617. [DOI] [PubMed] [Google Scholar]
- 8.Gronthos S, Brahim J, Li W, Fisher LW, Cherman N, Boyde A, et al. Stem cell properties of human dental pulp stem cells. J Dent Res. 2002;81:531–535. doi: 10.1177/154405910208100806. [DOI] [PubMed] [Google Scholar]
- 9.Jiang Y, Jahagirdar BN, Reinhardt RL, Schwartz RE, Keene CD, Ortiz-Gonzalez XR, et al. Pluripotency of mesenchymal stem cells derived from adult marrow. Nature. 2002;418:41–49. doi: 10.1038/nature00870. [DOI] [PubMed] [Google Scholar]
- 10.Lee OK, Kuo TK, Chen WM, Lee KD, Hsieh SL, Chen TH. Isolation of multipotent mesenchymal stem cells from umbilical cord blood. Blood. 2004;103:1669–1675. doi: 10.1182/blood-2003-05-1670. [DOI] [PubMed] [Google Scholar]
- 11.Secco M, Zucconi E, Vieira NM, Fogaca LL, Cergueira A, Carvalho MD, et al. Multipotent stem cells from umbilical cord: cord is richer than blood! Stem Cells. 2008;26:146–150. doi: 10.1634/stemcells.2007-0381. [DOI] [PubMed] [Google Scholar]
- 12.Secco M, Zucconi E, Vieira NM, Fogaca LL, Cergueira A, Carvalho MD, et al. Mesenchymal stem cells from umbilical cord: do not discard the cord! Neuromuscul Disord. 2008;18:17–18. doi: 10.1016/j.nmd.2007.11.003. [DOI] [PubMed] [Google Scholar]
- 13.Zuk PA, Zhu M, Mizuno H, Huang J, Futrell JW, Katz AJ, et al. Multilineage cells from human adipose tissue: implications for cell-based therapies. Tissue Eng. 2001;7:211–228. doi: 10.1089/107632701300062859. [DOI] [PubMed] [Google Scholar]
- 14.Covas DT, Panepucci RA, Fontes AM, Jr Silva WA, Orellana MD, Freitas MC, et al. Multipotent mesenchymal stromal cells obtained from diverse human tissues share functional properties and gene-expression profile with CD146+ perivascular cells and fibroblasts. Exp Hematol. 2008;36:642–654. doi: 10.1016/j.exphem.2007.12.015. [DOI] [PubMed] [Google Scholar]
- 15.Crisan M, Yap S, Casteilla L, Chen C-W, Corselli M, Park TS, et al. A perivascular origin for mesenchymal stem cells in multiple human organs. Cell Stem Cell. 2008;3:301–313. doi: 10.1016/j.stem.2008.07.003. [DOI] [PubMed] [Google Scholar]
- 16.da Silva Meirelles L, Caplan AI, Nardi NB. In search of the in vivo identity of mesenchymal stem cells. Stem Cells. 2008;26:2287–2299. doi: 10.1634/stemcells.2007-1122. [DOI] [PubMed] [Google Scholar]
- 17.da Silva Meirelles L, Chagastelles PC, Nardi NB. Mesenchymal stem cells reside in virtually all post-natal organs and tissues. J Cell Sci. 2006;119:2204–2213. doi: 10.1242/jcs.02932. [DOI] [PubMed] [Google Scholar]
- 18.da Silva Meirelles, L., Sand, T. T., Harman, R. J., Lennon, D. P., & Caplan, A. I. (2008). MSC Frequency Correlates with Blood Vessel Density in Equine Adipose Tissue. Tissue Eng Part A. [DOI] [PMC free article] [PubMed]
- 19.Young HE, Ceballos EM, Smith JC, Mancini ML, Wright RP, Ragan BL, et al. Pluripotent mesenchymal stem cells reside within avian connective tissue matrices. In Vitro Cell Dev Biol Anim. 1993;29A:723–736. doi: 10.1007/BF02631429. [DOI] [PubMed] [Google Scholar]
- 20.Young HE, Mancini ML, Wright RP, Smith JC, Jr Black AC, Reagan CR, et al. Mesenchymal stem cells reside within the connective tissues of many organs. Dev Dyn. 1995;202:137–144. doi: 10.1002/aja.1002020205. [DOI] [PubMed] [Google Scholar]
- 21.Pate DW, Southerland S, Grande DA, Young HE, Lucas PA. Isolation and differentiation of mesenchymal stem cells from rabbit muscle. Surg Forum. 1993;XLIV:587. [Google Scholar]
- 22.Wexler SA, Donaldson C, Denning-Kendall P, Rice C, Bradley B, Hows JM. Adult bone marrow is a rich source of human mesenchymal ‘stem’ cells but umbilical cord and mobilized adult blood are not. Br J Haematol. 2003;121:368–374. doi: 10.1046/j.1365-2141.2003.04284.x. [DOI] [PubMed] [Google Scholar]
- 23.Bieback K, Kern S, Kluter H, Eichler H. Critical parameters for the isolation of mesenchymal stem cells from umbilical cord blood. Stem Cells. 2004;22:625–634. doi: 10.1634/stemcells.22-4-625. [DOI] [PubMed] [Google Scholar]
- 24.Erices A, Conget P, Minguell JJ. Mesenchymal progenitor cells in human umbilical cord blood. Br J Haematol. 2000;109:235–242. doi: 10.1046/j.1365-2141.2000.01986.x. [DOI] [PubMed] [Google Scholar]
- 25.Goodwin HS, Bicknese AR, Chien SN, Bogucki BD, Quinn CO, Wall DA. Multilineage differentiation activity by cells isolated from umbilical cord blood: expression of bone, fat, and neural markers. Biol Blood Marrow Transplant. 2001;7:581–588. doi: 10.1053/bbmt.2001.v7.pm11760145. [DOI] [PubMed] [Google Scholar]
- 26.Mareschi K, Biasin E, Piacibello W, Aglietta M, Madon E, Fagioli F. Isolation of human mesenchymal stem cells: bone marrow versus umbilical cord blood. Haematologica. 2001;86:1099–1100. [PubMed] [Google Scholar]
- 27.Romanov YA, Svintsitskaya VA, Smirnov VN. Searching for alternative sources of postnatal human mesenchymal stem cells: candidate MSC-like cells from umbilical cord. Stem Cells. 2003;21:105–110. doi: 10.1634/stemcells.21-1-105. [DOI] [PubMed] [Google Scholar]
- 28.Jiang Y, Vaessen B, Lenvik T, Blackstad M, Reyes M, Verfaillie CM. Multipotent progenitor cells can be isolated from postnatal murine bone marrow, muscle, and brain. Exp Hematol. 2002;30:896–904. doi: 10.1016/S0301-472X(02)00869-X. [DOI] [PubMed] [Google Scholar]
- 29.Majumdar MK, Thiede MA, Mosca JD, Moorman M, Gerson SL. Phenotypic and functional comparison of cultures of marrow-derived mesenchymal stem cells (MSCs) and stromal cells. J Cell Physiol. 1998;176:57–66. doi: 10.1002/(SICI)1097-4652(199807)176:1<57::AID-JCP7>3.0.CO;2-7. [DOI] [PubMed] [Google Scholar]
- 30.Tremain N, Korkko J, Ibberson D, Kopen GC, DiGirolamo C, Phinney DG. MicroSAGE analysis of 2, 353 expressed genes in a single cell-derived colony of undifferentiated human mesenchymal stem cells reveals mRNAs of multiple cell lineages. Stem Cells. 2001;19:408–418. doi: 10.1634/stemcells.19-5-408. [DOI] [PubMed] [Google Scholar]
- 31.Tsai MS, Hwang SM, Chen KD, Lee YS, Hsu LW, Chang YJ, et al. Functional network analysis of the transcriptomes of mesenchymal stem cells derived from amniotic fluid, amniotic membrane, cord blood, and bone marrow. Stem Cells. 2007;25:2511–2523. doi: 10.1634/stemcells.2007-0023. [DOI] [PubMed] [Google Scholar]
- 32.Jia L, Young MF, Powell J, Yang L, Ho NC, Hotchkiss R, et al. Gene expression profile of human bone marrow stromal cells: high-throughput expressed sequence tag sequencing analysis. Genomics. 2002;79:7–17. doi: 10.1006/geno.2001.6683. [DOI] [PubMed] [Google Scholar]
- 33.Wieczorek G, Steinhoff C, Schulz R, Scheller M, Vingron M, Ropers HH, et al. Gene expression profile of mouse bone marrow stromal cells determined by cDNA microarray analysis. Cell Tissue Res. 2003;311:227–237. doi: 10.1007/s00441-002-0671-3. [DOI] [PubMed] [Google Scholar]
- 34.Dinger ME, Amaral PP, Mercer TR, Pang KC, Bruce SJ, Gardiner BB, et al. Long noncoding RNAs in mouse embryonic stem cell pluripotency and differentiation. Genome Res. 2008;18:1433–1445. doi: 10.1101/gr.078378.108. [DOI] [PMC free article] [PubMed] [Google Scholar]
- 35.Brito GC, Fachel AA, Vettore AL, Vignal GM, Gimba ER, Campos FS, et al. Identification of protein-coding and intronic noncoding RNAs down-regulated in clear cell renal carcinoma. Mol Carcinog. 2008;47:757–767. doi: 10.1002/mc.20433. [DOI] [PubMed] [Google Scholar]
- 36.Mercer TR, Dinger ME, Sunkin SM, Mehler MF, Mattick JS. Specific expression of long noncoding RNAs in the mouse brain. Proc Natl Acad Sci U S A. 2008;105:716–721. doi: 10.1073/pnas.0706729105. [DOI] [PMC free article] [PubMed] [Google Scholar]
- 37.Nakaya HI, Amaral PP, Louro R, Lopes A, Fachel AA, Moreira YB, et al. Genome mapping and expression analyses of human intronic noncoding RNAs reveal tissue-specific patterns and enrichment in genes related to regulation of transcription. Genome Biol. 2007;8:R43. doi: 10.1186/gb-2007-8-3-r43. [DOI] [PMC free article] [PubMed] [Google Scholar]
- 38.Birney E, Stamatoyannopoulos JA, Dutta A, Guigo R, Gingeras TR, Margulies EH, et al. Identification and analysis of functional elements in 1% of the human genome by the ENCODE pilot project. Nature. 2007;447:799–816. doi: 10.1038/nature05874. [DOI] [PMC free article] [PubMed] [Google Scholar]
- 39.Yan MD, Hong CC, Lai GM, Cheng AL, Lin YW, Chuang SE. Identification and characterization of a novel gene Saf transcribed from the opposite strand of Fas. Hum Mol Genet. 2005;14:1465–1474. doi: 10.1093/hmg/ddi156. [DOI] [PubMed] [Google Scholar]
- 40.Ebralidze AK, Guibal FC, Steidl U, Zhang P, Lee S, Bartholdy B, et al. PU.1 expression is modulated by the balance of functional sense and antisense RNAs regulated by a shared cis-regulatory element. Genes Dev. 2008;22:2085–2092. doi: 10.1101/gad.1654808. [DOI] [PMC free article] [PubMed] [Google Scholar]
- 41.Hill AE, Hong JS, Wen H, Teng L, McPherson DT, McPherson SA, et al. Micro-RNA-like effects of complete intronic sequences. Front Biosci. 2006;11:1998–2006. doi: 10.2741/1941. [DOI] [PubMed] [Google Scholar]
- 42.Tusher VG, Tibshirani R, Chu G. Significance analysis of microarrays applied to the ionizing radiation response. Proc Natl Acad Sci U S A. 2001;98:5116–5121. doi: 10.1073/pnas.091062498. [DOI] [PMC free article] [PubMed] [Google Scholar]
- 43.Beisvag V, Junge FK, Bergum H, Jolsum L, Lydersen S, Gunther C-C, et al. GeneTools—application for functional annotation and statistical hypothesis testing. BMC Bioinformatics. 2006;7:470. doi: 10.1186/1471-2105-7-470. [DOI] [PMC free article] [PubMed] [Google Scholar]
- 44.Shi L, Reid LH, Jones WD, Shippy R, Warrington JA, Baker SC, et al. The MicroArray Quality Control (MAQC) project shows inter- and intraplatform reproducibility of gene expression measurements. Nat Biotechnol. 2006;24:1151–1161. doi: 10.1038/nbt1239. [DOI] [PMC free article] [PubMed] [Google Scholar]
- 45.Lee RH, Kim B, Choi I, Kim H, Choi H, Suh K, et al. Characterization and expression analysis of mesenchymal stem cells from human bone marrow and adipose tissue. Cell Physiol Biochem. 2004;14:311–324. doi: 10.1159/000080341. [DOI] [PubMed] [Google Scholar]
- 46.Doi M, Nagano A, Nakamura Y. Genome-wide screening by cDNA microarray of genes associated with matrix mineralization by human mesenchymal stem cells in vitro. Biochem Biophys Res Commun. 2002;290:381–390. doi: 10.1006/bbrc.2001.6196. [DOI] [PubMed] [Google Scholar]
- 47.Nakamura T, Shiojima S, Hirai Y, Iwama T, Tsuruzoe M, Hirasawa A, et al. Temporal gene expression changes during adipogenesis in human mesenchymal stem cells. Biochem Biophys Res Commun. 2003;303:306–312. doi: 10.1016/S0006-291X(03)00325-5. [DOI] [PubMed] [Google Scholar]
- 48.Qi H, Aguiar DJ, Williams SM, La Pean A, Pan W, Verfaillie CM. Identification of genes responsible for osteoblast differentiation from human mesodermal progenitor cells. Proc Natl Acad Sci U S A. 2003;100:3305–3310. doi: 10.1073/pnas.0532693100. [DOI] [PMC free article] [PubMed] [Google Scholar]
- 49.Sekiya I, Larson BL, Vuoristo JT, Cui JG, Prockop DJ. Adipogenic differentiation of human adult stem cells from bone marrow stroma (MSCs) J Bone Miner Res. 2004;19:256–264. doi: 10.1359/JBMR.0301220. [DOI] [PubMed] [Google Scholar]
- 50.Sekiya I, Vuoristo JT, Larson BL, Prockop DJ. In vitro cartilage formation by human adult stem cells from bone marrow stroma defines the sequence of cellular and molecular events during chondrogenesis. Proc Natl Acad Sci U S A. 2002;99:4397–4402. doi: 10.1073/pnas.052716199. [DOI] [PMC free article] [PubMed] [Google Scholar]
- 51.Louro R, Smirnova AS, Verjovski-Almeida S. Long intronic noncoding RNA transcription: expression noise or expression choice? Genomics. 2009;93:291–298. doi: 10.1016/j.ygeno.2008.11.009. [DOI] [PubMed] [Google Scholar]
- 52.Efroni S, Duttagupta R, Cheng J, Dehghani H, Hoeppner DJ, Dash C, et al. Global transcription in pluripotent embryonic stem cells. Cell Stem Cell. 2008;2:437–447. doi: 10.1016/j.stem.2008.03.021. [DOI] [PMC free article] [PubMed] [Google Scholar]
- 53.Wagner W, Wein F, Seckinger A, Frankhauser M, Wirkner U, Krause U, et al. Comparative characteristics of mesenchymal stem cells from human bone marrow, adipose tissue, and umbilical cord blood. Exp Hematol. 2005;33:1402–1416. doi: 10.1016/j.exphem.2005.07.003. [DOI] [PubMed] [Google Scholar]
- 54.Chang YJ, Shih DT, Tseng CP, Hsieh TB, Lee DC, Hwang SM. Disparate mesenchyme-lineage tendencies in mesenchymal stem cells from human bone marrow and umbilical cord blood. Stem Cells. 2006;24:679–685. doi: 10.1634/stemcells.2004-0308. [DOI] [PubMed] [Google Scholar]
- 55.Panepucci RA, Siufi JL, Silva WA, Jr, Proto-Sequiera R, Neder L, Orellana M, et al. Comparison of gene expression of umbilical cord vein and bone marrow-derived mesenchymal stem cells. Stem Cells. 2004;22:1263–1278. doi: 10.1634/stemcells.2004-0024. [DOI] [PubMed] [Google Scholar]
- 56.Bond HM, Mesuraca M, Carbone E, Bonelli P, Agosti V, Amodio N, et al. Early hematopoietic zinc finger protein (EHZF), the human homolog to mouse Evi3, is highly expressed in primitive human hematopoietic cells. Blood. 2004;103:2062–2070. doi: 10.1182/blood-2003-07-2388. [DOI] [PubMed] [Google Scholar]
- 57.Agasse F, Bernardino L, Kristiansen H, Christiansen SH, Ferreira R, Silva B, et al. Neuropeptide Y promotes neurogenesis in murine subventricular zone. Stem Cells. 2008;26:1636–1645. doi: 10.1634/stemcells.2008-0056. [DOI] [PubMed] [Google Scholar]
- 58.Ara J, Bannerman P, Shaheen F, Pleasure DE. Schwann cell-autonomous role of neuropilin-2. J Neurosci Res. 2005;79:468–475. doi: 10.1002/jnr.20370. [DOI] [PubMed] [Google Scholar]
- 59.Lim ST, Lim KC, Giuliano RE, Federoff HJ. Temporal and spatial localization of nectin-1 and l-afadin during synaptogenesis in hippocampal neurons. J Comp Neurol. 2008;507:1228–1244. doi: 10.1002/cne.21608. [DOI] [PubMed] [Google Scholar]
- 60.Duband JL, Volberg T, Sabanay I, Thiery JP, Geiger B. Spatial and temporal distribution of the adherens-junction-associated adhesion molecule A-CAM during avian embryogenesis. Development. 1988;103:325–344. doi: 10.1242/dev.103.2.325. [DOI] [PubMed] [Google Scholar]
- 61.Blondheim NR, Levy YS, Ben-Zur T, Burshtein A, Cherlow T, Kan I, et al. Human mesenchymal stem cells express neural genes, suggesting a neural predisposition. Stem Cells Dev. 2006;15:141–164. doi: 10.1089/scd.2006.15.141. [DOI] [PubMed] [Google Scholar]
- 62.Tondreau T, Lagneaux L, Dejeneffe M, Massy M, Mortier C, Delforge A, et al. Bone marrow-derived mesenchymal stem cells already express specific neural proteins before any differentiation. Differentiation. 2004;72:319–326. doi: 10.1111/j.1432-0436.2004.07207003.x. [DOI] [PubMed] [Google Scholar]
- 63.Weiss ML, Medicetty S, Bledsoe AR, Rachakatla RS, Choi M, Merchav S, et al. Human umbilical cord matrix stem cells: preliminary characterization and effect of transplantation in a rodent model of Parkinson’s disease. Stem Cells. 2006;24:781–792. doi: 10.1634/stemcells.2005-0330. [DOI] [PubMed] [Google Scholar]
- 64.Fu YS, Cheng YC, Lin MY, Cheng H, Chu PM, Chou SC, et al. Conversion of human umbilical cord mesenchymal stem cells in Wharton’s jelly to dopaminergic neurons in vitro: potential therapeutic application for Parkinsonism. Stem Cells. 2006;24:115–124. doi: 10.1634/stemcells.2005-0053. [DOI] [PubMed] [Google Scholar]
- 65.Chen MY, Lie PC, Li ZL, Wei X. Endothelial differentiation of Wharton’s jelly-derived mesenchymal stem cells in comparison with bone marrow-derived mesenchymal stem cells. Exp Hematol. 2009;37:629–640. doi: 10.1016/j.exphem.2009.02.003. [DOI] [PubMed] [Google Scholar]
- 66.Liao W, Xie J, Zhong J, Liu Y, Du L, Zhou B, et al. Therapeutic effect of human umbilical cord multipotent mesenchymal stromal cells in a rat model of stroke. Transplantation. 2009;87:350–359. doi: 10.1097/TP.0b013e318195742e. [DOI] [PubMed] [Google Scholar]
- 67.Fuchs E, Tumbar T, Guasch G. Socializing with the neighbors: stem cells and their niche. Cell. 2004;116:769–778. doi: 10.1016/S0092-8674(04)00255-7. [DOI] [PubMed] [Google Scholar]
- 68.Abedin M, Tintut Y, Demer LL. Mesenchymal stem cells and the artery wall. Circ Res. 2004;95:671–676. doi: 10.1161/01.RES.0000143421.27684.12. [DOI] [PubMed] [Google Scholar]
- 69.Campagnoli C, Roberts IA, Kumar S, Bennett PR, Bellantuono I, Fisk NM. Identification of mesenchymal stem/progenitor cells in human first-trimester fetal blood, liver, and bone marrow. Blood. 2001;98:2396–2402. doi: 10.1182/blood.V98.8.2396. [DOI] [PubMed] [Google Scholar]
- 70.Christensen JL, Wright DE, Wagers AJ, Weissman IL. Circulation and chemotaxis of fetal hematopoietic stem cells. PLoS Biol. 2004;2:E75. doi: 10.1371/journal.pbio.0020075. [DOI] [PMC free article] [PubMed] [Google Scholar]
- 71.Surbek DV, Holzgreve W, Jansen W, Heim D, Garritsen H, Nissen C, et al. Quantitative immunophenotypic characterization, cryopreservation, and enrichment of second- and third-trimester human fetal cord blood hematopoietic stem cells (progenitor cells) Am J Obstet Gynecol. 1998;179:1228–1233. doi: 10.1016/S0002-9378(98)70137-1. [DOI] [PubMed] [Google Scholar]
- 72.Wyrsch A, dalle Carbonare V, Jansen W, Chklovskaia E, Nissen C, Surbek D, et al. Umbilical cord blood from preterm human fetuses is rich in committed and primitive hematopoietic progenitors with high proliferative and self-renewal capacity. Exp Hematol. 1999;27:1338–1345. doi: 10.1016/S0301-472X(99)00059-4. [DOI] [PubMed] [Google Scholar]
Associated Data
This section collects any data citations, data availability statements, or supplementary materials included in this article.
Supplementary Materials
Primer pairs designed for RT-Q-PCR analysis. (DOC 32 kb)
Over Expressed in UC. (DOC 2651 kb)
Classification of differentially expressed protein-coding genes according to Gene Ontology terms. (DOC 37 kb)
Canonical Pathway Synaptic - Long Term Depression Benjamini-Hochberg p-value = 0.0417 Number of molecules: 17/139. (DOC 60 kb)
Top 33% most hi ghly expressed noncoding RN As in all UC samples. (DOC 4281 kb)
Classification of the 33% most highly expressed intronic transcripts according to Gene Ontology terms. (DOC 27 kb)
Significantly enriched functional categories of intronic noncoding RNAs* over-expressed in MSC from UC. (DOC 47 kb)
Significantly enriched functional categories of intronic noncoding RNAs* over-expressed in MSC from UCB. (DOC 38 kb)
Schematic view of the 44 k gene-oriented intron-exon expression oligoarray. The figure illustrates probes for protein-coding transcripts (probes 2 and 5 above red block and red arrow), for antisense Partially Intronic Noncoding (PIN) transcripts (probe 1 below blue arrow), and for antisense and sense Totally Intronic Noncoding (TIN) transcripts (probes 3 and 4, respectively, on black arrows). (GIF 29.3 KB)
Scatter plots and correlation coefficients of the dye-swap technical replicates in UC and UCB. Note that all the correlation coefficient values were greater than 0.984, indicating the high reproducibility in the microarray experiments. (GIF 71.8 KB)
Protein-coding genes expression. Correlation analyses performed between MSC isolated from the same tissue (UC or UCB) or between MSC harvested from the same donor (for example, UC1 versus UCB1). Abbreviations: UC, umbilical cord; UCB, umbilical cord blood. The donor is identified by a number. A: Correlations and scatterplots of all UC samples; B: Scatterplots between UC and UCB of each donor. C: Correlation coefficients between UC and UCB of each donor. D: Scatterplots and correlation coefficients of all UCB samples. The correlation coefficient mean ± SD values are summarized in Table 3A. (GIF 64.7 KB)
Ingenuity Pathway Analysis has identified that the “Synaptic Long Term Depression” canonical pathway was significantly enriched (p = 0.042) among the genes found to be over-expressed in MSC from UC (marked in red). (GIF 265 KB)
Intronic noncoding expression. Correlation analyses performed between MSC isolated from the same tissue (UC or UCB) or between MSC harvested from the same donor (for example, UC1 versus UCB1). Donors are identified by different numbers. A: Correlations and scatterplots of all UC samples; B: Scatterplots between UC and UCB of each donor. C: Correlation coefficients between UC and UCB of each donor. D: Scatterplots and correlation coefficients of all UCB samples. The mean ± SD of the correlation coefficients of each group is shown in Table 3B. Abbreviations: UC, umbilical cord; UCB, umbilical cord blood. (GIF 57.1 KB)
Validation of microarray results with real-time quantitative PCR. According to microarray results, four or three genes that were upregulated in CB (A) and UC (B), respectively, were selected for further analysis with RT-Q-PCR. Results were derived from 8 UC lines and 6 UCB lines. The genes analyzed were significantly differentially expressed between the UC and UCB samples (*). Data are normalized to GAPDH expression and represented as mean ± S.E. (GIF 80.7 KB)