Abstract
Dendritic cells (DCs) in lymphoid tissue arise from precursors that also produce monocytes and plasmacytoid DCs (pDCs). Where DC and monocyte lineage commitment occurs and the nature of the DC precursor that migrates from the bone marrow to peripheral lymphoid organs is unknown. We show that DC development progresses from the macrophage and DC precursor (MDP), to common DC precursors (CDPs) that give rise to pDCs and classical spleen DCs (cDCs), but not monocytes, and finally to committed precursors of cDCs (pre-cDCs). Pre-cDCs enter lymph nodes through and migrate along HEVs and later disperse and integrate into the DC network. Further cDC development involves cell division, controlled in part by regulatory T cells (Treg) and fms-related tyrosine kinase-3 (Flt3).
Dendritic cells (DCs) are immune cells specialized to capture, process and present antigens to T lymphocytes to induce immunity or tolerance (1). Where commitment to DC development takes place, at what stage the monocyte lineage diverges from DCs, and the precise nature of the migrating DC precursor that moves from the bone marrow to the peripheral lymphoid organs is not known. These questions have been difficult to resolve in part because DC subsets are functionally and phenotypically diverse (2). For example, classical spleen DCs (cDCs) include two major functionally distinct subsets distinguished by the expression of a variety of C-type lectins and CD8 (2-4). Spleen and other tissues also contain plasmacytoid DCs (pDCs) that primarily initiate immune responses to nucleic acids (5, 6).
Lymphoid tissue cDCs, pDCs, and monocytes share a common progenitor called the macrophage and DC precursor (MDP) identified by its surface phenotype (Lin− cKithi CD115+ CX3CR1+ Flt3+) (7, 8), whereas a distinct progenitor called the common DC precursor (CDP) (Lin− cKitlo CD115+ Flt3+) is restricted to producing cDCs and pDCs (9, 10). Although monocytes can develop many of the phenotypic features of DCs under inflammatory conditions (11-13), the cDC, pDC and monocyte lineages separate by the time they reach tissues and neither monocytes nor pDCs develop into cDCs under steady state conditions (8, 14). Unlike monocytes and pDCs, cDCs in lymphoid tissues are thought to emerge from the bone marrow as immature cells that must further differentiate and divide in lymphoid organs (15, 16). Consistent with this idea, pre-cDCs that are restricted to the cDC lineage were isolated from the spleen and bone marrow cultures containing fms-related tyrosine kinase 3-ligand (Flt3-L) (17, 18). However, the relationship between MDP, CDP and pre-cDC in vivo and the question of where the monocyte, pDC and cDC lineages split, has not been addressed (10, 14, 18).
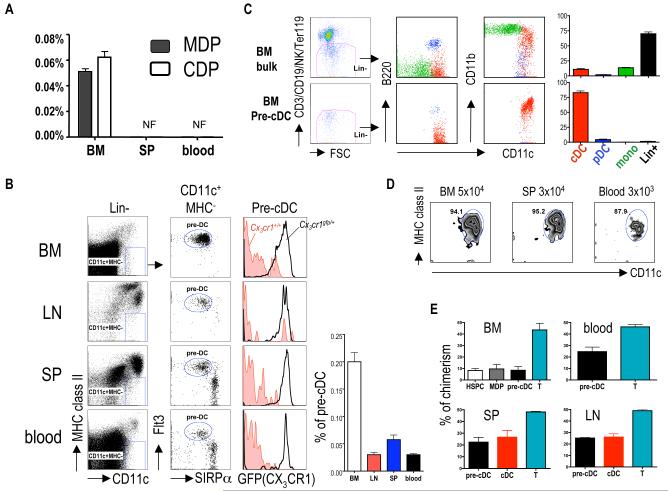
We searched for MDPs and CDPs in the blood and spleen by flow cytometry but could only detect them in the bone marrow (Fig. 1A and Fig. S1). Although pre-cDCs can be identified in the spleen by combining density centrifugation and flow cytometry (18), we speculated that these cells could be identified directly by expression of Flt3 and the chemokine receptor, CX3CR1, which are expressed on other DC progenitors and also on mature cDCs (7, 10, 19). Indeed, we found a small but distinct population of lineage negative CD11c+ MHC class II− SIRP-αint Flt3+ cells (pre-cDCs) in the bone marrow (0.2%), blood (0.03%), spleen (0.05%) and lymph nodes (LN) (0.03%) (Fig. 1B).
Fig. 1.
Isolation of pre-cDCs. (A) Presence of MDPs and CDPs in the bone marrow (BM), blood or spleen (SP); not found (NF). (B) Identification of pre-cDCs in bone marrow, LNs, spleen and blood. Bar graph shows the percentage of pre-cDC in each organ. 1×10⁶ cells were acquired per sample. Lin: CD3/CD19/Ter119/NK1.1/B220. (C) Donor-derived spleen cells (CD45.2+) were analyzed for cDC (CD11c+ MHC class II+), pDC (CD11cint B220+) and monocytes (CD11b+ CD11clo/−) 7 days after intravenous injection of 2×10⁶ bone marrow cells or 1×10⁵ pre-cDCs. (D) Analysis of donor-derived splenocytes after transfer with the indicated number of pre-cDCs from bone marrow, spleen and blood. (E) Chimerism in parabiotic mice. In (B) and (C) left side shows representative dot plots. Bar graphs summarize 2-4 independent experiments with 3-4 mice each. Error bars represent the mean ± SEM.
To determine whether pre-cDCs develop into cDCs in vivo we compared them to unfractionated bone marrow cells in adoptive transfer experiments. After seven days, unfractionated bone marrow gave rise to cDCs (10.2 ±1.2%), pDCs (1.9± 0.7%) and monocytes (13.5 ± 2.1%); in contrast, pre-cDCs from bone marrow, blood or spleen yielded predominantly cDCs (88-95%) (Fig. 1, C and D and fig. S2). These data indicate that pre-cDCs are indeed precursors to cDCs that arise in the bone marrow. They are restricted to the cDC lineage, with reduced potential to produce monocytes or other lymphoid cells, including B, T and natural killer (NK) cells (fig. S3). Pre-cDCs give rise to CD8− and CD8+ DCs but at slightly different ratios than present in the unperturbed steady state (Fig. S3).
Although the circulating pre-cDC had not been identified, parabiosis experiments suggested that they should be unequally exchanged between mice that share blood circulation because of their short half-life in the blood (15). To test this idea, we measured the exchange of cDCs and pre-cDCs in the bone marrow, blood, spleen and LNs fifty weeks after parabiosis. We found incomplete (24%) chimerism of pre-cDCs in the blood and peripheral lymphoid organs even after prolonged parabiosis (Fig. 1E). We conclude that pre-cDCs arise from progenitors in the bone marrow and travel through the blood to peripheral lymphoid organs where they further differentiate into cDCs.
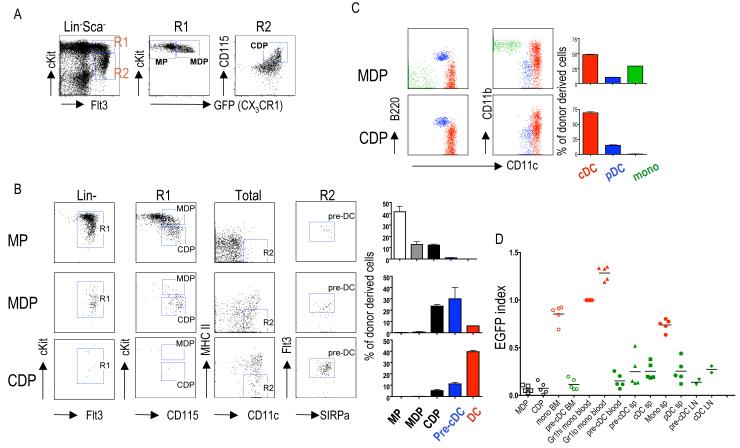
To determine the relationship between pre-cDCs and other reported DC progenitors, we fractionated bone marrow cells from Cx3cr1gfp/+ reporter mice. In addition to MDPs (7), and CDPs (9, 10), we included an earlier developmental stage termed myeloid progenitors (MPs) (Fig. 2A and fig. S2) (19). To determine the precursor-progeny relationship between MP, MDP, CDP and pre-cDC we performed adoptive transfer experiments of purified progenitors into the bone marrow of unirradiated 3-4 week old recipient mice (8, 10). Two days after transfer, MPs gave rise to MDPs, CDPs and pre-cDCs whereas MDPs only generated CDPs and pre-cDCs (Fig. 2B). Furthermore, at this early time point, CDPs produced only pre-cDCs (Fig. 2B). As previously reported, seven days after transfer MDPs produced cDCs, pDCs and monocytes, while CDPs gave rise to pDCs and cDCs but not monocytes (Fig. 2C, fig. S4, fig. S5 and (8-10)). Thus, MPs give rise to MDPs, which produce monocytes and CDPs. CDPs are further restricted to generate pre-cDCs and pDCs.
Fig. 2.
Progenitor-product relationship among MDP, CDP and pre-cDC. (A) Phenotype of myeloid progenitor (MP, Lin− Sca-1− c-Kithigh CX3CR1−), MDP (CX3CR1+ c-Kithi) and CDP (CD115+CX3CR1+c-Kitlo) in Cx3cr1gfp/+ mice. (B) Donor-derived bone marrow cells analyzed by flow cytometry for presence of MDPs, CDPs and pre-cDCs two days after intra-bone marrow transfer of 5×10⁴ MPs, MDPs or CDPs. (C) Donor-derived splenocytes analyzed for the presence of cDCs, pDCs and monocytes 7 days after transfer of MDPs or CDPs. (D) EGFP expression in indicated cell populations in LysM-Cre x Rosa26-StopfloxEGFP reporter mice (fig. S8). EGFP index = % of EGFP+ cells / % of EGFP+ Gr1high blood monocytes (20). In (C) and (D) left side shows representative dot plots. Bar graphs summarize 2-4 independent experiments with 3-4 mice. Error bars represent the mean ± SEM.
Monocytes and pre-cDC shared features with MDPs, but they diverged phenotypically from MDP in the bone marrow (fig. S6 and fig. S7). To confirm the point of divergence between monocytes and cDCs we made use of LysM-Cre x Rosa26-StopfloxEGFP mice (20). In these mice, monocytes and their progeny are irreversibly marked with EGFP expression because lysozyme promoter-driven Cre expression leads to deletion of the Stop (Fig. 2D and fig. S8 and (20)). In contrast to bone marrow and blood monocytes and their progeny, MDP, CDP, pDCs, pre-cDCs, and cDCs did not express EGFP and therefore never went through a monocyte intermediate (Fig. 2D). We conclude that monocytes separate from the cDC lineage during the transition from MDP to CDP in the bone marrow, but our data do not rule out the possibility of an alternative monocyte-independent pathway of cDC development.
Similar to MDPs, monocytes and pre-cDCs in the bone marrow actively divided as measured by DAPI staining and BrdU incorporation; however, this was not observed in the spleen or in the blood (fig. S9). We conclude that pre-cDC expansion takes place primarily in the bone marrow and that upon differentiation into cDCs in lymphoid tissues they regain the ability to undergo cell division (fig. S9 and (17)).
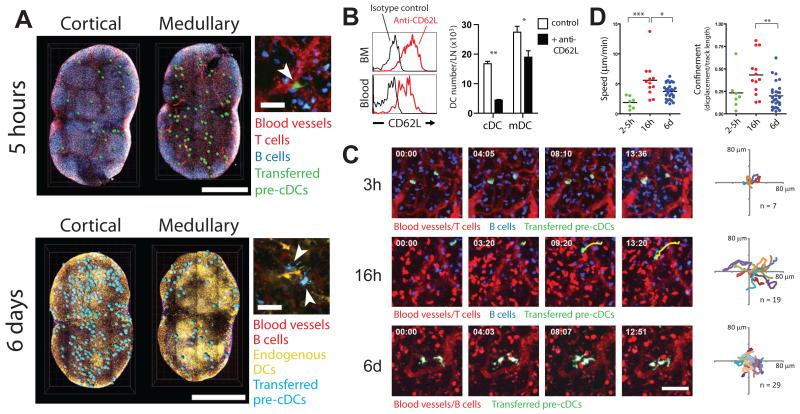
To examine the fate and distribution of pre-cDCs in lymphoid organs, we visualized them by two-photon laser scanning microscopy. Up to five hours after adoptive transfer, pre-cDCs were detected in close proximity to major blood vessels, primarily in the medullary side of the node and at the interface between the T cell zone and B cell follicles (Fig.3A and movies S1-S3, ratio of cortical to medullary pre-cDC = 0.41, at 2-5 hour after injection, n=3 nodes). These vessels showed a cobblestone morphology and a distribution typical of high endothelial venules (HEVs, movies S2 and S3). Consistent with the observation that pre-cDCs were frequently found near HEVs, they expressed CD62L and antibody-mediated inhibition of CD62L prevented cDC accumulation in the LNs, but not spleen where pre-cDC may enter the white pulp through the marginal sinuses (21)(Fig. 3B and fig. S10). Between one and five hours, transferred pre-cDCs were sessile (average speed = 1.9 μm/min; SD=1.0) and remained in contact with HEVs, exhibiting very little displacement (Fig. 3C and D; movies S2 and S3). After 16-18 hours, pre-cDCs and their progeny continued to localize to vessel-rich areas; however, they were no longer attached to blood vessels and displayed a more migratory behavior (average speed = 5.6 μm/min; SD=3.0) (Fig. 3C and D; movies S4 and S5). In contrast, after six days, the progeny of pre-cDCs were distributed throughout the LN paracortex, and integrated into the endogenous DC network (Fig. 3A and movies S6 and S7, ratio of cortical to medullary pre-cDC = 1.95, at 6 days after injection n=3 nodes). These cells displayed dendritic morphology (Fig 3A) and active probing behavior with very restricted displacement and reduced average speeds (3.7 μm/min; SD=1.3) (22) (Fig 3C and D; movies S7 and S8). We conclude that pre-cDCs enter the LNs through HEVs and then distribute themselves throughout the LN and assume typical DC behavior.
Fig. 3.
Multi-photon imaging of pre-cDCs. (A) Transferred cells in inguinal LNs 5hrs (upper panel, green) and 6d (lower panel, cyan) after pre-cDC transfer. Panels at right show morphology of transferred pre-cDCs (arrowheads). Scale bars: 1 mm (left) and 30 μm (right). (B) Left: CD62L expression on pre-cDCs. Right: Graph shows number of LN cDCs or migratory DCs (mDCs) after treatment with anti-CD62L. Graph represents the mean ± SD, n=4 mice per group in 3 experiments. * p = 0.0286; ** p < 0.0001, Student’s T test. (C) Dynamic behavior, morphology, and position of pre-cDCs at indicated times. A cell track (yellow) is superimposed to visualize displacement. Scale bar = 50 μm. Far right shows superimposed 2D (XY) tracks with starting coordinates set to the origin. Number of cells analyzed (n) is indicated. (D) Graphs show velocity and confinement of pre-cDCs at indicated times. Differences between columns are significant by Kruskall-Wallis test (heterogeneity: speed, p =0.0006, meandering, p = 0.0055; * p<0.05, ** p<0.01, *** p<0.001, Dunn’s multiple comparison test). All multi-photon data represent at least two independent experiments.
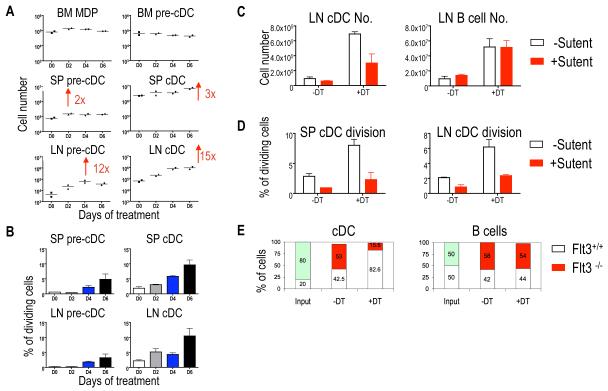
Depletion of CD4+Foxp3+ regulatory T cells (Tregs) leads to DC expansion but how or where Tregs affect the DC developmental pathway has not been determined (23). To examine this, we investigated the effect of Treg depletion on DC development using Foxp3DTR mice. These mice express the diphtheria toxin receptor (DTR) under the control of the Foxp3 promoter and treatment of these mice with diphtheria toxin (DT) results in the specific deletion of Foxp3+ cells (23). We found no change in MDPs, or bone marrow pre-cDCs after Treg depletion. In contrast, spleen and LN pre-cDCs and cDCs increased by 2 and 12 fold, respectively (Fig. 4A, and (23)). In addition, the percentage of dividing cDCs in both spleen and LNs increased from 5% to 10%, suggesting that Treg depletion results in augmented pre-cDC and cDC division specifically in lymphoid organs (Fig. 4B).
Fig. 4.
Tregs control DC expansion in the peripheral lymphoid organs. (A) Numbers of MDP, pre-cDCs and cDCs in the indicated organs after Treg depletion in Foxp3DTR mice. (B) Pre-cDC and cDC division in spleen and LNs at indicated time after Treg depletion. (C and D) Effect of the Flt3 inhibitor, Sutent, on Treg-depletion induced cDC and B cell expansion. (E) Bar graph shows relative percentage of Flt3−/− CD45.1 and Flt3+/+ CD45.2 DCs and B cells after mixed bone marrow transfer into FoxP3DTR CD45.1XCD45.2 mice after DT treatment. Panels are representative of two-four independent experiments. Bar graph represents the mean ± SEM, n=3-4.
Under steady state conditions, the rate of cDC division in lymphoid organs is regulated in part by Flt3 receptor signaling (16). To determine whether the Flt3 pathway is required for Treg control of cDC expansion we used Sutent, a multi-targeted tyrosine kinase inhibitor with affinity for Flt3 (24). We found that Sutent treatment inhibited cDC expansion but not B cell expansion in Treg-depleted mice (Fig. 4C and D). To further confirm the role of the Flt3 pathway in cDC expansion in response to Treg depletion, we adoptively transferred mixtures of bone marrow-derived DC progenitors from wild type Flt3+/+ and Flt3−/− mice into Foxp3DTR recipients and measured their response to DT treatment. Whereas wild type cDCs expanded, Flt3−/− cDCs did not (Fig. 4E). We conclude that increased local production of Flt3-L by a yet to be determined cell type is required for DC division in response to Treg depletion.
The precursor-progeny relationship of monocytes, cDCs, and pDCs has been debated since the discovery of DCs 35 years ago (1). Resolving this issue has been particularly difficult because monocytes can develop many of the phenotypic characteristics of DCs under conditions of inflammation in vivo, or in the presence of certain cytokines in vitro (11-13, 20). Furthermore, cDCs, pDCs and monocytes share a common progenitor, the MDP (Fig. 2C). Several studies have shown that monocytes do not develop into cDCs, however, and that they make only a minor contribution to the lymphoid organ DC network in the steady state (8, 25). We have defined the point of divergence between multipotential and cDC-restricted precursors (pre-cDCs) in the bone marrow and shown that the latter migrate through the blood to lymphoid tissues where they and their progeny divide to fill the DC compartment. We further revealed that Tregs control DC development in the peripheral lymphoid organs in a Flt3-dependent manner (fig. S11). These newly recognized features of DC development in vivo open up the possibility of expanding or reducing DC numbers in vaccine and other clinical settings.
Supplementary Material
Acknowledgments
The authors thank S. Bhuvanendran for two photon microscopy; K. Velinzon and T. Shengelia for cell sorting; R. Steinman and A. Silva for discussions and critical reading of the manuscript; K. Liu was supported by C. H. Li Memorial Scholarship Award from the Rockefeller University. T.A. Schwickert was supported by the Schering Foundation. This work was supported in part by grants from the NIH to MCN. MCN is an HHMI investigator.
References and Notes
- 1.Steinman RM. Nat Med. 2007 Oct;13:1155. doi: 10.1038/nm1643. [DOI] [PubMed] [Google Scholar]
- 2.Shortman K, Liu YJ. Nat Rev Immunol. 2002 Mar;2:151. doi: 10.1038/nri746. [DOI] [PubMed] [Google Scholar]
- 3.Iyoda T, et al. J Exp Med. 2002 May 20;195:1289. doi: 10.1084/jem.20020161. [DOI] [PMC free article] [PubMed] [Google Scholar]
- 4.Dudziak D, et al. Science. 2007 Jan 5;315:107. doi: 10.1126/science.1136080. [DOI] [PubMed] [Google Scholar]
- 5.Di Pucchio T, et al. Nat Immunol. 2008 May;9:551. doi: 10.1038/ni.1602. [DOI] [PMC free article] [PubMed] [Google Scholar]
- 6.Gilliet M, Cao W, Liu YJ. Nat Rev Immunol. 2008 Aug;8:594. doi: 10.1038/nri2358. [DOI] [PubMed] [Google Scholar]
- 7.Fogg DK, et al. Science. 2006 Jan 6;311:83. doi: 10.1126/science.1117729. [DOI] [PubMed] [Google Scholar]
- 8.Varol C, et al. J Exp Med. 2006 Dec 26; [Google Scholar]
- 9.Naik SH, et al. Nat Immunol. 2007 Nov;8:1217. doi: 10.1038/ni1522. [DOI] [PubMed] [Google Scholar]
- 10.Onai N, et al. Nat Immunol. 2007 Nov;8:1207. doi: 10.1038/ni1518. [DOI] [PubMed] [Google Scholar]
- 11.Randolph GJ, Beaulieu S, Lebecque S, Steinman RM, Muller WA. Science. 1998 Oct 16;282:480. doi: 10.1126/science.282.5388.480. [DOI] [PubMed] [Google Scholar]
- 12.Randolph GJ, Inaba K, Robbiani DF, Steinman RM, Muller WA. Immunity. 1999 Dec;11:753. doi: 10.1016/s1074-7613(00)80149-1. [DOI] [PubMed] [Google Scholar]
- 13.Geissmann F, Jung S, Littman DR. Immunity. 2003 Jul;19:71. doi: 10.1016/s1074-7613(03)00174-2. [DOI] [PubMed] [Google Scholar]
- 14.Auffray C, Sieweke MH, Geissmann F. Annu Rev Immunol. 2009 Jan 8; doi: 10.1146/annurev.immunol.021908.132557. [DOI] [PubMed] [Google Scholar]
- 15.Liu K, et al. Nat Immunol. 2007 Jun;8:578. doi: 10.1038/ni1462. [DOI] [PubMed] [Google Scholar]
- 16.Waskow C, et al. Nat Immunol. 2008 Jun;9:676. doi: 10.1038/ni.1615. [DOI] [PMC free article] [PubMed] [Google Scholar]
- 17.Diao J, et al. J Immunol. 2006 Jun 15;176:7196. doi: 10.4049/jimmunol.176.12.7196. [DOI] [PubMed] [Google Scholar]
- 18.Naik SH, et al. Nat Immunol. 2006 Jun;7:663. doi: 10.1038/ni1340. [DOI] [PubMed] [Google Scholar]
- 19.Karsunky H, Merad M, Cozzio A, Weissman IL, Manz MG. J Exp Med. 2003 Jul 21;198:305. doi: 10.1084/jem.20030323. [DOI] [PMC free article] [PubMed] [Google Scholar]
- 20.B. M. Jakubzick C, Bonito AJ, Kuan EL, Merad M, Randolph GJ. J Exp Med. 2008 Nov 24;205:2839. doi: 10.1084/jem.20081430. [DOI] [PMC free article] [PubMed] [Google Scholar]
- 21.Catalina MD, et al. J Exp Med. 1996 Dec 1;184:2341. doi: 10.1084/jem.184.6.2341. [DOI] [PMC free article] [PubMed] [Google Scholar]
- 22.Lindquist RL, et al. Nat Immunol. 2004 Dec;5:1243. doi: 10.1038/ni1139. [DOI] [PubMed] [Google Scholar]
- 23.Kim JM, Rasmussen JP, Rudensky AY. Nat Immunol. 2007 Feb;8:191. doi: 10.1038/ni1428. [DOI] [PubMed] [Google Scholar]
- 24.Tussiwand R, Onai N, Mazzucchelli L, Manz MG. J Immunol. 2005 Sep 15;175:3674. doi: 10.4049/jimmunol.175.6.3674. [DOI] [PubMed] [Google Scholar]
- 25.Jakubzick C, et al. J Immunol. 2008 Mar 1;180:3019. doi: 10.4049/jimmunol.180.5.3019. [DOI] [PubMed] [Google Scholar]
Associated Data
This section collects any data citations, data availability statements, or supplementary materials included in this article.


