Abstract
Hydrogen/deuterium exchange (HDX) combined with mass spectrometry (MS) detection has matured in recent years to become a powerful tool in structural biology and biophysics. Several limitations of this technique can and will be addressed by tapping into ever expanding arsenal of methods to manipulate ions in the gas phase offered by mass spectrometry.
Keywords: hydrogen/deuterium exchange (HDX), mass spectrometry (MS), protein ion fragmentation, collision-induced dissociation (CAD), electron-capture dissociation (ECD), electron-transfer dissociation (ETD), protein conformation, protein dynamics
Introduction: HDX MS in the context of structural proteomics
The spectacular successes of proteomics and bioinformatics in the past decade have resulted in an explosive growth of information on the composition of complex networks of proteins interacting at the cellular level and beyond. However, a simple inventory of interacting proteins is insufficient for understanding how the components of sophisticated biological machinery work together. Protein interactions with each other, small ligands and other biopolymers are governed by their higher order structure, whose determination on a genome scale is a focus of structural proteomics. Realization that “the structures of individual macromolecules are often uninformative about function if taken out of context”1 is shifting the focus of the inquiry from comprehensive characterization of individual protein structures to structural analysis of protein complexes.
X-ray crystallography remains the mainstay in this field, and high resolution structures of proteins and protein complexes often provide important clues as to how they carry out their diverse functions in vivo. However, individual proteins are not static objects, and their behavior cannot be adequately described based solely on information derived from static snapshots and without taking into consideration their dynamic character.2 Conformation and dynamics of small proteins can be probed at high spatial resolution on a variety of time scales using NMR spectroscopy; however, rather unforgiving molecular weight limitations make this technique less suited for the studies of larger proteins and protein complexes.
Mass spectrometry (MS) is playing an increasingly visible role in this field, as it can provide information on protein dynamics on a variety of levels, ranging from interactions with their physiological partners by forming dynamic assemblies3 to large-scale conformational transitions within individual subunits.4 Perhaps one of the most powerful MS-based tools to characterize protein conformation and dynamics is HDX MS, a technique that combined hydrogen/deuterium exchange in solution5 with MS detection of the progress of exchange reactions.6 This technique is certainly not new,7 and in fact already made lasting impact in diverse fields ranging from structural proteomics8 to analysis of biopharmaceutical products.9 Nevertheless, HDX MS methodology is still in a phase where dramatic progress is made, fed by the continued expansion of the experimental armamentarium offered by MS. In particular, better integration of new methods of manipulating ions in the gas phase into HDX MS routine is likely to result in truly transformative changes. This sea change in HDX MS methodology will transform it to a potent tool rivaling NMR in terms of resolution, but without suffering the limitations of this technique.
What information can be deduced from HDX MS measurements? The classic “bottom-up” approach, its challenges and limitations
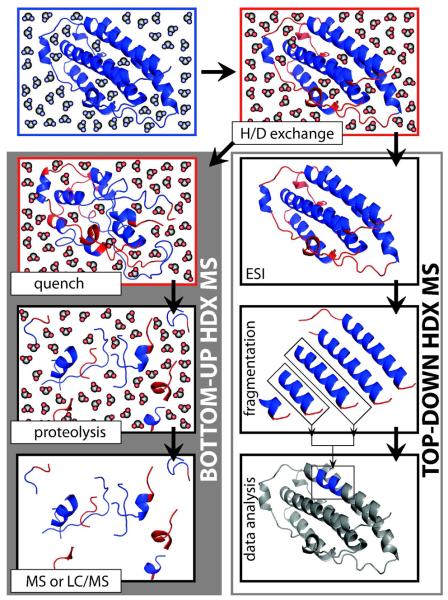
While the concept of HDX experiment may appear rather transparent (Figure 1), interpretation of the results is usually not. The backbone protection measured in a typical HDX MS experiment is a combination of several factors, as the exchange reaction of each labile hydrogen atom is a convolution of two processes.5 The first is a protein motion that makes a particular hydrogen atom exposed to solvent and therefore available for the exchange. This could be a small-scale event, such as relatively frequent local structural fluctuations transiently exposing hydrogen atoms residing close to the protein surface, or a rare global unfolding event exposing atoms sequestered from the solvent in the protein core. The second process is a chemical reaction of exchanging the unprotected labile hydrogen atom with the solvent. The kinetics of this reaction (intrinsic exchange rate) strongly depends on solution temperature and pH (with a minimum at pH 2.5-3 for backbone amides), parameters that obviously have a great influence on the protein dynamics as well.
Figure 1.
Schematic representation of HDX MS experiments: bottom-up (A) and top-down (B) HDX MS.
Since the majority of HDX MS studies target protein dynamics under near-native conditions, the experiments are typically carried out at physiological pH, where the progress of the exchange is followed by monitoring the protein mass change. The direct infusion scheme offers the simplest way to carry out such measurements, either in real time7 or by using on-line rapid mixing.10 However, in many cases these straightforward approaches cannot be used, as they limit the choice of exchange buffer systems to those compatible with electrospray ionization (ESI). To avoid this, HDX can be carried out in any suitable buffer followed by rapid quenching (lowering pH to 2.5-3 and temperature to near 0°C). Dramatic deceleration of the intrinsic exchange rate for backbone amides under these conditions allows the protein solution to be de-salted prior to MS analysis. Additionally, the slow exchange conditions denature most proteins, resulting in facile removal of various binding partners, ranging from small ligands to receptors (their binding to the protein of interest inevitably complicates the HDX MS data interpretation by making accurate mass measurements in the gas phase less straightforward).
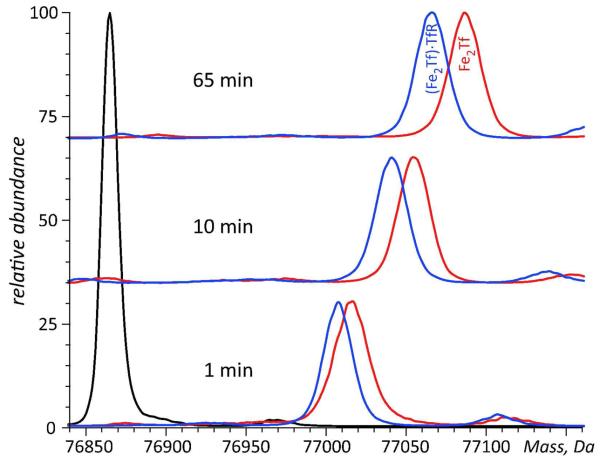
An example of such experiments is shown in Figure 2, where HDX is used to probe the higher order structure and conformational dynamics of metal transporter transferrin (Fe2Tf) alone and in the receptor-bound form. Both Tf-metal and Tf-receptor complexes dissociate under the slow exchange conditions prior to MS analysis; therefore, the protein mass evolution in each case reflects solely deuterium uptake in the course of exchange in solution. The extra protection afforded by the receptor binding to Tf persists over an extended period of time, and it may be tempting to assign it to shielding of labile hydrogen atoms at the protein-receptor interface. However, this view is overly simplistic, as the conformational effects of protein binding are frequently felt well beyond the interface region. The difference in the backbone protection levels of receptor-free and receptor-bound forms of Fe2Tf appears to grow during the initial hour of the exchange (Figure 2), reflecting significant stabilization of Fe2Tf higher order structure by the receptor binding. Indeed, while the fast phase of HDX is typically ascribed to frequent local fluctuations (transient perturbations of higher order structure) affecting relatively small protein segments, the slower phases of HDX usually reflect relatively rare, large-scale conformational transitions (transient partial or complete unfolding). This is why global HDX MS measurements similar to those presented in Figure 2 are can be used to obtain quantitative thermodynamic characteristics for protein interaction with a variety of ligands, ranging from metal ions11 and small organic molecules 12 to other proteins13 and oligonucleotides.14
Figure 2.
HDX MS of Fe2Tf in the presence (blue) and the absence (red) of the cognate receptor. The exchange was carried out by diluting the protein stock solution 1:10 in exchange solution (100 mM NH4HCO3 in D2O, pH adjusted to 7.4) and incubating for a certain period of time as indicated on each diagram followed by rapid quenching (lowering pH to 2.5 and temperature to near 0°C). The black trace shows unlabeled protein.
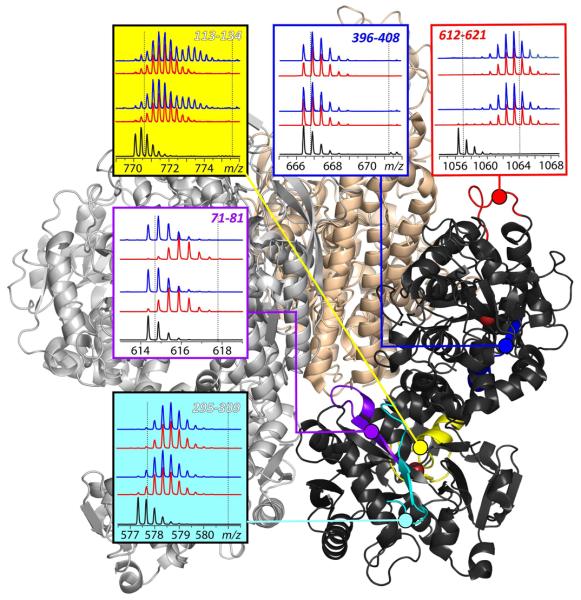
While global HDX MS measurements under near-native conditions provide valuable thermodynamic information on proteins and their interaction with binding partners, structural studies (e.g., localizing the changes in Tf that occur as a result of receptor binding) must rely on the knowledge of exchange kinetics at the local level. This is typically accomplished by carrying out proteolysis under the slow exchange conditions following the quench of HDX.6 Here we will refer to this approach as “bottom-up” HDX MS, by drawing analogy to a bottom-up approach to obtain sequence information.15 An example is shown in Figure 3, where Fe2Tf undergoes exchange in solution in the absence and in the presence of the receptor, followed by rapid quenching of HDX reactions, protein reduction and digestion with pepsin and LC/MS analysis of the deuterium content of individual proteolytic peptides.
Figure 3.
Localizing the influence of the receptor binding on backbone protection of Fe2Tf using bottom-up HDX MS on the physiologically relevant time scale. The panels show isotopic distributions of representative peptic fragments derived from the protein subjected to HDX in the presence (blue) and the absence (red) of the receptor and followed by rapid quenching. Dotted lines indicate deuterium content of unlabeled and fully exchanged peptides. Colored segments within the Fe2Tf/receptor complex show location of the peptic fragments.
Evolution of deuterium content of various peptic fragments in Figure 3 reveals a wide spectrum of protection, which is clearly distributed very unevenly across the protein sequence. While some peptides exhibit nearly complete protection of backbone amides (e.g., segment [396-408] sequestered in the core of the protein C-lobe), exchange in some other segments is fast (e.g., peptide [612-621] in the solvent-exposed loop of the C-lobe). The influence of the receptor binding on the backbone protection is also highly localized. While many segments appear to be unaffected by the receptor binding, there are a few regions where exchange kinetics noticeably decelerates (e.g., segment [71-81] of the N-lobe, which contains several amino acid residues that form Tf/receptor interface according to the available model of the complex based on low-resolution cryo-EM data16).
Although the increased protection of backbone amides proximal to the protein/receptor binding interface is hardly surprising, HDX MS data also reveal a less trivial trend, acceleration of exchange kinetics in some segments of the protein as a result of receptor binding (such behavior is illustrated in Figure 3 with segment [113-134], a part of the N-lobe that is distal to the receptor). Therefore, in addition to mapping binding interface regions, HDX MS also provides a means to localize the protein segments that are affected by the binding indirectly via allosteric mechanisms. However, this example also highlights one of the limitations of HDX MS, namely inadequate spatial resolution. This peptic fragment spans several distinct regions of the protein (an α-helical segment, a β-strand, and two loops). The moderate level of protection observed in this segment in the absence of the receptor binding (fast exchange of three protons followed by slow exchange of the rest) is likely to be a result of averaging out very uneven protection patterns across this peptide. Even smaller peptides may comprise two or more distinct structural elements, such as segment [71-81] spanning three distinct regions of the protein (an α-helical segment, a β-strand, and a loop connecting them).
In some favorable cases spatial resolution in HDX MS of small proteins (<15 kDa) may be enhanced up to a single residue level by analyzing deuterium content of a set of overlapping proteolytic fragments.17 However, single-residue resolution has never been demonstrated in HDX MS studies of proteins falling out of the mass range routinely accessible by NMR, although overlapping peptic fragments frequently provide moderate improvement of spatial resolution.
In addition to limited spatial resolution, the “classic” HDX MS scheme frequently suffers from incomplete sequence coverage, especially when applied to larger and extensively glycosylated proteins. Proteins with multiple disulfide bonds constitute another class of targets for which adequate sequence coverage is difficult to achieve, although certain changes in experimental protocol can alleviate this problem, at least for smaller proteins.18 Typically, an 80% level of sequence coverage is considered good, although significantly lower levels may also be adequate, depending on the context of the study.
Protein processing in HDX MS experiments is carried out under the conditions that minimize the exchange rates for backbone amides. Since these slow exchange conditions are highly denaturing for most proteins, both intact protein and its proteolytic fragments lack any protection and inevitably begin to lose their labile isotopic labels, despite low (but finite) intrinsic exchange rates.19 This phenomenon, known as “back-exchange,” may be accelerated during various stages of protein processing, e.g. during the chromatographic step.20 Although back-exchange was frequently evaluated in early HDX MS studies using unstructured model peptides, the utility of this procedure is questionable, since the intrinsic exchange rates are highly sequence-dependent. In many instances, back-exchange may be estimated using algorithms based on context-specific kinetics data (e.g., http://hx2.med.upenn.edu/download.html); it may also be determined experimentally for each proteolytic fragment by processing a fully labeled protein using a series of steps that precisely reproduce those used in HDX MS measurements.9 Typical back-exchange levels reported in recent literature range from 10% to 50%, although significantly higher numbers have also been reported. Even if back-exchange can be accounted for, it nonetheless has very detrimental influence on the quality of HDX MS measurements by reducing the available dynamic range.
Finally, the classic HDX MS scheme is poorly suited for measurements that are carried out under conditions favoring correlated exchange, when HDX kinetics follows the so-called EX1 regime, leading to appearance of bimodal and convoluted multi-modal isotopic distributions of protein ions.21 Carrying out HDX MS measurements under these conditions provides a unique opportunity to visualize and characterize distinct conformational states, which can be populated either transiently10 or at equilibrium.22 The distinction among such states can be made based on the differences in their deuterium contents. However, proteolysis in solution almost always leads to a loss of correlation between the deuterium content of fragment peptides and specific conformers with distinct levels of backbone protection. Therefore, the classic HDX MS scheme does not allow protein higher order structure and dynamics to be characterized in a conformer-specific fashion.
“Top-down” HDX MS: tandem MS allows protein structure to be probed in the conformer-specific fashion but raises the specter of hydrogen scrambling
The problem of characterizing protein conformation and dynamics in a conformer-specific fashion can be addressed using methods of tandem mass spectrometry (the so-called “top-down” HDX MS). Indeed, replacement of proteolysis in solution with protein ion fragmentation in the gas phase following mass selection of precursor ions provides a means to obtain fragment ions originating from a particular conformer with a specific level of deuterium incorporation. Deuterium content of fragment ions would then provide a measure of local protection patterns, assuming there is no internal re-arrangement of labile hydrogen and deuterium atoms during ion activation (vide infra). Although the idea to use polypeptide ion dissociation in the gas phase as an alternative to proteolysis was originally proposed in early 1990s,23 its implementation for proteins only became possible24 following dramatic improvements in FTMS and hybrid TOF analyzers in the late 1990s.
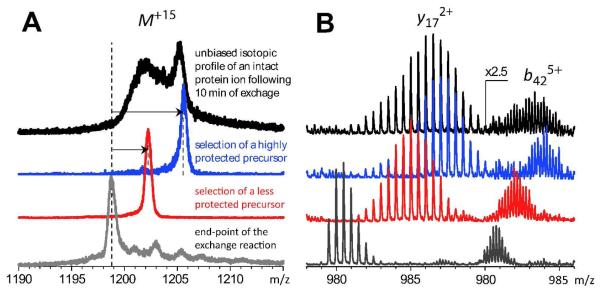
An example of conformer-specific characterization of protein higher order structure using a top-down HDX MS approach is illustrated in Figure 4. The isotopic profile of a fully deuterated 18 kDa protein wt*-CRABPI is recorded following its brief exposure to the 1H-based exchange buffer. The bimodal appearance of the isotopic distribution of the molecular ion (top trace in Figure 4A) clearly indicates the presence of at least two conformers with different levels of backbone protection. Collisional activation of the entire protein ion population generates a set of fragment ions with convoluted isotopic distributions (top trace in Figure 4B). However, mass selection of precursor ions with a specific level of deuterium content allows the top-down HDX MS measurements to be carried out in a conformation-specific fashion, taking full advantage of the HDX MS ability to detect distinct conformers. For example, selective fragmentation of protein ions representing a highly protected conformation is achieved by mass-selecting a narrow population of intact protein ions with high level of retained deuterium (the blue trace in Figure 4A). Mass-selection and subsequent fragmentation of a narrow population of protein ions with significantly lower deuterium content (the red trace in Figure 4A) generates a set of fragment ions whose isotopic distributions provide information on backbone protection within non-native protein states. For example, the data presented in Figure 4 clearly indicate that the C-terminal segment of the protein represented by the y172+ ions retains significant structure even within the partially unfolded conformers: the amount of retained deuterium atoms reduces by only 30% as a result of switching from the precursor ion from highly protected (blue) to less protected (red). At the same time, selection of the precursor ion has a much more dramatic effect on the protection levels exhibited by the N-terminal segment (represented by the b425+ ion), where more than a two-fold decrease in the amount of retained deuterium atoms is observed. Extending this analysis to other protein fragments may allow detailed backbone protection maps to be created for each protein conformer, provided there is no hydrogen scrambling prior to protein ion fragmentation (vide infra).
Figure 4.
Characterization of local dynamics in wt*-CRABP I in a conformer-specific fashion using top-down HDX MS (fully deuterated protein was exposed to 1H2O/CH3CO2N1H4 at pH 3.1 for 10 min; the gray trace at the bottom corresponds to HDX end-point). A: mass selection of precursor ions for subsequent CAD (from top to bottom): broad-band selection of the entire ionic population (not conformer-specific); highly protected conformers; narrow population of less protected conformers; HDX end-point. B: isotopic distributions of two representative fragment ions generated by CAD of precursor ions shown in panel A. Selection of different ion populations as precursor ions for subsequent fragmentation was achieved by varying the width of a mass selection window of a quadrupole filter (Q) in a hybrid quadrupole/time-of-flight mass spectrometer (Qq-TOF MS).
The example shown above illustrates a great promise of top-down HDX MS as a technique uniquely capable of probing structure and dynamics of populations of protein conformers coexisting in solution with high selectivity. Furthermore, this approach often allows one to avoid protein handling under the slow exchange conditions prior to MS analysis, thereby eliminating back-exchange as a factor adversely influencing the quality of measurements. Nonetheless, applications of top-down HDX MS have been limited due to concerns over the possibility of hydrogen scrambling accompanying collision-activated dissociation (CAD) of protein ions. Indeed, several reports pointed out that proton mobility in the gas phase may under certain conditions influence the outcome of top-down HDX MS measurements when CAD is employed to fragment protein ions.25, 26
The occurrence (or the absence) of hydrogen scrambling in the gas phase can be reliably detected by using built-in scrambling indicators. One particularly convenient indicator is a Histag, a 6-30 residues long, histidine-rich segment appended to wild-type sequences to facilitate protein purification on metal affinity columns. Such segments are fully unstructured in solution and, therefore, should lack any backbone protection.27 Alternatively, intrinsic scrambling indicators (e.g., internal flexible loops26), as well as other approaches25 can be used to detect occurrence of scrambling. The available experimental evidence suggests that slow protein ion activation (e.g., SORI CAD) always leads to hydrogen scrambling, while fast activation allows it to be minimized or eliminated in top-down HDX MS experiments.26
Another shortcoming of top-down HDX MS schemes utilizing CAD is the limited extent of protein ion fragmentation, which may lead to sizeable gaps in sequence coverage, particularly for larger proteins,28 and insufficient level of spatial resolution (even for smaller proteins29). Our earlier attempts to solve this problem by employing multi-stage CAD (MSn) were unsuccessful due to massive hydrogen scrambling exhibited by the second generation of fragments.
Electron-induced ion fragmentation in top-down schemes: keeping hydrogen scrambling at bay while enhancing sequence coverage and spatial resolution
Some time ago we suggested that the specter of hydrogen scrambling in top-down HDX MS measurements may be alleviated by using non-ergodic fragmentation processes, where dissociation is induced by ion-electron interaction, rather than collisional activation.30 Indeed, the results of earlier work combining hydrogen exchange of polypeptide ions in the gas phase and electron capture dissociation (ECD) were consistent with the notion of intramolecular rearrangement of hydrogen atoms occurring on a slower time scale compared to ion dissociation.31 A recent study demonstrated that the extent of scrambling was indeed negligible when ECD was used as a means to obtain fragment ions in top-down HDX MS characterization of a small protein ubiquitin.32
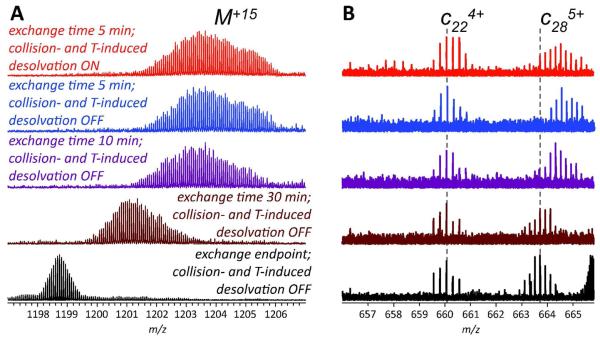
Our own recent work suggests that hydrogen scrambling can be avoided when top-down HDX MS employs ECD in characterizing higher order structure of larger proteins (approaching 20 kDa), although experimental conditions must be carefully controlled to minimize proton mobility induced by ion-molecule collisions in the ESI interface. The point in question is illustrated in Figure 5, which shows the results of top-down HDX MS analysis of higher order structure of wt*-CRABP I. The protein retains a significant proportion of labile deuterium label following its complete deuteration and then brief exposure to the 1H-based exchange buffer, as indicated by the isotopic distribution of the surviving molecular ions (red and blue traces in Figure 5A). However, the deuterium content of fragment ions derived from the 21-residue long His-tag region of the protein (e.g., c22 in Figure 5B) is indistinguishable from that of the exchange reaction endpoint, as long as moderate ion desolvation conditions are kept in the ESI interface. This clearly signals that hydrogen scrambling does not affect the outcome of local HDX MS measurements. However, once collision-assisted desolvation of protein ions is attempted in the ESI interface, the appearance of isotopic distributions of larger fragment ions derived from the His-tag region (e.g., c22, red trace in Figure 5B) shifts, indicating apparent deuterium retention and signaling the occurrence of limited hydrogen scrambling. We also demonstrated that deuterium distribution across the protein backbone is preserved when another recently introduced fragmentation technique based on cation-electron interactions, electron transfer dissociation (ETD), is used in top-down HDX MS schemes.33
Figure 5.
Top-down HDX MS of wt*-CRABP I using ECD of the entire protein ion population (fully deuterated protein was exposed to 1H2O/CH3CO2N1H4 at pH 3.5 for varying time periods); the black trace at the bottom of corresponds to HDX end-point). A: isotopic distributions of surviving intact protein ions. B: two representative c-ions. Minimal collision-and temperature-induced desolvation was used for acquisition of all mass spectra, except the one top (red trace).
In addition to allowing scrambling to be easily eliminated in top-down HDX MS experiments, both ECD and ETD appear to be superior to CAD in terms of sequence coverage, at least for the proteins in the 20 kDa range. Unlike CAD, protein backbone cleavage in ECD and ETD is less specific,34 leading to a higher number of fragment ions. This translates not only to improved sequence coverage, but also enhanced spatial resolution. Indeed, in some cases it becomes possible to generate patterns of deuterium distribution across the protein backbone down to the single residue level.
One example of such work is shown in Figure 6, where ETD was used as a protein ion fragmentation tool in top-down HDX MS characterization of a 16 kDa variant of CRABP I. The bar graph shows the levels of deuterium retention in a series of c-ions derived from the N-terminal segment of the protein. The bar height at position n in this diagram shows mass difference between two cn-1 fragments, one derived from the fully deuterated protein that was exposed to the protiated exchange buffer at pH 7 for 5 min and then placed under the slow exchange conditions for the duration of the data acquisition cycle, and another one representing the HDX endpoint (raw data for bars at n=14 and 35 are shown in Figure 7). Unchanged height between two adjacent bars at residues n and n+1 indicates no difference in deuterium content of cn-1 and cn fragments, signaling no backbone amide deuterium retention at residue n+1, while bar height increase by one unit indicates complete retention of deuterium at the nth amide.
Figure 6.
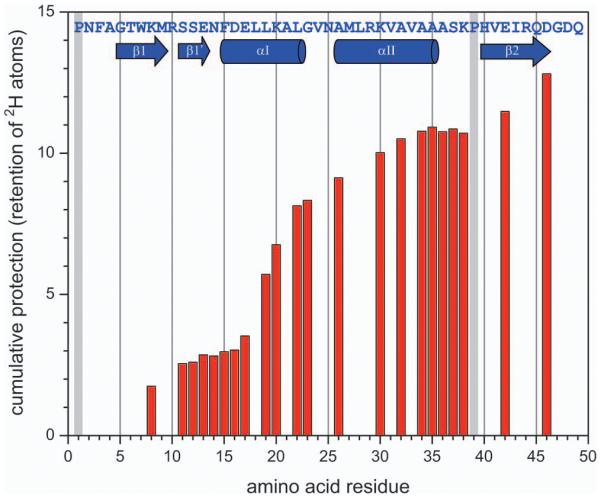
Backbone protection pattern of CRABPI mutant (without N-terminal His-tag) obtained from top-down HDX MS measurements using ETD of the entire protein ion population. HDX was initiated by exposing the fully deuterated protein to 1H2O/CH3CO2N1H4 at pH 3.5 for 5 min followed by rapid quenching.
Figure 7.
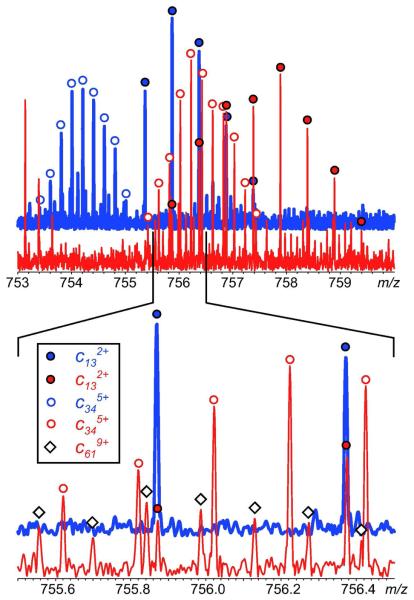
An example of raw HDX MS data used to generate the protection plot shown in Figure 6. Isotopic distributions of c13 and c34 fragments derived from protein subjected to 5 min HDX exchange in solution (red trace) and protein at the HDX end-point (blue trace) were used to calculate the bar heights at n=12 and 35.
The resulting backbone protection pattern in Figure 6 shows clear correlation with the known higher order structure of the protein (the amino acid sequence and the secondary structure assignment are shown at the top of the graph). Furthermore, the diagram clearly shows uneven distribution of backbone protection even within single structural elements (e.g., lower protection at the fringes vs. the middle of helix α1), as well as unequal protection of similar structural elements participating in the same structural motif (e.g., lower protection of helix α2 vs. helix α1, consistent with the available NMR data). A comparable level of spatial resolution can be achieved with ECD, as shown recently in top-down HDX MS analysis of higher order structure of myoglobin.35
The ability to characterize protein conformation and dynamics at the single residue level is certainly very exciting; however, it comes at a price. Since the protein fragmentation is carried out entirely in the gas phase, no fragment separation can be done prior to mass analysis. A large number of fragment ions with different masses and charges are usually confined to a relatively narrow m/z region, leading to inevitable overlaps of fragment ion isotopic distributions (Figure 7). This places rather stringent requirements on the resolving power of the mass analyzer, effectively narrowing the selection of mass spectrometers suitable for this work to FTMS.
Meeting in the middle: integration of top-down strategies into bottom-up HDX MS schemes
The top-down approach to HDX MS measurements clearly shows a promise to solve many problems that mar the commonly employed bottom-up methodology. The fragmentation efficiency afforded by ECD and ETD provides better spatial resolution, at least for proteins in the 20 kDa range, and this number is likely to grow as there are numerous examples of successful use of these fragmentation techniques to obtain sequence information on significantly larger proteins.36 Unlike the classic bottom-up approach, top-down HDX MS provides an elegant solution to the problem of characterizing higher order structure and dynamics in a conformer-specific fashion (see Figure 4 and discussion in the text). Finally, back-exchange can be eliminated, as outsourcing protein fragmentation to the gas phase often eliminates the need to manipulate the protein in solution under the slow exchange conditions prior to MS analysis.
The top-down/bottom-up dichotomy in HDX MS should not be viewed through the “eitheror” prism. In fact, gas phase fragmentation can enhance the quality of HDX MS data derived from experiments that are built around the bottom-up approach. The suggestion to supplement proteolysis in solution with peptide ion fragmentation in the gas phase to achieve better spatial resolution was made over 10 years ago.37 However, earlier attempts to implement this idea using CAD on a variety of platforms yielded mixed results due to apparent scrambling in some (but not all) fragment ions.37, 38 Later reports showed even more extensive scrambling in small peptide ions subjected to collisional activation,39 an obvious anathema to the proposed marriage of CAD and bottom-up HDX MS. Nonetheless, continued search for a scrambling-free solution to this problem has yielded very encouraging results, with both ECD and ETD showing minimal scrambling when applied to short peptides under carefully controlled conditions40, 41 and feasibility of supplementing proteolytic fragmentation in solution with ETD in the gas phase was recently demonstrated using a small model protein.42 Although these initial steps are relatively modest, they certainly warrant further work in this field.
The two complementary approaches to HDX MS measurements share a set of common challenges that inevitably arise as these techniques gain popularity and the scope of their applications expands. One such challenge is presented by membrane proteins, a notoriously difficult class of biological objects. HDX MS has been shown to have a great potential in this field.43 Interestingly, some initial work in this field was done nearly ten years ago using then-infant top-down HDX MS technique,44 while more recent work in this field utilizes both bottomup18 and top-down45 approaches. Another challenge faced by HDX MS is presented by highly heterogeneous proteins, such as proteins conjugated to other biopolymers and/or synthetic polymers, which constitute a significant fraction of the next generation of biopharmaceuticals. Presently, there are no biophysical techniques capable of characterizing conformation and dynamics of these systems, and there is an urgent need to fill this gap. Finally, nearly all HDX MS work reported to date was carried out in vitro under conditions that some regard as “reductionist.” Although initial HDX work with living objects was carried out over 75 years ago,46 as the years passed only one report on in vivo HDX MS studies was published.47 As mass spectrometry at large is being increasingly used in both in vivo and ex vivo studies, there is a growing pressure on HDX MS to follow the trend, although it remains to be seen how this will be done.
It probably is not an exaggeration to say that we are witnessing a renaissance of HDX MS, with the emergence of the top-down approach not only expanding our experimental arsenal by offering new capabilities, but also serving as a catalyst in enhancing the classic bottom-up methodology. The two techniques are highly complementary, and their synergism will certainly bring about new exciting discoveries and accelerate our progress in solving a variety of problems ranging from very fundamental questions in biophysics to applied problems in drug design.
Acknowledgements
We are grateful to Dr. Michael Easterling (Bruker Daltonics) for help with ECD experiments and Dr. Walter Stelzer (Technische Universität München) for help with translation of early HDX literature. This work was supported by a grant R01 GM061666 from the National Institutes of Health.
References
- 1.Sali A, Glaeser R, Earnest T, Baumeister W. Nature. 2003;422:216–225. doi: 10.1038/nature01513. [DOI] [PubMed] [Google Scholar]
- 2.Vinson VJ. Science. 2009;324:197. doi: 10.1126/science.324.5924.197. [DOI] [PubMed] [Google Scholar]
- 3.Robinson CV, Sali A, Baumeister W. Nature. 2007;450:973–982. doi: 10.1038/nature06523. [DOI] [PubMed] [Google Scholar]
- 4.Kaltashov IA, Abzalimov RR. J. Am. Soc. Mass Spectrom. 2008;19:1239–1246. doi: 10.1016/j.jasms.2008.05.018. [DOI] [PubMed] [Google Scholar]
- 5.Krishna MMG, Hoang L, Lin Y, Englander SW. Methods. 2004;34:51–64. doi: 10.1016/j.ymeth.2004.03.005. [DOI] [PubMed] [Google Scholar]
- 6.Wales TE, Engen JR. Mass Spectrom. Rev. 2006;25:158–170. doi: 10.1002/mas.20064. [DOI] [PubMed] [Google Scholar]
- 7.Katta V, Chait BT. J. Am. Chem. Soc. 1993;115:6317–6321. [Google Scholar]
- 8.Anand GS, Law D, Mandell JG, Snead AN, Tsigelny I, Taylor SS, Eyck LFT, Komives EA. Proc. Natl. Acad. Sci. U. S. A. 2003;100:13264–13269. doi: 10.1073/pnas.2232255100. [DOI] [PMC free article] [PubMed] [Google Scholar]
- 9.Bobst CE, Abzalimov RR, Houde D, Kloczewiak M, Mhatre R, Berkowitz SA, Kaltashov IA. Anal. Chem. 2008;80:7473–7481. doi: 10.1021/ac801214x. [DOI] [PMC free article] [PubMed] [Google Scholar]
- 10.Konermann L, Simmons DA. Mass Spectrom. Rev. 2003;22:1–26. doi: 10.1002/mas.10044. [DOI] [PubMed] [Google Scholar]
- 11.Zhu MM, Rempel DL, Zhao J, Giblin DE, Gross ML. Biochemistry. 2003;42:15388–15397. doi: 10.1021/bi035188o. [DOI] [PubMed] [Google Scholar]
- 12.Xiao H, Kaltashov IA, Eyles SJ. J. Am. Soc. Mass Spectrom. 2003;14:506–515. doi: 10.1016/S1044-0305(03)00135-1. [DOI] [PubMed] [Google Scholar]
- 13.Tong Y, Wuebbens MM, Rajagopalan KV, Fitzgerald MC. Biochemistry. 2005;44:2595–2601. doi: 10.1021/bi047762h. [DOI] [PubMed] [Google Scholar]
- 14.Sperry JB, Shi X, Rempel DL, Nishimura Y, Akashi S, Gross ML. Biochemistry. 2008;47:1797–1807. doi: 10.1021/bi702037p. [DOI] [PubMed] [Google Scholar]
- 15.Kelleher NL, Lin HY, Valaskovic GA, Aaserud DJ, Fridriksson EK, McLafferty FW. J. Am. Chem. Soc. 1999;121:806–812. [Google Scholar]
- 16.Cheng Y, Zak O, Aisen P, Harrison SC, Walz T. Cell. 2004;116:565–576. doi: 10.1016/s0092-8674(04)00130-8. [DOI] [PubMed] [Google Scholar]
- 17.Del Mar C, Greenbaum EA, Mayne L, Englander SW, Woods VL., Jr. Proc. Natl. Acad. Sci. U. S. A. 2005;102:15477–15482. doi: 10.1073/pnas.0507405102. [DOI] [PMC free article] [PubMed] [Google Scholar]
- 18.Burke JE, Karbarz MJ, Deems RA, Li S, Woods VL, Dennis EA. Biochemistry. 2008;47:6451–6459. doi: 10.1021/bi8000962. [DOI] [PMC free article] [PubMed] [Google Scholar]
- 19.Bai Y, Milne JS, Mayne L, Englander SW. Proteins. 1993;17:75–86. doi: 10.1002/prot.340170110. [DOI] [PMC free article] [PubMed] [Google Scholar]
- 20.Zhang HM, Bou-Assaf GM, Emmett MR, Marshall AG. J. Am. Soc. Mass Spectrom. 2008 doi: 10.1016/j.jasms.2008.11.010. [DOI] [PMC free article] [PubMed] [Google Scholar]
- 21.Miranker A, Robinson CV, Radford SE, Dobson CM. FASEB J. 1996;10:93–101. doi: 10.1096/fasebj.10.1.8566553. [DOI] [PubMed] [Google Scholar]
- 22.Eyles SJ, Kaltashov IA. Methods. 2004;34:88–99. doi: 10.1016/j.ymeth.2004.03.015. [DOI] [PubMed] [Google Scholar]
- 23.Anderegg RJ, Wagner DS, Stevenson CL, Borchardt RJ. Am. Soc. Mass Spectrom. 1994;5:425–433. doi: 10.1016/1044-0305(94)85058-5. [DOI] [PubMed] [Google Scholar]
- 24.Eyles SJ, Dresch T, Gierasch LM, Kaltashov IA. J. Mass Spectrom. 1999;34:1289–1295. doi: 10.1002/(SICI)1096-9888(199912)34:12<1289::AID-JMS882>3.0.CO;2-U. [DOI] [PubMed] [Google Scholar]
- 25.Ferguson PL, Pan J, Wilson DJ, Dempsey B, Lajoie G, Shilton B, Konermann L. Anal. Chem. 2007;79:153–160. doi: 10.1021/ac061261f. [DOI] [PubMed] [Google Scholar]
- 26.Hoerner JK, Xiao H, Dobo A, Kaltashov IA. J. Am. Chem. Soc. 2004;126:7709–7717. doi: 10.1021/ja049513m. [DOI] [PubMed] [Google Scholar]
- 27.Eyles SJ, Speir P, Kruppa G, Gierasch LM, Kaltashov IA. J. Am. Chem. Soc. 2000;122:495–500. [Google Scholar]
- 28.Xiao H, Kaltashov IA. J. Am. Soc. Mass Spectrom. 2005;16:869–879. doi: 10.1016/j.jasms.2005.02.020. [DOI] [PubMed] [Google Scholar]
- 29.Hoerner JK, Xiao H, Kaltashov IA. Biochemistry. 2005;44:11286–11294. doi: 10.1021/bi0509548. [DOI] [PMC free article] [PubMed] [Google Scholar]
- 30.Kaltashov IA, Eyles SJ. J. Mass Spectrom. 2002;37:557–565. doi: 10.1002/jms.338. [DOI] [PubMed] [Google Scholar]
- 31.Zubarev RA, Kelleher NL, McLafferty FW. J. Am. Chem. Soc. 1998;120:3265–3266. [Google Scholar]
- 32.Pan J, Han J, Borchers CH, Konermann L. J. Am. Chem. Soc. 2008;130:11574–11575. doi: 10.1021/ja802871c. [DOI] [PubMed] [Google Scholar]
- 33.Abzalimov RR, Kaplan DA, Easterling ML, Kaltashov IA. J. Am. Soc. Mass Spectrom. 2009;20:1514–1517. doi: 10.1016/j.jasms.2009.04.006. [DOI] [PMC free article] [PubMed] [Google Scholar]
- 34.Zubarev RA, Zubarev AR, Savitski MM. J. Am. Soc. Mass Spectrom. 2008;19:753–761. doi: 10.1016/j.jasms.2008.03.007. [DOI] [PubMed] [Google Scholar]
- 35.Pan J, Han J, Borchers CH, Konermann L. J. Am. Chem. Soc. 2009 doi: 10.1021/ja904379w. in press. [DOI] [PubMed] [Google Scholar]
- 36.Patrie SM, Ferguson JT, Robinson DE, Whipple D, Rother M, Metcalf WW, Kelleher NL. Mol. Cell. Proteomics. 2006;5:14–25. doi: 10.1074/mcp.M500219-MCP200. [DOI] [PubMed] [Google Scholar]
- 37.Deng YZ, Pan H, Smith DL. J. Am. Chem. Soc. 1999;121:1966–1967. [Google Scholar]
- 38.Kim MY, Maier CS, Reed DJ, Deinzer ML. J. Am. Chem. Soc. 2001;123:9860–9866. doi: 10.1021/ja010901n. [DOI] [PubMed] [Google Scholar]
- 39.Jørgensen TJ, Gardsvoll H, Ploug M, Roepstorff P. J. Am. Chem. Soc. 2005;127:2785–2793. doi: 10.1021/ja043789c. [DOI] [PubMed] [Google Scholar]
- 40.Rand KD, Adams CM, Zubarev RA, Jørgensen TJD. J. Am. Chem. Soc. 2008;130:1341–1349. doi: 10.1021/ja076448i. [DOI] [PubMed] [Google Scholar]
- 41.Zehl M, Rand KD, Jensen ON, Jorgensen TJ. J. Am. Chem. Soc. 2008;130:17453–17459. doi: 10.1021/ja805573h. [DOI] [PubMed] [Google Scholar]
- 42.Rand KD, Zehl M, Jensen ON, Jorgensen TJD. Anal. Chem., in press [Google Scholar]
- 43.Stelzer W, Poschner BC, Stalz H, Heck AJ, Langosch D. Biophys. J. 2008;95:1326–1335. doi: 10.1529/biophysj.108.132928. [DOI] [PMC free article] [PubMed] [Google Scholar]
- 44.Demmers JA, Haverkamp J, Heck AJ, Koeppe RE, 2nd, Killian JA. Proc. Natl. Acad. Sci. U S A. 2000;97:3189–3194. doi: 10.1073/pnas.050444797. [DOI] [PMC free article] [PubMed] [Google Scholar]
- 45.de Souza BM, Palma MS. Biochim. Biophys. Acta. 2008;1778:2797–2805. doi: 10.1016/j.bbamem.2008.09.005. [DOI] [PubMed] [Google Scholar]
- 46.Bonhoeffer KF. Angew. Chem. 1933;46:776–779. [Google Scholar]
- 47.Ghaemmaghami S, Oas TG. Nat. Struct. Biol. 2001;8:879–882. doi: 10.1038/nsb1001-879. [DOI] [PubMed] [Google Scholar]


