Abstract
Although cancer is a disease with genetic and epigenetic origins, the possible effects of reprogramming by defined factors remain to be fully understood. We studied the effects of the induction or inhibition of cancer-related genes and immature status-related genes whose alterations have been reported in gastrointestinal cancer cells. Retroviral-mediated introduction of induced pluripotent stem (iPS) cell genes was necessary for inducing the expression of immature status-related proteins, including Nanog, Ssea4, Tra-1-60, and Tra-1-80 in esophageal, stomach, colorectal, liver, pancreatic, and cholangiocellular cancer cells. Induced cells, but not parental cells, possessed the potential to express morphological patterns of ectoderm, mesoderm, and endoderm, which was supported by epigenetic studies, indicating methylation of DNA strands and the histone H3 protein at lysine 4 in promoter regions of pluripotency-associated genes such as NANOG. In in vitro analysis induced cells showed slow proliferation and were sensitized to differentiation-inducing treatment, and in vivo tumorigenesis was reduced in NOD/SCID mice. This study demonstrated that pluripotency was manifested in induced cells, and that the induced pluripotent cancer (iPC) cells were distinct from natural cancer cells with regard to their sensitivity to differentiation-inducing treatment. Retroviral-mediated introduction of iPC cells confers higher sensitivity to chemotherapeutic agents and differentiation-inducing treatment.
Keywords: cancer stem cells, epigenetics, pluripotent stem cells, embryonic stem cells, differentiation
Cancer is thought to be a genetic and epigenetic disease with uncontrolled proliferative potential. Although the idea was proposed decades ago, the concept that some cancer cells arise from small populations, termed cancer stem cells (CSCs), with both self-renewal potential and multipotential properties sufficient to form tumors, has emerged recently (1, 2). This small population of CSCs possesses persistent self-renewal potential that can be detected by various in vitro assessments and in vivo animal experiments (2). Therefore, it has been proposed that malignant tumors are derived from CSCs with uncontrolled proliferative potential and dysregulation of their mechanisms of differentiation (2).
The origins of CSCs remain incompletely understood (1–3). One view is that CSCs are formed as a result of alterations arising in cells that have already differentiated (1); alternatively, another notion holds that their generation is a result of tumorigenesis that has occurred in immature tissue stem cells or progenitor cells (2); however, in both theories, epigenetic organization participates in tumorigenic regulation (1, 2).
With the investigation and development of ES cells from zygote to blastodermic vesicle stages, the elucidation of the molecular mechanisms that specify pluripotent differentiation has made remarkable progress (4, 5). Regarding the regulation of molecular mechanisms managing this pluripotency, it is obvious that several types of transcription factors specifically discovered in multipotential stem cells display mutual cooperation as a result of epigenetic controls (6–9).
In this study, we analyzed the effects of transcription factor genes that were previously reported in induced pluripotent stem (iPS) cells (6, 7), as well as cancer-related oncogenes and tumor suppressor genes. The repression of tumor-suppressor genes extends the lifespan of embryonic stem (ES) cells or increases the induction efficiency of iPS cells and maintains their immortalized state (10–12). The results indicated that introduction of transcription factor genes into gastrointestinal cancer cells resulted in reprogramming of cells to a pluripotent state and sensitized them to differentiation induction. Such reprogrammed cells were distinct from parental cells. It is hoped that the generation of induced pluripotent cancer (iPC) cells will eventually accomplish some goals in this field. One such goal is the inspection of previously uncharacterized cancer treatments using differentiation therapy via the induction of drug susceptibility in cancer cells. Reprogramming of cancer cells supports the notion that transduction might cause differentiation of cells to unique cell lineages. Another goal is the exploitation of drug discoveries with the aim of producing therapeutic and diagnostic reagents and using them in their clinical applications.
Results
Expression of Genes Inducing Immature Status in Gastrointestinal Cancer Cell Lines.
We performed quantitative real-time reverse transcription PCR (RT-PCR) analysis on 20 gastrointestinal cancer cell lines by using immature status-related gene primers for NANOG, OCT3/4, SOX2, KLF4, and LIN28 (Fig. S1A). From the results of RT-PCR analysis, we selected cancer cell lines such as DLD-1, HCT116, MIAPaCa-2, and PLC, which exhibited relatively low NANOG mRNA expression. In these cells, immature status seems to be effectively exhibited and represented as high NANOG expression (6–9). Especially in the colorectal cancer cell line DLD-1, all five selected genes showed relatively low expression compared to the other gastrointestinal cancer cell lines. We then studied the induction of simultaneous combinations of several factors, which include OCT3/4, SOX2, KLF4, and c-MYC, as well as oncogenes (BCL2 and KRAS) and tumor suppressor genes shRNA (TP53, P16(INK4A), PTEN, FHIT, RB1) (Fig. S1 B and C). These factors were transfected into four cancer cell lines with ecotropic retrovirus produced in PLAT-E packaging cells. Four transcription factors OCT3/4, SOX2, KLF4, and c-MYC significantly induced up-regulation of NANOG mRNA.
Induction of ES-Like State Cancer Cells with Lentiviral and Retroviral Transduction.
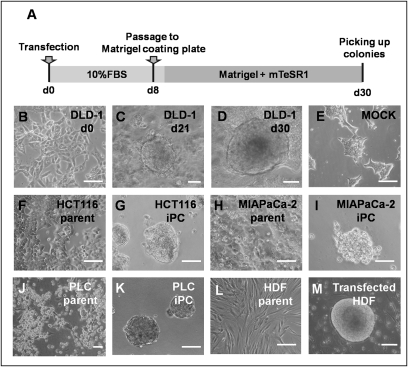
Induction of human cancer cell lines using lentiviruses and retroviruses requires high transduction efficiencies. We optimized the transduction methods for cancer cell lines (Fig. 1A). The four transcription factors, OCT3/4, SOX2, KLF4, and c-MYC, were transfected into cancer cell lines with ecotropic retrovirus produced in PLAT-E packaging cells. Eight days after transduction, the cells were harvested by trypsinization and plated onto Matrigel-coated plates. The next day, the Dulbecco’s modified Eagle medium (DMEM) containing 10% FBS was replaced with the medium suitable for the culture of ES cells. Twenty-one days later, some colonies appeared that were morphologically different from the parental cancer cells (Fig. 1 B and C). Four weeks after transduction, we observed distinct types of colonies that were different from mock cells, transfected with pMXs retroviral vector as negative control (Fig. 1 D and E).
Fig. 1.
Induction of human cancer cells with retroviral transduction. (A) We optimized the time course of the induction from human cancer cells; the schedule is summarized. (B–E) DLD-1 morphology was exhibited. Twenty days later, we observed distinct types of colonies with round shapes (C and D) that were different from the wild type (B). (E) Mock was transfected with pMXs Retroviral Vector as a negative control . (F–K) Parental and iPC cells of gastrointestinal cancer cell lines from HCT116 (F and G), MIAPaCa-2 (H and I), and PLC (J and K). (L and M) The referential morphologies are exhibited by HDF. Scale bar: 200 μm. (Original magnification, ×200)
We examined the transfection and induction efficiencies by using combinations of OCT3/4, SOX2, KLF4, and c-MYC, and compared the results, with four cancer cell lines and human dermal fibroblasts (HDF) serving as controls (Fig. 1 F–M). In isolated colonies, we assessed NANOG promoter activity, which has been reported to be important in the acquisition of immature status (6–9), by cotransfection of NANOG promoter-GFP clone. GFP expression of transfectants was visualized by fluorescence microscopy (Fig. S2). From 1 × 10⁴ cancer cells, we observed ≈10 GFP-expressing sphere formations. These cells in the present study were similar to iPS cells both in morphology, ES-like gene expression and epigenetic modifications as described in refs. 6–9, 13, and 14. Thus, we referred to these cells formed after transduction as iPC cells.
iPC Cells Express ES Cell Markers.
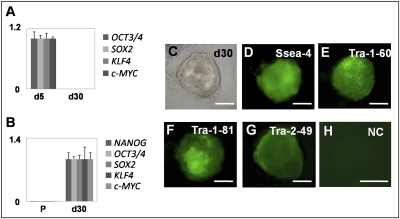
Real-time RT-PCR using primers specific for retroviral transcripts confirmed efficient silencing of four retroviruses expressing OCT3/4, SOX2, KLF4, and c-MYC in iPC cells (Fig. 2A). RT-PCR showed that human iPC cells expressed undifferentiated ES cell-marker genes, including NANOG, OCT3/4, SOX2, KLF4, and c-MYC, although NANOG was not introduced exogenously (Fig. 2B). iPC cells expressed ES cell-specific surface antigens (15) including Ssea-4, tumor-related antigen (Tra)-1-60, Tra-1-81, and Tra-2-49 (Fig. 2 C–G) compared to the negative control (Fig. 2H).
Fig. 2.
iPC cells induced from DLD-1 expressing ES cell markers. (A) Real-time RT-PCR using primers specific for retroviral transcripts confirmed efficient silencing of four retroviruses expressing OCT3/4, SOX2, KLF4, and c-MYC. The mean value of d5 was set to 1 in each transcript. (B) iPC cells expressed undifferentiated ES cell-marker genes, including NANOG, OCT3/4, SOX2, KLF4, and c-MYC. The mean value of d30 was set to 1 in each transcript. (C–G) iPC cells were analyzed for several surface antigens, phase contrast (C), Ssea-4 (D), Tra-1-60 (E), Tra-1-81 (F), Tra-2-49 (G) and negative control (H). P, parental cells; NC, negative control. Scale bar: 200 μm. (Original magnification, ×200)
In Vitro Differentiation of iPC Cells.
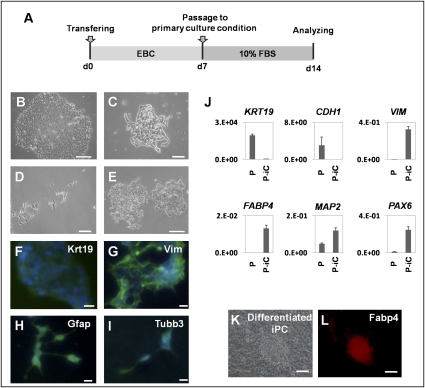
To determine the differentiation ability of iPC cells, we used floating cultivation as embryoid bodies (EBs). Because iPC cells formed ball-shaped structures in suspension culture, we transferred these EB-like structures to EB culture conditions (EBC). These conditions were gelatin-coated plates maintained in DMEM/F12 containing 20% knockout-certified serum replacement. Culture was continued for another 7 days (Fig. 3A). Attached cells, named PostiPC cells, began to proliferate after 48 h. PostiPC cells were analyzed by the experiments described below and were compared to parental and iPC cells.
Fig. 3.
Embryoid body (EB)-like formation mediated differentiation of iPC cells induced from DLD-1. (A) Schedule of induction from iPC cells to PostiPC cells. (B–E) After forming EB-like structures, iPC cells were transferred to primary culture conditions. Seven days later, attached (PostiPC) cells showed various morphologies, resembling those of epithelial cells (B), mesenchymal cells (C), neuronal cells (D), and mixed (E). (F–I) Immunocytochemistry confirmed the expression of Krt19 (F), Vim (G), Gfap (H), and Tubb3 (I) in these cells. (J) Real-time RT-PCR analysis verified the expression of differentiation markers, such as KRT19, CDH1, VIM, FABP4, MAP2, and PAX6. The expression of mRNA copies was normalized against GAPDH mRNA expression. (K and L) Directed differentiation of iPC cells into adipocytes showed differentiated iPC cells (K) that were positive for Fabp4 (L). P, parental cells; P-iC, PostiPC cells.
To determine the differentiation ability of iPC cells in vitro, we introduced iPC cells according to the methods of iPS (7). PostiPC cells showed various types of morphology, resembling those of epithelial cells, mesenchymal cells, and neuronal cells (Fig. 3 B–E). Immunocytochemistry detected cells that were positive for keratin 19 (Krt19) representing endoderm, vimentin (Vim) representing mesoderm and parietal endoderm, bIII-tubulin (Tubb3) representing ectoderm, and glial fibrillary acidic protein (Gfap) representing ectoderm (Fig. 3 F–I). RT-PCR confirmed, in addition to VIM, the expression of FABP4 representing mesoderm, microtubule-associated protein 2 (MAP2) representing ectoderm, and paired box 6 (PAX6) representing ectoderm in PostiPC cells (Fig. 3J). The expression of CDH1 representing endoderm and KRT19 decreased in PostiPC cells. In particular, the gene expression of mesoderm and endoderm was increased in PostiPC cells, which was low or difficult to detect in the parental cells.
We then examined whether lineage-directed differentiation of iPC cells could be induced by methods reported for mesenchymal stem cells. We seeded iPC cells with supplements inducing adipocytes and maintained them under differentiation conditions for 2 weeks. The cells proliferated and immunocytochemistry detected cells positive for Fabp4 (Fig. 3 K and L). In contrast, immunocytochemistry on parental cells in the corresponding culture detected cells that were negative for Fabp4. These data demonstrated the possibility that iPC cells, compared to parental cells, could differentiate into three germ layers in vitro and indicated that cells acquired different properties.
Epigenetic Modification of Immature Status-Related Genes.
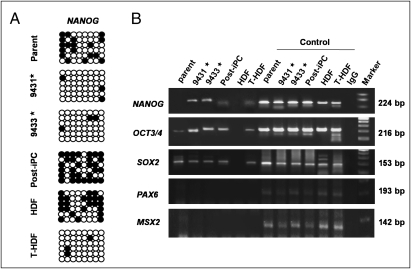
Bisulfite genomic sequencing analyses were used to evaluate the methylation statuses of cytosine guanine dinucleotides (CpG) in the promoter regions of pluripotent-associated genes such as NANOG. The results revealed that the CpG dinucleotides of NANOG promoter were less methylated in transfected HDF (T-HDF) cells and two iPC clones, whereas the nucleotides were methylated in HDF, parental cancer cells, and PostiPC cells (Fig. 4A). Chromatin immunoprecipitation with trimethyl-histone H3 protein at lysine 4 (H3K4) antibody was used to analyze histone modification (Fig. 4B). The histone modification analyses for NANOG gene promoter showed that H3K4 was trimethylated in iPC, PostiPC, and T-HDF (14), whereas that of parental cancer cells and HDF was not detected. Similarly, the H3K4 trimethylation of OCT3/4 gene promoter increased in iPC, PostiPC, and T-HDF, compared to parental cancer cells and HDF, respectively. The trimethylation of SOX2 gene promoter was detected before and after the reprogramming of cancer cells, whereas the trimethylation of T-HDF, but not HDF, was detected. The trimethylation of PAX6 and MSX2 gene promoter was not detected. These findings demonstrated activation of the promoter regions of immature status-related genes in iPC cells.
Fig. 4.
Epigenetic modification of immature status-related genes evaluated with bisulfite sequencing analysis and chromatin immunoprecipitation in DLD-1. (A) From the analysis of epigenetic status, bisulfite genomic sequencing analyses in the promoter regions of genes inducing immature status, NANOG, revealed that they were not methylated appreciably in iPC cells (clones 9431 and 9433), whereas the CpG dinucleotides of the regions were methylated in parental cancer cells and PostiPC cells (open and closed circles indicate unmethylated and methylated, respectively). (B) Chromatin immunoprecipitation with trimethyl-K4 H3 antibody was used to analyze the histone modification status in parental, iPC, and PostiPC cells. H3 lysine 4 was methylated in these regions for NANOG in iPC cells compared to that in parental and PostiPC cells. H3 lysine 4 was methylated in these regions for OCT3/4 in iPC and PostiPC cells compared to those in parental cells (results were assessed in contrast to each input DNA). HDF and transfected HDF (T-HDF) were analyzed for comparison. As a control, respective sheared chromatin sample was used for quantitative PCR. *, clones of iPC cells.
Gene Expression and iPC and PostiPC Surface Markers.
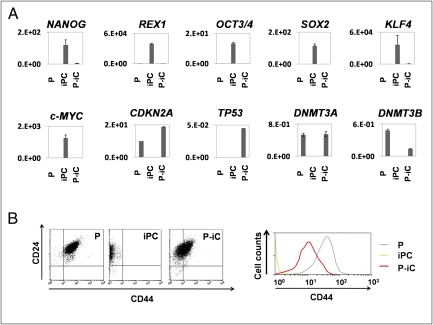
PostiPC cells, but not iPC cells, showed increased expression of several differentiation markers such as FABP4, MAP2, and PAX6 (Fig. 3J), and markedly decreased expression of NANOG, REX1, OCT3/4, SOX2, KLF4, and c-MYC, which corresponded to those of parental cells (Fig. 5A). The expression of P16(INK4A) in PostiPC cells increased more than that in parental cells.
Fig. 5.
Expression of immature and differentiated status-related genes in parental, iPC, and PostiPC cells induced from DLD-1. (A) The expression of NANOG, REX1, OCT3/4, SOX2, KLF4, and c-MYC markedly decreased in iPC cells. The expression of CDKN2A, DNMT3A, and DNMT3B increased in PostiPC cells compared to iPC cells. The mRNA copy expression was normalized against GAPDH mRNA expression. (B) (Left) Flow cytometry showed a shift of the CD24/CD44 population in parental, iPC, and PostiPC cells. (Right) The CD44 population in PostiPC cells decreased compared with that of parental cells. P, parental cells; P-iC, PostiPC cells.
In colorectal cancer, the surface markers for CD24 and CD44 have been reported as CSC markers (16, 17). Flow cytometry showed that CD44 expression was markedly reduced in iPC cells and was increased in PostiPC cells. The CD44 expression level was relatively low in PostiPC cells compared with that of parental cells (Fig. 5B). CD 24 expression level was not changed apparently. The results showed the transition of the population from parental cells to PostiPC, suggesting an alteration of biological characteristics, such as sensitivity to chemicals.
Sensitivity of Anticancer Drug and Differentiation-Inducing Chemicals.
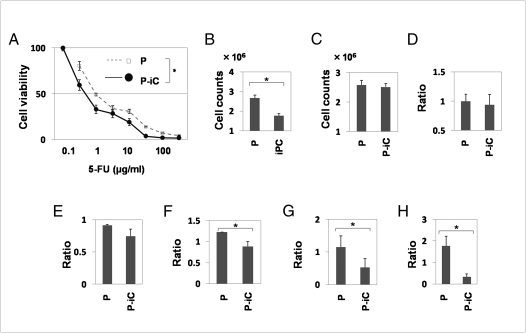
The methyl thiazolyl tetrazolium (MTT) assay showed that PostiPC cells acquired sensitivity to 5-fluorodeoxyuridine (5-FU) to a greater degree than parental cells (n = 11, P = 0.003, Wilcoxon rank test; Fig. 6A). These data suggest the possibility that PostiPC cells, via iPC cells, could be more sensitive to therapeutic agents.
Fig. 6.
In vitro methyl thiazolyl tetrazolium (MTT) analyses, proliferation and invasion assay. (A) The 5-FU MTT assay revealed significant differences in PostiPC and DLD-1 parental cells (n = 11, P = 0.003, Wilcoxon rank test). (B) Proliferation assays for ES-culture conditions showed differences in growth of iPC cells and DLD-1 parental cells (n = 4, P = 0.046, Wilcoxon rank test). (C) Proliferation assays in primary culture conditions showed no significant differences between DLD-1 parental and PostiPC cells. (D) Invasion assay showed no significant differences between DLD-1 parental and PostiPC cells (relative ratio and parental cell average). (E and F) Proliferation assays showed differences in ratio with control (with no treatment) under the differentiation-inducing treatment with vitamins A and D supplementation (n = 8, P = 0.512 and 0.049, respectively, Wilcoxon rank test). (G and H) Invasion assays showed significant differences in the ratio with control (with no treatment) cells under the differentiation-inducing treatment with vitamin A and D supplementation (n = 6, P = 0.013 and 0.003, respectively, Wilcoxon rank test). P, parental cells; P-iC, PostiPC cells. *, P < 0.05.
Proliferation assays for 48 h in Matrigel and the mTeSR1 medium, an ES-culture condition, showed that iPC cell growth significantly decreased compared with parental cells based on mean cell counts in four independent wells (n = 4, P = 0.046, Wilcoxon rank test; Fig. 6B). There was, however, no significant difference in 48-h proliferation of parental and PostiPC cells in primary culture conditions (Fig. 6C). An invasion assay showed no significant differences between parental and PostiPC cells (Fig. 6D). In a sharp contrast, the 48-h proliferation assays with the presence of retinoic acid (RA) and 1,25-dihydroxy vitamin D3 (VD3), which are known as inducers of differentiation (18, 19), resulted in a reduction in PostiPC cells compared with mock-treated parental cells (n = 8, P = 0.512 and 0.049, respectively, Wilcoxon rank test; Fig. 6 E and F). Invasion assays were performed after the 48-h treatment; the data indicated that, in the presence of RA and VD3, the invasion activity of PostiPC cells was reduced compared with parental cells (n = 6, P = 0.013 and 0.003, respectively, Wilcoxon rank test; Fig. 6 G and H).
Assessment of Tumorigenic Properties.
To determine tumorigenic properties in vivo, PostiPC cells were transplanted s.c. at several densities into dorsal flanks of NOD/SCID mice. Four weeks after injection, we observed tumor formation (Fig. S3A). There were significant differences between PostiPC cells and parental cells (P < 0.01, Wilcoxon rank test; Fig. S3B). These data demonstrated the reduction of tumorigenesis via reprogramming process; this finding may be applied to anticancer therapy.
Discussion
The role of CSCs was noted in acute myeloid leukemia (3). The possible involvement of CSCs has since been shown in several solid tumors (20–22). In solid tumors, these results suggest that the CSC population, although it is likely a minority, is related to treatment resistance and problems of relapse or metastasis (1, 2). CSCs, through their self-renewal and drug-resistant capacities, may share properties that are conducive to persistence and proliferation, even after anticancer therapy. It is important to understand their biological characteristics, as specific markers of all CSCs have not yet been identified.
Recently, several reports have shown that tumor development is associated with genetic and epigenetic changes of the genome, and that epigenetic modifications play an important role in tumor heterogeneity (23). Several experiments, such as nuclear transplantation, ES cell fusion, and transfection with several transcription factors, have demonstrated reprogramming of terminally differentiated cells into pluripotent embryonic cells, which is linked to the development of an organism by resetting the epigenetic modifications (4–9). In previous reports, the transcription factor NANOG was required to maintain the pluripotency and self-renewal of ES cells (13, 14).
According to genetic and epigenetic analyses in previous reports, immature status related to promoter activation in defined genes, such as NANOG, plays a very important role in the establishment of a pluripotent state (6–9, 13, 14). To prepare iPC cells, we manufactured a specific tool that could detect the pluripotent state in living cells based on the results of previous studies. We investigated NANOG expression in gastrointestinal cancer cell lines, corresponding to human iPS cells and teratocarcinoma NTERA-2, which had higher NANOG expression. The expression could not be detected in PostiPC cells with this system. A low efficiency, as shown in iPS (6–9, 13, 14), suggests a possibility that only a minority of tumor cell lines possesses specific potential to obtain the property of iPC, or more likely that multiple mechanisms are involved in full execution of reprogramming. We have to consider a possibility that sphere-forming cells might be rare among the original cancer cell populations.
In this study, the tumor-suppressor gene P16(INK4A), which acts against the self-renewal of ES cells (10, 12), was repressed in iPC cells. Our analysis indicated that P16(INK4A) expression increased in PostiPC cells, which may relate to the notion that P16(INK4A) up-regulation is involved in the suppression of transformed phenotypes and their sensitization to therapeutic agents (24). The sequence study of P16(INK4A) promoter indicated the demethylation in PostiPC cells from DLD-1 cells, whereas the sequence of parental cells was methylated. This study suggests that the reactivation of tumor suppressor genes by reprogramming may play a role in increased chemosensitivity to 5-FU and the regression of cell proliferation and invasiveness under differentiation-inducing conditions. The Rb/P16(INK4A) tumor-suppressive pathway has been reported to be abrogated in several tumors (24). It is necessary to investigate the specific analysis in the pathways to assess the contribution of TSG.
Presumably, the suppression of tumors and their sensitization to induced differentiation are the result of genetic and epigenetic modifications. This result supports the possibility of new cancer therapies via reprogramming approaches even in cancer cells that should have corrupted genetic codes. In the present study, iPC cells were induced from eight cancer cells, including cancers of colorectum, esophagus, stomach, pancreas, liver and bile ducts (Fig. S4). Here, iPC was established from cancer cell lines. It is necessary to demonstrate universality in primary tumors and to more efficiently investigate the factors and population in relation to the induction of iPC cells: points to be elucidated and developed include differences of normal and tumor cells, individual responses, efficiency, and reagent delivery system. As novel therapeutic approaches, the heterogeneity of reprogrammed cancer cells remains to be investigated.
Materials and Methods
Cell Lines and Culture.
Twenty cell lines derived from human gastrointestinal cancers included colorectal cancer (Caco2, DLD-1, HCT116, HT-29, KM12SM, LoVo, and SW480), esophageal cancer (TE-10), gastric cancer (MKN45), pancreatic cancer (BXPC-3, MIAPaCa-2, PANC-1, and PSN-1), hepatocellular carcinoma (Hep3B, HepG2, HLE, HLF, HuH-7, and PLC), cholangiocellular carcinoma (HuCCT-1), and teratocarcinoma (NTERA-2 clone D1). NTERA-2 was provided by DS Pharma Biomedical (Osaka). These cell lines were maintained in DMEM (Nakalai Tesque, Kyoto) containing 10% FBS at 37 °C under a 5% humidified CO2 atmosphere. HDF was purchased from Toyobo (CA106K05a; Osaka) as a normal cell control and maintained with the Fibroblast Growth Medium kit (CA116500; Toyobo). Plasmids were purchased from Addgene (Cambridge, MA), Clontech (Palo Alto, CA), Cell Biolabs (San Diego), and Open Biosystems (Huntsville, AL). The plasmids used in this study are summarized in Table S1. These transfectants were grown in DMEM supplemented with 10% FBS and puromycin (2 μg/mL), and transferred to specific culture conditions as described in the supporting information. All transfectants with retrovirus were made with the ViraDuctin retrovirus transduction kit (Cell Biolabs). Those with lentivirus were made with the Virapower packaging mix (Invitrogen, Carlsbad, CA) or Arrest-In (Open Biosystems). In brief, cancer cell lines were transfected with adequate plasmid at a concentration of 4 μg/μl by using lipofectamine (Lipofectamine 2000; Invitrogen), and incubated in glucose-free Opti-MEM (Invitrogen). All experiments were performed at 50–70% cell confluence and results were confirmed in at least three independent experiments. All-in-one-type fluorescence microscopy (BZ-8000; Keyence, Osaka) with digital photographic capability was used to visualize cells at several magnifications. The growth rates of the cultured gastrointestinal cancer cell lines were measured by counting cells using CellTac (Nihon Koden, Tokyo). The optimization of retroviral transduction of human cancer cell lines was performed as shown in supporting information. Vectors used are shown in Table S1.
RNA Preparation and RT-PCR.
Total RNA was prepared by using TRIzol reagent (Invitrogen). Reverse transcription was performed with SuperScriptIII (Invitrogen). To confirm PCR amplification, 25–35 cycles of the PCR were performed by using a PCR kit (Takara, Kyoto) on a Geneamp PCR system 9600 (PE Applied Biosystems, Foster City, CA) with the following condition: 95 °C for 10 s, 60 °C for 10 s, and 72 °C for 60 s. An 8-μl aliquot of each reaction mixture was size-fractionated in a 1.5% agarose gel and visualized with ethidium bromide staining. To confirm RNA quality, PCR amplification was performed for the glyceraldehyde-3-phosphate dehydrogenase (GAPDH) gene using the specific primers (Tables S2 and S3). For quantitative assessment, we evaluated the gene expression by RT-PCR analysis. Quantitative real-time RT-PCR was performed by using a LightCycler TaqMan Master kit (Roche Diagnostics, Tokyo) for cDNA amplification of target specific genes. The expression of mRNA copies was normalized against GAPDH mRNA expression. The detailed condition for Quantitative real-time RT-PCR assessment is shown in supporting information. Primers used are shown in Tables S2 and S3.
Drugs and Antibodies.
Antibodies used for immunocytology were against Nanog, Ssea-3, Ssea-4, Tra-1-60, Tra-1-81, Tra-2-49, Tubb3, Gfap, Vim (Chemicon International, Temecula, CA), and Krt19 (OriGene Technologies, Rockville, MD). Differentiation to adipocytes was induced by specific supplements (Adipogenic Supplement 390416; Invitrogen).
Bisulfite Sequencing.
Genomic DNA was treated with Applied Biosystems methySEQr Bisulfite Conversion kit (Applied Biosystems) according to the manufacturer’s recommendations. Treated DNA was purified with QIAquick column (Qiagen, Valencia, CA). The human NANOG gene promoter regions were amplified by PCR. The PCR products were subcloned with pCR2.1-TOPO. Every clone of each sample was verified by sequencing with the T3 and T7 primers. The analysis used Sequencing Analysis Software v5.2 (Applied Biosystems). Primer sequences used for PCR amplification are provided in Table S3.
Chromatin Immunoprecipitation Assay.
Approximately 1 × 10⁷ cells were cross-linked with 1% formaldehyde for 10 min at room temperature and quenched by adding glycine. The cell lysate was treated to share a chromatin-DNA complex with an enzymatic shearing kit (Active Motif, Carlsbad, CA). Immunoprecipitation used Protein G magnetic beads (Active Motif)-linked anti-trimethyl lysine 4 histone H3 antibody (Nippongene, Toyama, Japan), or a negative control IgG kit (Active Motif). Eluates were used as templates for quantitative PCR. Each sheared chromatin sample was used for quantitative PCR as a control. Primer sequences used for PCR amplification are provided in Table S3.
Flow Cytometry.
Flow cytometry was performed on trypsin-dissociated parental cells, iPC, and PostiPC cells by using antibodies for CD24 (BD Biosciences, Sparks, MD) and CD44 (BD Biosciences). 7-AAD (eBioscience, San Diego, CA) preincubation was used to exclude dead cells. To assess the expression of the reprogrammed cells, iPC cells were assessed in the isolated colonies after the transfection of NANOG promoter-GFP clone. Cells were analyzed by using a FACScan flow cytometer equipped with CellQuest software (FACS caliber; BD Biosciences).
RA and VD3 Treatment.
RA and VD3 were purchased from Sigma–Aldrich (St. Louis). RA was dissolved in 99% ethanol as a 100 μM stock solution. The cells were allowed to settle for 48 h in DMEM supplemented with 100 nM RA. VD3 was dissolved in 99% ethanol as a 10 M stock solution. The cells were allowed to settle for 48 h in DMEM supplemented with 10 nM VD3. To assess the proliferation in the presence of RA and VD3, the cells were grown in these media for another 48 h. Cell viability was determined with the Cell Counting kit incorporating WST-8 (Dojindo Lab., Tokyo). WST-8 (10 μL) was added to 100 μL of the medium containing each supplement above, and the absorbance was read at 450 nm by using a microplate reader (Model 680XR; Bio-Rad Laboratories, Hercules). All experiments were performed at 30–80% cell confluence, and the results were confirmed in at least three independent experiments.
Chemosensitivity Assessment.
To assess the sensitivity to 5-FU in vitro, cells at different concentrations were evaluated with an MTT assay. 5-FU was purchased from Kyowa Hakkou (Tokyo). The cells were allowed to settle for 96 h in DMEM supplemented with several concentrations of 5-FU, and viability was assessed.
Invasion Assays.
Cell invasion was assessed with a CytoSelect Cell Invasion Assay according to the manufacturer's protocol (Cell Biolabs). Cells (1.0 ×10⁵) in DMEM were placed on 8.0-m-pore size membrane inserts in 96-well plates, and DMEM with 10% FBS was placed in the bottom of the wells. After 24 h, cells that did not invade were removed from the top side of the membrane chamber, and the cells from the underside of the membrane were completely dislodged by tilting the membrane chamber in Cell Detachment Solution (Cell Biolabs). Lysis Buffer/CyQuannt GR dye solution (Cell Biolabs) was added to each well, and the fluorescence of the mixture was read with a fluorescence plate reader at 480 nm/520 nm.
In Vivo Analysis.
The tumorigenic properties were evaluated on trypsin-dissociated cells with parental and PostiPC cells. We transplanted them suspended in DMEM/Matrigel (BD Biosciences) s.c. into the dorsal flanks of NOD/SCID mice (CREA, Tokyo) in several concentrations. Tumors were dissected and measured 4 weeks after injection.
Statistical Analysis.
For continuous variables, the results are expressed as means ± SEs of the mean. The relationships among gene expressions or cell counts were analyzed with χ2 and Wilcoxon rank tests. All tests were analyzed with JMP software (SAS Institute, Cary, NC). Differences with P values <0.05 were considered statistically significant.
Supplementary Material
Footnotes
The authors declare no conflict of interest.
This article contains supporting information online at www.pnas.org/cgi/content/full/0912407107/DCSupplemental.
References
- 1.Reya T, Morrison SJ, Clarke MF, Weissman IL. Stem cells, cancer, and cancer stem cells. Nature. 2001;414:105–111. doi: 10.1038/35102167. [DOI] [PubMed] [Google Scholar]
- 2.Pardal R, Clarke MF, Morrison SJ. Applying the principles of stem-cell biology to cancer. Nat Rev Cancer. 2003;3:895–902. doi: 10.1038/nrc1232. [DOI] [PubMed] [Google Scholar]
- 3.Bonnet D, Dick JE. Human acute myeloid leukemia is organized as a hierarchy that originates from a primitive hematopoietic cell. Nat Med. 1997;3:730–737. doi: 10.1038/nm0797-730. [DOI] [PubMed] [Google Scholar]
- 4.Thomson JA, et al. Embryonic stem cell lines derived from human blastocysts. Science. 1998;282:1145–1147. doi: 10.1126/science.282.5391.1145. [DOI] [PubMed] [Google Scholar]
- 5.Hochedlinger K, Jaenisch R. Nuclear reprogramming and pluripotency. Nature. 2006;441:1061–1067. doi: 10.1038/nature04955. [DOI] [PubMed] [Google Scholar]
- 6.Takahashi K, Yamanaka S. Induction of pluripotent stem cells from mouse embryonic and adult fibroblast cultures by defined factors. Cell. 2006;126:663–676. doi: 10.1016/j.cell.2006.07.024. [DOI] [PubMed] [Google Scholar]
- 7.Takahashi K, et al. Induction of pluripotent stem cells from adult human fibroblasts by defined factors. Cell. 2007;131:861–872. doi: 10.1016/j.cell.2007.11.019. [DOI] [PubMed] [Google Scholar]
- 8.Yu J, et al. Induced pluripotent stem cell lines derived from human somatic cells. Science. 2007;318:1917–1920. doi: 10.1126/science.1151526. [DOI] [PubMed] [Google Scholar]
- 9.Yu J, et al. Human induced pluripotent stem cells free of vector and transgene sequences. Science. 2009;324:797–801. doi: 10.1126/science.1172482. [DOI] [PMC free article] [PubMed] [Google Scholar]
- 10.Dabelsteen S, et al. Epithelial cells derived from human embryonic stem cells display p16INK4A senescence, hypermotility, and differentiation properties shared by many P63+ somatic cell types. Stem Cells. 2009;27:1388–1399. doi: 10.1002/stem.64. [DOI] [PMC free article] [PubMed] [Google Scholar]
- 11.Hong H, et al. Suppression of induced pluripotent stem cell generation by the p53-p21 pathway. Nature. 2009;460:1132–1135. doi: 10.1038/nature08235. [DOI] [PMC free article] [PubMed] [Google Scholar]
- 12.Li H, et al. The Ink4/Arf locus is a barrier for iPS cell reprogramming. Nature. 2009;460:1136–1139. doi: 10.1038/nature08290. [DOI] [PMC free article] [PubMed] [Google Scholar]
- 13.Loh YH, et al. The Oct4 and Nanog transcription network regulates pluripotency in mouse embryonic stem cells. Nat Genet. 2006;38:431–440. doi: 10.1038/ng1760. [DOI] [PubMed] [Google Scholar]
- 14.Wu Q, et al. Sall4 interacts with Nanog and co-occupies Nanog genomic sites in embryonic stem cells. J Biol Chem. 2006;281:24090–24094. doi: 10.1074/jbc.C600122200. [DOI] [PubMed] [Google Scholar]
- 15.Adewumi O, et al. International Stem Cell Initiative. Characterization of human embryonic stem cell lines by the International Stem Cell Initiative. Nat Biotechnol. 2007;25:803–816. doi: 10.1038/nbt1318. [DOI] [PubMed] [Google Scholar]
- 16.Vermeulen L, et al. Single-cell cloning of colon cancer stem cells reveals a multi-lineage differentiation capacity. Proc Natl Acad Sci USA. 2008;105:13427–13432. doi: 10.1073/pnas.0805706105. [DOI] [PMC free article] [PubMed] [Google Scholar]
- 17.Du L, et al. CD44 is of functional importance for colorectal cancer stem cells. Clin Cancer Res. 2008;14:6751–6760. doi: 10.1158/1078-0432.CCR-08-1034. [DOI] [PubMed] [Google Scholar]
- 18.Huang ME, et al. Use of all-trans retinoic acid in the treatment of acute promyelocytic leukemia. Blood. 1988;72:567–572. [PubMed] [Google Scholar]
- 19.zur Nieden NI, Kempka G, Ahr HJ. In vitro differentiation of embryonic stem cells into mineralized osteoblasts. Differentiation. 2003;71:18–27. doi: 10.1046/j.1432-0436.2003.700602.x. [DOI] [PubMed] [Google Scholar]
- 20.Singh SK, et al. Identification of human brain tumour initiating cells. Nature. 2004;432:396–401. doi: 10.1038/nature03128. [DOI] [PubMed] [Google Scholar]
- 21.Kim CF, et al. Identification of bronchioalveolar stem cells in normal lung and lung cancer. Cell. 2005;121:823–835. doi: 10.1016/j.cell.2005.03.032. [DOI] [PubMed] [Google Scholar]
- 22.O’Brien CA, Pollett A, Gallinger S, Dick JE. A human colon cancer cell capable of initiating tumour growth in immunodeficient mice. Nature. 2007;445:106–110. doi: 10.1038/nature05372. [DOI] [PubMed] [Google Scholar]
- 23.Hahn WC, Weinberg RA. Rules for making human tumor cells. N Engl J Med. 2002;347:1593–1603. doi: 10.1056/NEJMra021902. [DOI] [PubMed] [Google Scholar]
- 24.Sherr CJ, McCormick F. The RB and p53 pathways in cancer. Cancer Cell. 2002;2:103–112. doi: 10.1016/s1535-6108(02)00102-2. [DOI] [PubMed] [Google Scholar]
Associated Data
This section collects any data citations, data availability statements, or supplementary materials included in this article.


