

Abstract
Theories of spatial attentional control have been largely based upon studies of patients suffering from visuospatial neglect, resulting from circumscribed lesions of frontal and posterior parietal cortex. In the intact brain, the control of spatial attention has been related to a distributed frontoparietal attention network. Little is known about the nature of the control mechanisms exerted by this network. Here, we used a novel region-of-interest approach to relate activations of the attention network to recently described topographic areas in frontal cortex [frontal eye field (FEF), PreCC/IFS (precentral cortex/inferior frontal sulcus)] and parietal cortex [intraparietal sulcus areas (IPS1–IPS5) and an area in the superior parietal lobule (SPL1)] to examine their spatial attention signals. We found that attention signals in most topographic areas were spatially specific, with stronger responses when attention was directed to the contralateral than to the ipsilateral visual field. Importantly, two hemispheric asymmetries were found. First, a region in only right, but not left SPL1 carried spatial attention signals. Second, left FEF and left posterior parietal cortex (IPS1/2) generated stronger contralateral biasing signals than their counterparts in the right hemisphere. These findings are the first to characterize spatial attention signals in topographic frontal and parietal cortex and provide a neural basis in support of an interhemispheric competition account of spatial attentional control.
Introduction
Evidence from monkey physiology and human neuroimaging studies indicates that spatially selective attention affects processing in the visual system (Kastner and Ungerleider, 2000; Corbetta and Shulman, 2002; Reynolds and Chelazzi, 2004; Serences and Yantis, 2006). When attention is directed to a location in the visual field, neural responses evoked by stimuli at the attended location are greater than those at ignored locations. These modulatory signals appear to originate from higher-order areas in frontal and parietal cortex, including the superior parietal lobule (SPL), intraparietal sulcus (IPS), the frontal eye fields (FEF), and the supplementary eye field (SEF), and are transmitted via feedback to the visual system (Kastner et al., 1999; Moore and Armstrong, 2003). However, it remains largely unknown how the frontoparietal network controls the allocation of attention across the visual field.
Models of spatial attention control have emerged from behavioral studies of patients suffering from visuospatial hemineglect. One of the leading symptoms of this syndrome is the inability to direct attention to the contralateral visual field. Notably, the syndrome is more frequently associated with lesions of the right than the left hemisphere. To account for these observations, Heilman's “hemispatial” theory (Heilman and Van Den Abell, 1980) has proposed that the right hemisphere (RH) directs attention to both visual hemifields, whereas the left hemisphere (LH) directs attention to the right visual field (RVF) only (see also Mesulam, 1981). Thus, while the RH can compensate for LH damage, such compensation is not possible with RH damage, thereby resulting in neglect of the left visual field (LVF). An alternative account, Kinsbourne's “interhemispheric competition” theory, has proposed an opponent processor control system, in which each hemisphere directs attention toward the contralateral visual field and is balanced through reciprocal inhibition. Such inhibitory control could alternatively be achieved through cortico-subcortical interactions between parietal cortex and the superior colliculus (SC) (Sprague, 1966; Rafal, 1997). Neglect occurs as a consequence of an imbalanced system following damage to one of the processors, resulting in a bias toward the ipsilesional visual field (Kinsbourne, 1977).
Despite their differences, these accounts predict that higher-order cortex contains discrete representations of visual space that are involved in controlling attentional operations throughout the visual field. In the human brain, topographically organized areas have been identified in frontal cortex [FEF, precentral cortex/inferior frontal sulcus (PreCC/IFS)] and posterior parietal cortex (PPC) (IPS1–IPS5, SPL1) (for review, see Silver and Kastner, 2009), the locations of which are similar to known activations of the frontoparietal attention network (Kastner and Ungerleider, 2000; Corbetta and Shulman, 2002). We hypothesized that these topographic frontoparietal areas might be part of a distributed higher-order control system for spatial attention, and investigated attention-related signals in them. A spatial attention task (Fig. 1) served to identify activations of the attention network and to quantitatively examine attention signals in topographic frontoparietal cortex. Our findings provide evidence in support of an interhemispheric competition account of spatial attentional control and have led us to propose a novel model, which provides a framework to interpret both common behavioral asymmetries in the allocation of attention across the visual field, such as pseudoneglect, and pathologic attention deficits, such as neglect.
Figure 1.

Experimental design. Visual stimuli were presented in one of the four quadrants at a peripheral location and probed under two conditions: attended and unattended. A schematic outline of one scan run is shown. In the unattended condition (frame #2), subjects performed a demanding letter-counting task at fixation, counting the number of target letters among distracters, while ignoring the peripheral stimuli. In the attended condition (frame #5), subjects were instructed by a brief occurrence of a cue at fixation (frame #4) to covertly direct attention to one of the four peripheral locations and to count the occurrences of a target stimulus in the location closest to fixation. Attended and unattended presentations were interleaved with blank fixation periods (frames #1, #3, and #6) during which subjects performed the letter-counting task. Blocks of attended and unattended presentations alternated with blank periods.
Materials and Methods
Subjects, visual stimuli, and experimental design.
Nine healthy subjects (20–36 years old, four of them females, with normal or corrected-to-normal visual acuity) gave informed written consent to participate in the study, which was approved by the Institutional Review Panel of Princeton University. Each subject participated in one scanning session to perform the spatial attention task and in an additional session to localize topographic areas in frontal and parietal cortex.
Four colorful, complex images, each 2° × 2°, were presented in four nearby locations at 8–12 degrees eccentricity from the fixation point to either the upper right, lower right, upper left, or lower left quadrant (a schematic outline of one run is shown in Fig. 1) (Kastner et al., 1998, 1999). The four stimuli were presented simultaneously for 250 ms and at 1 Hz in blocks of 16 s with a temporal jitter of 250–750 ms. The order of stimuli and locations within the four stimuli display was randomized from presentation to presentation for a given block. The quadrant in which each of the displays appeared for a given block was chosen pseudo-randomly.
The visual presentations were probed under two conditions: attended and unattended. In the unattended condition, subjects performed a demanding letter-counting task at fixation (Fig. 1, frames 1, 3, and 6), counting the number of target letters (a–c) presented among distracters in a rapid serial visual presentation (RSVP) stream, while ignoring the peripheral stimuli (Fig. 1, frame 2). Each letter was presented for 250 ms. Target letters occurred every 1.45 s on average. In the attended condition (Fig. 1, frames 4–5), subjects were instructed by the occurrence of a cue at fixation to covertly direct attention to the peripheral display (Fig. 1, frame 5) and to count the occurrences of a target stimulus in the display location closest to fixation. The cue was a line presented for 500 ms close to the fixation point that was oriented toward the target location in one of the four quadrants. The cue was always valid and occurred 1 s before the peripheral stimuli appeared. While subjects performed the peripheral covert attention task, they discontinued performing the RSVP task at fixation. Upon the offset of the peripheral stimuli, subjects redirected attention to fixation and resumed the RSVP task. Attended and unattended blocks of visual stimuli were interleaved with blank periods during which subjects performed the RSVP task (Fig. 1, frames 1, 3, 6). A single scan run of 208 s consisted of a total of three attended and three unattended blocks of peripheral presentations. The target for each run was randomly chosen from among the four complex images and was presented to subjects before its start. At the end of each scanning run, subjects reported the number of target detections during each attended block. Twelve runs were tested during a scan session.
Visual display.
Visual displays were generated on a Macintosh G4 computer (Apple Computer) using MATLAB software (The MathWorks) and Psychophysics Toolbox functions (Brainard, 1997). A PowerLite 7250 liquid crystal display projector (Epson) outside the scanner room displayed the stimuli onto a translucent screen located at the end of the scanner bore. Subjects viewed the screen at a total path length of 60 cm through a mirror attached to the head coil. The screen subtended 30° of visual angle in the horizontal dimension and 26° in the vertical dimension. A trigger pulse from the scanner synchronized the onset of stimulus presentation to the beginning of the image acquisition.
Data acquisition.
Data were acquired with a 3T Allegra MRI scanner (Siemens) using a standard birdcage head coil. Each subject's head was surrounded by foam to reduce head movements. All functional images were acquired using a gradient echo, echo planar sequence [field of view (FOV), 256 × 256 mm2; 128 matrix; repetition time (TR) = 2–2.5 s; echo time (TE) = 41 ms; flip angle = 90°]. Twenty to 25 axial slices [slice thickness = 2 mm, gap = 1 mm, in-plane resolution = 2 × 2 mm2] covering frontal, parietal and dorsal occipital cortex were acquired in 12 series of 104 volumes each for the spatial attention task and in eight series of 144 volumes or six series of 240 volumes for topographic mapping of frontal and parietal cortex (for details, see Kastner et al., 2007; Konen and Kastner, 2008a,b). An in-plane magnetic field map image was acquired to perform echo planar imaging undistortion (FOV, 256 × 256 mm2; 128 matrix; TR, 345 ms; TE, 5.06/8.06 ms; flip angle, 40°; bandwidth, 260 Hz/pixel). Echo-planar images were aligned to a high-resolution anatomical scan acquired in each session (MPRAGE sequence; 256 matrix; TR, 2.5 s; TE, 4.38 s; flip angle, 8°; 1 mm3 resolution). In addition, a series of six high-resolution structural scans were acquired in a separate scan session, which were averaged for cortical surface reconstructions (MPRAGE sequence, same parameters as above).
Data analysis.
Data were analyzed using the AFNI software package (Cox, 1996), FreeSurfer (Dale et al., 1999; Fischl et al., 1999), SUMA (http://afni.nimh.nih.gov/afni/suma), and MATLAB (The MathWorks). The functional images were motion corrected to the image acquired closest in time to the anatomical scan and undistorted using the field map scan. Data were smoothed with a 4 mm Gaussian kernel. Each time series was normalized to its mean intensity.
For the spatial attention task, a multiple regression analysis was performed. Square-wave regressors that matched the time course of the design were identified as regressors of interest for the multiple regression analysis. Each of the regressors was then convolved with a gamma-variate function to best represent the idealized hemodynamic response. In addition, regressors of non-interest were included in the model to account for variance due to baseline shifts between time series, mean, linear, and quadratic trends, and head motion parameter estimates. To study the relationship of the frontoparietal attention network with topographic areas in frontal and parietal cortex, attended conditions were contrasted with unattended conditions. Statistical maps were thresholded at an F score of 10.80 (p < 0.001, uncorrected for multiple comparisons). Activated voxels were assigned to topographically organized areas in frontal (FEF, PreCC/IFS) and parietal (IPS1–IPS5, SPL1) cortex, as described in Definition of ROIs in topographically organized frontal and parietal cortex. All remaining activated voxels that were located outside of topographic frontal and parietal cortex were analyzed as “non-topographic” frontal or parietal cortex, respectively. The only exception was activated voxels located in the region of the human SEF in dorsomedial prefrontal cortex, which is an area that lacks topographic organization, but can be identified based on anatomical and functional characteristics. All analyses were performed separately for the RH and LH. Thus, activity related to spatial attention was analyzed in 14 PPC areas (IPS1–IPS5, SPL1, and non-topographic PPC in RH and LH) and seven frontal areas (FEF, PreCC/IFS, and non-topographic frontal cortex in RH and LH, and SEF). To quantify the overlap between the frontoparietal attention network and the topographically organized areas, the volume of the overlapping regions was then computed. To report Talairach coordinates, the statistical maps and structural images for each subject were transformed into Talairach space (Talairach and Tournoux, 1988) (Tables 1, 2).
Table 1.
Talairach coordinates and activated volumes for the memory-guided saccade task
| Area | x | y | z | Volume (mm3) | N | % Overlap with attention activations |
|---|---|---|---|---|---|---|
| Frontal areas | ||||||
| FEF | ||||||
| L | −34 (1.5) | −9 (2.3) | +52 (0.8) | 4012 (467) | 9 | 20 (4.6) |
| R | +33 (1.3) | −7 (1.6) | +50 (1.3) | 3876 (332) | 9 | 34 (3.9) |
| PreCC/IFS | ||||||
| L | −41 (1.2) | +3 (2.3) | +31 (1.2) | 2491 (335) | 8 | 25 (6.4) |
| R | +40 (1.9) | +5 (2.1) | +32 (1.1) | 2728 (452) | 8 | 34 (4.4) |
| PPC areas | ||||||
| IPS 1 | ||||||
| L | −26 (2.7) | −74 (1.1) | +32 (4.2) | 2306 (533) | 5 | 51 (3.2) |
| R | +23 (2.1) | −75 (2.2) | +33 (1.7) | 1774 (487) | 5 | 58 (12.1) |
| IPS 2 | ||||||
| L | −20 (2.3) | −72 (2.6) | +40 (2.9) | 1375 (208) | 8 | 39 (6.9) |
| R | +20 (1.5) | −67 (1.7) | +42 (2.2) | 1219 (292) | 8 | 53 (8.3) |
| IPS 3 | ||||||
| L | −21 (1.3) | −67 (2.7) | +45 (2.2) | 2062 (497) | 8 | 38 (8.5) |
| R | +20 (2.6) | −66 (2.6) | +48 (3.1) | 1646 (291) | 8 | 45 (9.6) |
| IPS 4 | ||||||
| L | −25 (2.5) | −62 (2.4) | +46 (2.9) | 1900 (235) | 8 | 35 (7.7) |
| R | +25 (3.2) | −59 (3.4) | +45 (2.1) | 1583 (209) | 8 | 51 (12.9) |
| IPS 5 | ||||||
| L | −31 (2.1) | −53 (3.2) | +48 (3.3) | 1959 (353) | 8 | 31 (6.6) |
| R | +32 (2.5) | −50 (3.9) | +48 (2.6) | 1630 (159) | 8 | 50 (11.5) |
| SPL1 | ||||||
| L | −12 (0.9) | −64 (1.9) | +46 (1.7) | 1389 (229) | 8 | 13 (1.5) |
| R | +9 (1.0) | −73 (2.0) | +43 (1.5) | 1505 (339) | 8 | 45 (7.8) |
Values are means (±SEM) of peak coordinates in millimeters. N, Number of subjects showing significant clusters of activation; % Overlap with attention activations, Out of the total number of voxels responding to the memory-guided saccade task, the percentage that also responded to spatial attention. L, Left; R, right.
Table 2.
Talairach coordinates and activated volumes for the spatial attention task
| Area | x | y | z | Volume (mm3) | N | % Overlap with topographic cortex |
||
|---|---|---|---|---|---|---|---|---|
| p < 0.01 | p < 0.001 | p < 0.0001 | ||||||
| Frontal areas | ||||||||
| FEF | ||||||||
| L | −38 (1.7) | −9 (1.9) | +49 (1.4) | 1734 (324) | 9 | 52 (9.3) | 50 (9.5) | 48 (8.1) |
| R | +36 (1.3) | −6 (1.8) | +50 (1.6) | 2858 (321) | 9 | 54 (8.0) | 52 (7.9) | 51 (5.4) |
| PreCC/IFS | ||||||||
| L | −41 (1.4) | +2 (1.3) | +31 (1.0) | 1282 (400) | 8 | 53 (5.1) | 54 (6.3) | 56 (11.1) |
| R | +41 (2.0) | +4 (1.2) | +30 (0.8) | 1990 (331) | 8 | 50 (3.7) | 50 (7.0) | 53 (7.1) |
| SEF | +0 (0.5) | +4 (2.5) | +53 (1.6) | 1468 (240) | 9 | |||
| PPC areas | ||||||||
| PPC | ||||||||
| L | −22 (0.9) | −67 (2.7) | +44 (2.3) | 7011 (1559) | 8 | 56 (3.6) | 57 (4.8) | 57 (4.2) |
| R | +19 (0.9) | −68 (2.5) | +44 (2.1) | 7028 (1214) | 8 | 57 (4.1) | 58 (6.7) | 57 (5.9) |
Values are means (±SEM) of peak coordinates in millimeters. N, Number of subjects showing significant clusters of activation; % Overlap with topographic cortex, Out of the total number of voxels responding to the spatial attention task, the percentage that was topographically organized. p values refer to the threshold of activation for the spatial attention task (main analysis: p < 0.001; control analyses: p < 0.01, p < 0.0001). L, Left; R, right.
Voxels that were assigned to topographic areas were often contiguous with clusters that were located outside topographically organized cortex. Therefore, it is possible that all of the activations obtained in the spatial attention task would overlap with topographically organized areas if a stringent enough threshold were applied. To address the possibility that the results were affected by arbitrarily chosen statistical thresholds used to generate statistical maps in the spatial attention task, a control analysis was conducted at different significance levels, one with a more liberal threshold (p < 0.01) than the one used in our main analysis (p < 0.001) and one with a more conservative threshold (p < 0.0001). We hypothesized that if different thresholds affected voxels assigned to topographic and non-topographic regions similarly, the proportion of voxels assigned to the different regions would remain the same regardless of the statistical threshold for the spatial attention task. Thus, even though the absolute number of voxels may increase or decrease in each area as a function of threshold, such an increase or decrease would be equally distributed across the different areas. Alternatively, if for example, non-topographic activations located adjacent to topographic areas were merely artifacts of a liberal threshold, the proportion of voxels would shift toward those located in topographic areas, which would present a confound for the data analysis. We calculated the average number of voxels activated in the spatial attention task that were located in topographic regions and in non-topographic regions for each of the three thresholds and then determined the proportion of voxels (topographic relative to non-topographic). One-way repeated-measures ANOVAs were performed for each hemisphere and region of interest (ROI) to determine whether the proportions differed depending on the threshold chosen for the spatial attention task.
A quantitative analysis of the time series of functional magnetic resonance imaging (fMRI) signals obtained in the spatial attention task was performed for each ROI and in each subject. The time series analysis was based on activated voxels yielded by the contrast attended versus unattended (thresholded at an F score of 10.80, p < 0.001, uncorrected for multiple comparisons). The raw fMRI signals were extracted from the motion-corrected and undistorted echoplanar imaging images. Linear, mean, and quadratic trends were removed from the time series, and the signals were then averaged across all voxels within a given ROI. fMRI signals for a given experimental condition (i.e., “attended,” or “unattended”) were normalized to the mean intensity of the four time points preceding the particular condition to yield percentage signal change and sorted by the location at which the visual stimuli were presented (LVF or RVF). Mean signal changes were then derived for each of the conditions by averaging the eight peak intensities of the fMRI time series obtained in a given condition. The mean signals within each of the ROIs in the LH and RH were further quantified for each subject by defining an Attention Modulation Index [AMI = (Ratt − Runatt)/(Ratt + Runatt); R, response as mean signal change; att, directed attention to the target location; unatt, peripheral stimuli ignored], which is an estimate of the magnitude of attentional effects on visually evoked activity. The AMI ranges from +1 to −1, with positive values indicating response enhancement and negative values indicating response suppression. AMIs were defined separately for presentation conditions in the RVF and LVF. A Lateralization Index (LI) was defined for each of the ROIs in the LH and RH for each subject to assess the degree to which the fMRI signals obtained in the attended condition showed a preference for contra- or ipsilateral presentations [LI = (Rcontra − Ripsi)/(Rcontra + Ripsi); contra, attention to contralateral presentations; ipsi, attention to ipsilateral presentations]. Positive values indicate stronger responses to contralateral than ipsilateral presentations; negative values indicate the opposite. AMIs and LIs for each ROI of right and left frontal cortex and PPC were then averaged across subjects to yield group data. Statistical significance of mean signal changes, AMIs and LIs were assessed using repeated-measures ANOVAs and paired t tests.
Since each ROI contained a different number of voxels, we considered the possibility that some of the results were due to volume differences among ROIs. To account for volume effects, a control analysis was conducted in which a fixed number of 20 voxels were randomly chosen from each ROI. The same analyses and statistical tests as described above were conducted for the fixed-volume ROIs in each subject and in the group.
To assess the spatial specificity of attention signals in voxels assigned to topographic areas, voxels within frontal cortex and PPC that responded to both tasks were separated into four ROIs based upon saccade phase (that is, whether they most strongly responded to memory-guided saccades made into the upper right, lower right, upper left, or lower left visual quadrants). Using Pearson's linear correlation, the time course of each voxel for the attention task was then correlated with the time course of every other voxel within the same ROI and between ROIs. This analysis yielded a 4 × 4 correlation matrix for each lobe (frontal cortex and PPC) and for each subject: the average pairwise correlation between spatial attention time courses of voxels within the same ROI as compared to the average pairwise correlation between voxel time courses within each of the different ROIs. The correlation of the time course of each voxel to itself was removed, as not to artificially inflate the average correlation values. Subjects' correlation matrices were then averaged to obtain a group correlation matrix separately for frontal cortex and PPC.
If the same voxels were responsive when subjects both covertly attended and performed memory-guided saccades to a particular quadrant, then the average pairwise correlation between attention time courses of voxels within the same ROI (defined by saccade phase) should be higher than the average pairwise correlation between voxels belonging to different ROIs. To test this hypothesis, we first calculated the difference between the average of the on-diagonal elements and the average of the off-diagonal elements of the 4 × 4 correlation matrix (the OnOff measure) for voxels within frontal cortex and PPC. The OnOff measure provided a single number that described how well attention time courses correlated between voxels within the same ROI versus those within different ROIs (Polyn et al., 2005).
A permutation test was then used to determine the significance of the OnOff correlation measure for the group data. For each subject and separately for frontal cortex and PPC, the location of each voxel was scrambled, so that a voxel was randomly assigned to a ROI and a new correlation matrix was calculated. Individual correlation matrices were averaged to create a new group correlation matrix and a new OnOff value. Ten thousand iterations were performed, which generated a distribution of OnOff values. A p value was then determined using the generated distributions for frontal cortex and PPC and the actual OnOff values obtained from the experiment.
Definition of ROIs in topographically organized frontal and parietal cortex.
Topographic areas in frontal and parietal cortex can be defined using a variety of tasks, including passive viewing of a colorful and dynamic periodic mapping stimulus that is also typically used to determine retinotopic maps in visual cortex (Swisher et al., 2007), a visual spatial attention task (Silver et al., 2005; Saygin and Sereno, 2008), or a memory-guided saccade task, as used here (Sereno et al., 2001; Schluppeck et al., 2005; Konen and Kastner, 2008a,b). The goal of all the different approaches is to map retinotopically organized areas in higher-order cortex and to define ROIs that can be used for subsequent independent investigations of their response properties (e.g., spatial attention functions, in the case of the current study). This overall approach is not different from that taken in many studies investigating response functions of retinotopic visual cortex (Kastner et al., 1998; Tootell et al., 1997, 1998). We will describe the task and data analysis procedures only briefly, since they have been documented in several previous studies (Kastner et al., 2007; Konen and Kastner, 2008a,b).
A memory-guided saccade task, in which subjects performed delayed saccades to multiple peripheral locations arranged clockwise around a central fixation point, was used to identify topographically organized areas in frontal and parietal cortex (Sereno et al., 2001; Schluppeck et al., 2005; Kastner et al., 2007; Konen and Kastner, 2008a,b). The task was performed at eight or 12 peripheral locations arranged clockwise around a central fixation point, with peripheral locations appearing 10 ± 2.5° from fixation. Stimulus eccentricity in the memory-guided saccade task was similar to the stimulus eccentricity used in the spatial attention task. Therefore, both tasks covered approximately the same visual space. A Fourier analysis was used to identify voxels activated by the task (Bandettini et al., 1993; Engel et al., 1997). To correctly match the phase delay of the time series of each voxel to the phase of the visual stimulus/saccade direction, and thereby localize the region of the visual field to which the underlying neurons responded best, the response phases were corrected for the hemodynamic lag (3 s). Contiguous clusters of voxels within frontal and parietal cortex activated by the memory-guided saccade task, showing a smooth progression of phase values corresponding to different visual field target locations and displaying phase reversals at shared boundaries between areas, were defined as topographically organized ROIs.
In PPC, six topographically organized areas were identified in each hemisphere within a contiguous band of activation located along the IPS and adjacent areas. Each area contained a representation of the contralateral visual hemifield and was separated from neighboring areas by alternating representations of the upper or lower vertical meridian (Fig. 2A, bottom) (Konen and Kastner, 2008a,b). Two areas were located in the posterior portion of the IPS (IPS1, IPS2), immediately anterior to visual area V7, and three areas were located anterior to IPS1/2, in the anterior/lateral branch of the IPS (IPS3, IPS4), and extending anteriorally into the intersection between the IPS and the postcentral sulcus (IPS5). An additional area branched off the medial border of the most superior IPS subregions and extended into the SPL, referred to as SPL1 (Fig. 2A, bottom). IPS1 was identified in only five out of nine subjects (S1, S4, S7–S9) due to differences in slice acquisition between subjects. IPS2–IPS5 and SPL1 were all identified in eight out of nine subjects (S1, S3–S9).
Figure 2.

Topographic areas in frontal and parietal cortex and the frontoparietal attention network. Activations projected onto an inflated surface of the subject's brain within frontal (top) and parietal cortex (bottom) from a representative subject (S9). A, Topographic maps were obtained using the memory-guided saccade task. The color legend is shown (middle) for voxels whose responses were correlated with the fundamental frequency of the remembered location, indicating the phase of the response. The visual field color legend labels the saccade direction/memorized location within the visual field to the voxel that is most responsive. Boundaries between PPC areas are outlined in white; continuous lines denote the upper vertical meridian, broken lines denote the lower vertical meridian. Topographic areas within frontal cortex (FEF, PreCC/IFS) and PPC (IPS1–IPS5, SPL1) are labeled. B, The frontoparietal spatial attention network was defined based on the contrast “attend to the periphery” versus “attend to fixation” (p < 0.001). A significant overlap of voxels activated in the spatial attention task with topographic frontal and parietal areas is immediately obvious. CS, Central sulcus.
Two topographically organized areas were identified in frontal cortex, one area at the junction of the superior branch of precentral cortex and the posterior portion of the superior frontal sulcus, in the region of the human FEF, and a second area at the junction of the inferior branch of precentral cortex and the posterior portion of the inferior frontal sulcus (PreCC/IFS) (Fig. 2A, top). The FEF was identified in all nine subjects, while the PreCC/IFS was identified in eight out of nine subjects (S1, S3–S9). Mean Talairach coordinates and activated volumes of frontal and parietal areas are given in Table 1.
Eye movement recordings.
Eye movements were monitored during scanning sessions in seven out of nine subjects (S3–S9) while performing the memory-guided saccade task and in five out of nine (S4–S6, S8, S9) subjects while performing the spatial attention task. The other subjects could not be eye-tracked due to technical issues at the time of the scan session. A stimulus screen was used with a hole of 1.9° in diameter located at one edge through which a subject's eye was viewed with the help of a telephoto lens (Model 504 with Long Range Optics, Applied Science Laboratories). The eye position was displayed in real time on a video monitor in the scanner control room, superimposed on the stimulus image. The experimenter observed the eye position display to ensure that the subjects were alert and performing the appropriate task, which was to either make a saccade in the correct direction during the memory-guided saccade task, or to maintain fixation throughout the spatial attention task. Eye position data were recorded on the stimulus computer through a serial interface with the eye-tracker control module. The eye tracking system, which measured the eye position at a rate of 60 Hz, had a resolution of 0.14° and detected differences in relative eye position of ∼0.25°.
Ilab software (Gitelman, 2002) was used to analyze the eye movement data. Eye position data were output as raw scene camera pixel locations and converted from pixel values to degrees of visual angle. For the memory-guided saccade task, we calculated the percentage of saccades correctly made to a target location over an entire scan session for each subject (for details of the analysis, see Kastner et al., 2007). For the spatial attention task, we calculated separate frequency histograms of the vertical and horizontal eye position data for each subject. Data collected during periods of covert attention to each of the four quadrants and during periods when stimuli were presented in each of the four quadrants, but subjects were not attending peripherally, were analyzed separately. t tests were then used to determine whether eye movements systematically deviated in any direction during each of the eight conditions. Additionally, one eye movement region (EMR), 1° × 1° in size, was defined around the central RSVP task and the number of times the gaze left this EMR was calculated.
Results
Relationship of the frontoparietal attention network and topographic areas
A spatial attention task was used to identify the frontoparietal attention network and to examine attention-related signals quantitatively in topographic areas of frontal and parietal cortex. In the attended condition, subjects were cued to covertly direct attention to one of four stimuli presented in the periphery of the right or the left visual field and to detect the occurrences of a target stimulus (Fig. 1). The same stimuli were also probed in an unattended condition during which subjects performed a demanding letter detection task at fixation. Subjects detected on average 88.5 ± 2.7% (mean, SEM) of the targets presented in the RVF and 90.8 ± 1.9% of the targets presented in the LVF, the difference of which was not significant (p > 0.20).
As in previous studies (Corbetta et al., 1998; Kastner et al., 1999), attention-related activations of the frontoparietal network were defined by contrasting periods of directed attention to peripheral stimuli with periods in which the same peripheral stimuli were ignored (p < 0.001, uncorrected for multiple comparisons). The extent of the activations for one representative subject is shown projected onto the reconstructed cortical surface in Figure 2B (see supplemental Figs. 1, 2 for additional subjects, available at www.jneurosci.org as supplemental material). Two clusters of activated voxels were localized bilaterally in superior and inferior lateral frontal cortex: the first in the region of the FEF and the second in the region of PreCC/IFS. A third region in dorsomedial frontal cortex (DMFC) was also activated (see Fig. 8A). This area has been previously observed in visuospatial attention tasks (Bon and Lucchetti, 1997; Nobre et al., 1997; Kastner et al., 1999; Hopfinger et al., 2000) and is commonly referred to as the putative human SEF. In PPC, a large swath of activation was found bilaterally along the IPS, and extending medially into the SPL. These clusters of activations in frontal and parietal cortex were found consistently across subjects (see Table 2 for mean Talairach coordinates and volumes) and confirm many previous studies of the frontoparietal attention network (Corbetta et al., 1993; Nobre et al., 1997; Vandenberghe et al., 1997; Culham et al., 1998; Kastner et al., 1999; Wojciulik and Kanwisher, 1999; Hopfinger et al., 2000; Yantis et al., 2002).
Figure 8.
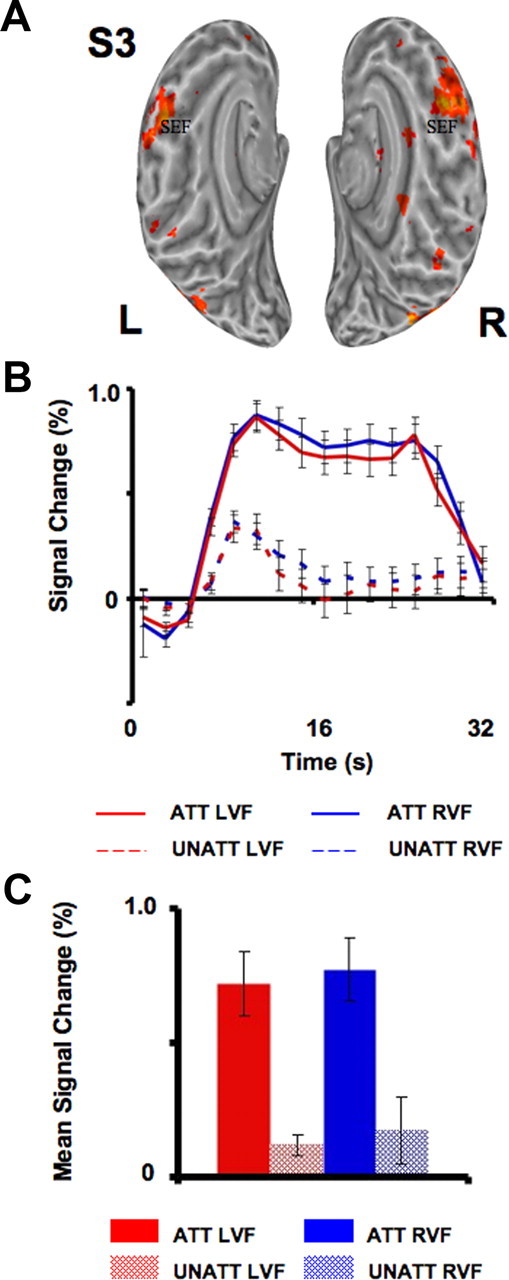
Attention signals in SEF. A, An example from one subject (S3) illustrates the extent of the activations found with the spatial attention task in human SEF (attended vs unattended, p < 0.001). B, C, fMRI signals (B) and mean signal changes (C) obtained in SEF averaged across all subjects (n = 9) during attended conditions (solid lines/bars) and unattended conditions (dashed lines/hatched bars) are also shown. For each subject, mean signal change was defined as the average of the eight peak intensities of the fMRI signal obtained during each condition. Red lines/bars indicate activity evoked by stimuli that appeared within the LVF, while blue lines/bars indicate activity evoked by stimuli within the RVF. Error bars indicate SEM across subjects.
To investigate the overlap of activations evoked during the spatial attention task with topographically identified frontal and parietal areas in the same subjects, the activations from both tasks were projected onto the cortical surface in each subject (Fig. 2), and topographic area boundaries were projected onto the activations evoked during the spatial attention task (supplemental Figs. 1, 2, available at www.jneurosci.org as supplemental material). A considerable overlap is immediately obvious from comparing the activations obtained with the spatial attention task (Fig. 2B; supplemental Figs. 1, 2, available at www.jneurosci.org as supplemental material) to topographic frontal and parietal cortex (Fig. 2A). To quantify the overlap between the frontoparietal attention network and the topographically organized areas, the volume of the overlapping regions was computed. In frontal cortex, of the average 3016 mm3 within the LH and the average 4848 mm3 within the RH that responded to the spatial attention task (not including the SEF), 50 ± 7% (1513 mm3) and 46 ± 7% (2240 mm3) of the volumes were located in topographically organized cortex, respectively (Table 2). In PPC, of the average 7,011 mm3 within the LH and the average 7028 mm3 within the RH that responded to the spatial attention task, 57 ± 5% (4005 mm3) and 58 ± 7% (4049 mm3) of the volumes were located in topographically organized cortex, respectively (Table 2). Activated volumes evoked by the spatial attention task did not differ between hemispheres (p > 0.30), but were significantly larger in parietal than in frontal topographic cortex (F(1,7) = 9.65, p < 0.05).
We considered the possibility that the extent to which the frontoparietal attention network overlapped with topographic frontal and parietal cortex was an artifact of the particular significance criterion applied to the statistical maps of the spatial attention task. A control analysis was conducted using two additional statistical thresholds, one more liberal (p < 0.01) and one more conservative (p < 0.0001; for details, see Materials and Methods). We found that, regardless of the threshold value used for the data obtained in the spatial attention task, the proportion of voxels located in topographically organized areas to those located in non-topographic cortex was similar in frontal (p > 0.40) and parietal cortex (p > 0.90) (see Table 2 for percentage of overlap for each statistical threshold). Therefore, it appears that thresholding the statistical maps with different significance criteria had a similar effect on all of the regions activated by spatial attention, regardless of their association with topographic or non-topographic cortex, suggesting that the activations in non-topographic areas of the spatial attention network were not artifacts of the analysis.
Spatial specificity of attention-related activations within topographic areas
To further characterize the relationship between attention-related activations and topographically organized areas, we investigated the spatial specificity of voxels activated in the spatial attention task relative to their location in the topographic maps. If attention-related activations are represented in a spatially specific manner in topographic cortex, one would expect that the voxels maximally responsive to attention directed to a particular location in the visual field would align with parts of the topographic map representing saccade directions to the same portion of visual space, and less so with regions representing other saccade directions. To test this prediction, voxels within frontal cortex and PPC that responded to both tasks were separated into four ROIs based upon saccade phase (that is, whether they most strongly responded to memory-guided saccades made into the upper right, lower right, upper left, or lower left visual quadrants). Using Pearson's linear correlation, the time series of fMRI signals of each voxel obtained in the spatial attention task was then correlated with the time series of every other voxel within the same ROI and between different ROIs. This analysis yielded a 4 × 4 correlation matrix, which contained the average pairwise correlation between spatial attention signal time series of voxels within the same ROI, as compared to the average pairwise correlation between voxel time series within each of the different ROIs in each lobe (frontal and parietal) and for each subject. Subjects' correlation matrices were then averaged to obtain a group correlation matrix for voxels in frontal cortex (Fig. 3A) and PPC (Fig. 3B).
Figure 3.

Spatial specificity of attention-related activations. A, B, Voxels within frontal cortex (A) and parietal cortex (B) were separated according to memory-guided saccade phase, to the upper left (UL), lower left (LL), upper right (UR), or lower right (LR) visual field. The average pairwise correlation was then computed between spatial attention time series of voxels within the same ROI or between time series of voxels within different ROIs. Each graph represents the correlation values averaged across subjects in a group correlation matrix.
If voxels that were responsive when subjects covertly attended to a particular location overlapped with regions that represented saccade directions to the same location, then the average pairwise correlation between attention time courses of voxels within the same ROI (defined by saccade phase) should be higher than the average pairwise correlation between voxels belonging to different ROIs. To test this hypothesis, we first calculated the difference between the average of the on-diagonal values and the average of the off-diagonal values of the 4 × 4 correlation matrix (the OnOff measure) for voxels within frontal cortex and PPC. The OnOff measure provided a single number that described how well attention time courses correlated between voxels within the same ROI versus those within different ROIs (Polyn et al., 2005).
A permutation test (see Materials and Methods) revealed that the OnOff measures calculated from the group correlation matrices were significant in both frontal cortex (p < 0.001) and PPC (p < 0.001). That is, the average pairwise correlation between attention time series of voxels within the same ROI was higher in both frontal cortex (average correlation of on-diagonal values: 0.086) and PPC (average correlation of on-diagonal values: 0.083) than the average pairwise correlation between attention time series of voxels belonging to different ROIs (average correlation of off-diagonal values: 0.034, frontal; 0.041, PPC). This analysis suggests that the direction of attention can be predicted from the saccade direction represented in the map, thereby demonstrating the spatial specificity of attention-related signals.
Spatial attention signals in topographic frontal and parietal areas
General response characteristics
To quantify the attention effects obtained in topographic regions of frontal and parietal cortex, an analysis of the fMRI time series was performed. All quantitative time series analyses were based upon voxels activated by the contrast attended versus unattended. Figure 4 depicts the fMRI time series collapsed across all voxels assigned to topographically organized areas in frontal (A) and parietal cortex (B) that were activated when subjects attended to the peripheral stimuli (solid lines), presented to the right visual field (RVF, blue lines) or left visual field (LVF, red lines), and when they ignored the same stimuli (broken lines).
Figure 4.
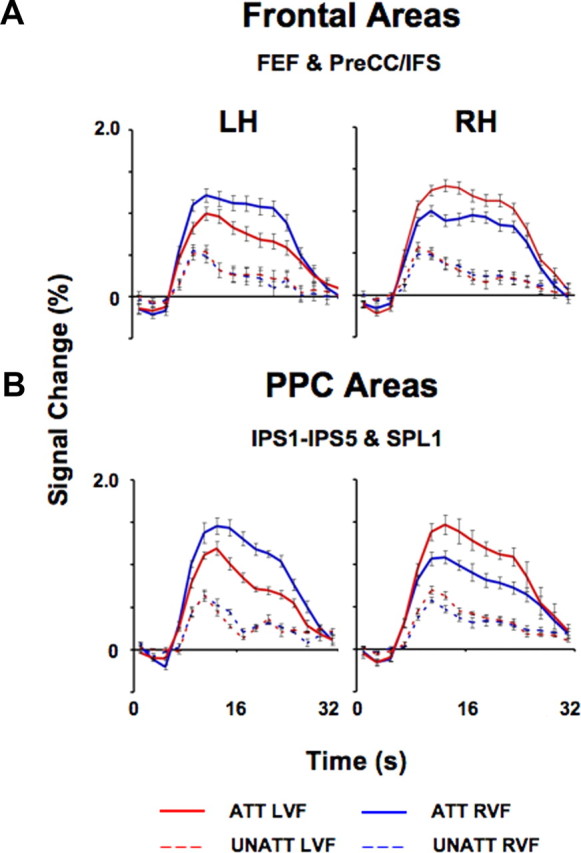
Time series of fMRI attention signals in topographic regions of frontal and parietal cortex. A, B, Spatial attention signals averaged across subjects in topographic regions of frontal (A; n = 9) and parietal cortex (B; n = 8) are shown separately for each hemisphere. Data were averaged across all topographic frontal (FEF, PreCC/IFS; A) and parietal voxels (IPS1–IPS5, SPL1; B) that were activated by a spatial attention task (attended vs unattended contrast). Solid curves indicate activity evoked by the attended conditions (ATT) and dashed curves indicate activity evoked by the unattended (UNATT) conditions. Red curves correspond to directed attention to the LVF, while blue curves correspond to directed attention to the RVF. Error bars indicate SEM across subjects.
Mean signal changes evoked during directed attention to the RVF and LVF and during the unattended conditions were examined in each of the topographically organized areas in frontal (FEF and PreCC/IFS) (Fig. 5A) and parietal cortex (IPS1–IPS5, SPL1) (Fig. 5B) in the LH and RH. When collapsed across hemispheres and all topographic areas in frontal and parietal cortex, mean signal changes predicted the direction of attention to the LVF or RVF with stronger responses when attention was directed to the contralateral (1.13 ± 0.04, mean signal change, SEM) relative to the ipsilateral (0.82 ± 0.03, mean signal change, SEM) visual field (F(1,7) = 25.97, p < 0.001). More specifically, topographically organized regions within frontal cortex produced significantly greater responses when subjects attended to the contralateral versus the ipsilateral visual field in both right and left FEF (LH: t(8) = 6.86, p < 0.001; RH: t(8) = 5.62, p < 0.001) and PreCC/IFS (LH: t(7) = 5.20, p < 0.001; RH: t(7) = 3.45, p < 0.05) (Fig. 5A). Similarly, mean signal changes were significantly greater when subjects attended to the contralateral versus ipsilateral visual field in IPS1 (LH: t(4) = 8.27, p < 0.001; RH: t(4) = 5.12, p < 0.01), IPS2 (LH: t(7) = 6.06, p < 0.001; RH: t(7) = 3.11, p < 0.05), IPS3 (LH: t(7) = 2.86, p < 0.05; RH: t(7) = 4.00, p < 0.01), IPS4 (LH: t(7) = 5.27, p < 0.001; RH: t(7) = 3.68, p < 0.01), IPS5 (LH: t(7) = 4.73, p < 0.01; RH: t(7) = 4.72, p < 0.01) and SPL1 (RH: t(7) = 5.29, p < 0.001) (Fig. 5B). Thus, analyses of the mean signal changes revealed a contralateral bias of attention-related signals in all topographic frontal and parietal areas, with the exception of left SPL1, and a double dissociation of visual field between the RH and LH. Responses evoked by attention to ipsilateral visual stimuli were also significantly enhanced compared to the corresponding unattended condition when collapsed across all topographic areas (t(7) = 6.56, p < 0.001). Notably, no bias was found in the unattended condition, in which stimuli evoked a similarly small response regardless of where they were presented in the visual field (all p values >0.10). Thus, the spatial bias toward the contralateral side occurred as a result of the spatial allocation of attention.
Figure 5.
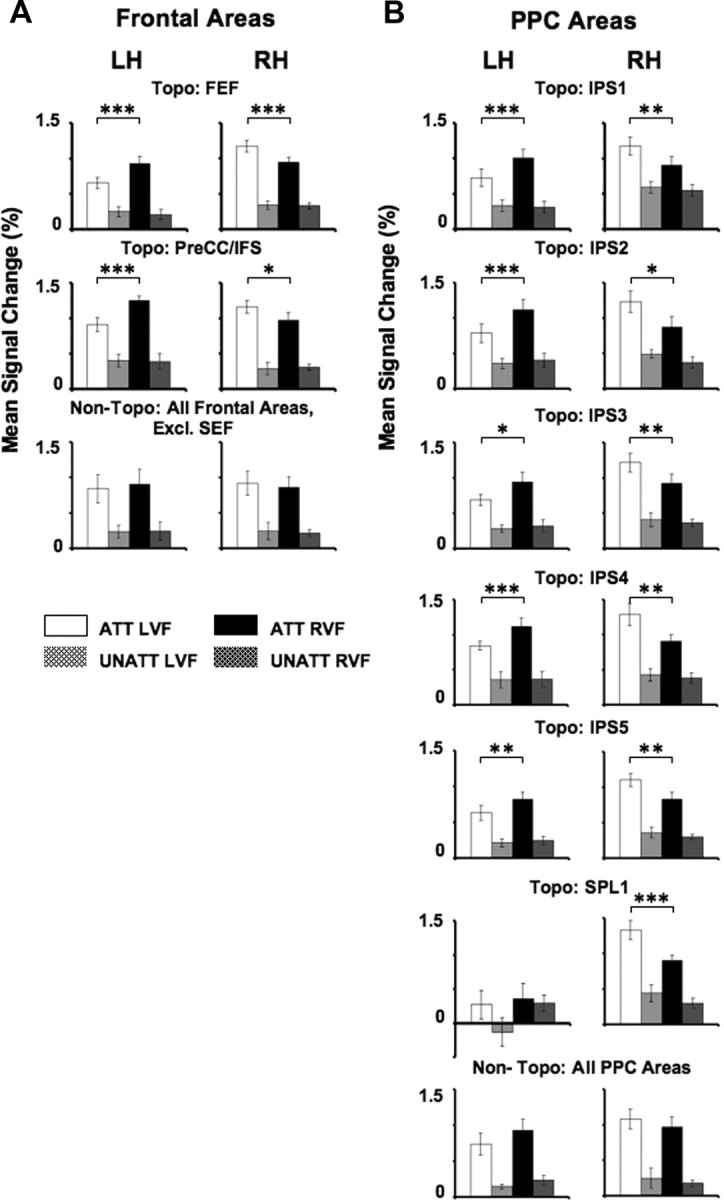
Mean signal changes in frontal and parietal areas. A, B, Mean signal changes obtained during the spatial attention task averaged across subjects are shown for areas within frontal (A) and parietal cortex (B). For each subject, mean signal change was defined as the average of the eight peak intensities of the fMRI signal obtained during each condition. Mean signals are shown separately for each hemisphere and for different ROIs: voxels activated by the spatial attention task (attended vs unattended contrast) that were assigned to topographic areas (Topo) and those that did not overlap with topographic areas (Non-Topo). Mean responses of activations assigned to topographic areas in frontal (FEF and PreCC/IFS) and parietal cortex (IPS1–IPS5, SPL1) are shown separately for each area. Responses were averaged across all frontal and parietal voxels that responded to the spatial attention task but were not topographically organized, with the exception of the SEF. Solid bars indicate activity evoked by the attended conditions (ATT) and hatched bars indicate activity evoked by the unattended (UNATT) conditions. White bars correspond to directed attention to the LVF, while black bars correspond to directed attention to the RVF. Error bars indicate SEM across subjects. *p < 0.05; **p < 0.01; ***p < 0.001.
Interestingly, only a small volume, an average of 158.4 ± 39.0 mm3 (SEM), in fewer subjects (n = 5) was activated during the spatial attention task within left SPL1. There were no differences between attended and unattended conditions in left SPL1 (p > 0.10) and no differences when subjects attended to the RVF or the LVF (p > 0.10) (Fig. 5B). This was reflected in the significant visual field × hemisphere interaction in SPL1 (F(1,4) = 8.88, p < 0.05) as well as the significant area × hemisphere × visual field interaction across PPC areas (IPS1–IPS5, SPL1) (F(5,20) = 2.82, p < 0.05). This finding suggests the existence of a hemispheric asymmetry in PPC regarding the areas that carry spatially specific attention signals. All areas along the IPS showed attentional modulation with a contralateral bias, whereas only right, but not left, SPL1 exhibited such response characteristics.
Magnitude of spatial attention effects
An AMI (see Materials and Methods) was calculated to estimate the magnitude of attention effects on visually evoked activity. The AMI is a quantitative measure that allows a direct comparison of the degree to which each ROI was modulated by attention. The index was calculated separately for attention directed to the RVF (AMIRVF) or LVF (AMILVF). The AMI ranges from +1 to −1, with positive values indicating response enhancement and negative values indicating response suppression. The AMIRVF and AMILVF values were plotted against one another for each frontal (Fig. 6, squares) and parietal (Fig. 6, circles) ROI and for each subject. Open symbols in Figure 6 denote topographic areas, and closed symbols denote non-topographic areas. In the majority of cases, ROIs in the RH (red symbols) had greater AMILVF than AMIRVF values. This places them below the equality line and indicates greater increases in activity when attending to the LVF (contralateral) than when attending to the RVF (ipsilateral). In contrast, most ROIs in the LH (blue symbols) had greater AMIRVF than AMILVF values, and were located above the equality line. Topographic ROIs within the RH of frontal cortex (red, open, square symbols) had mean AMILVF values (0.58 ± 0.06) that were significantly larger than their respective mean AMIRVF values (0.44 ± 0.05; t(7) = 3.20, p < 0.05). Topographic ROIs within the RH of PPC (red open, circle symbols) also had significantly larger AMILVF (0.55 ± 0.06) than AMIRVF values (0.39 ± 0.04; t(7) = 2.95, p < 0.05). The opposite pattern was found for topographic ROIs within the LH of frontal cortex (blue, open, square symbols; AMIRVF: 0.65 ± 0.06; AMILVF: 0.43 ± 0.05; t(7) = 2.52, p < 0.05) and PPC (blue, open, circle symbols; AMIRVF: 0.66 ± 0.08; AMILVF: 0.36 ± 0.05; t(7) = 3.90, p < 0.01). There were no differences in AMI values between frontal and parietal ROIs or between hemispheres (all p values >0.10).
Figure 6.

Attention Modulation Index. Each point of the graph represents a single subject's AMI value for a given ROI that was calculated based on mean signal changes obtained from voxels activated during the spatial attention task (attended vs unattended contrast). Data are shown separately for topographically organized ROIs (open symbols) within frontal (FEF and PreCC/IFS; squares) and parietal cortex (IPS1–IPS5, SPL1, excluding left SPL1; circles), as well as non-topographically organized ROIs (closed symbols) within frontal and parietal cortex. Two AMIs were calculated for each ROI reflecting attentional modulation when subjects attended to the RVF (AMIRVF) or to the LVF (AMILVF) and are plotted against one another. Blue symbols represent LH ROIs and red symbols represent RH ROIs. For AMI definitions, see Materials and Methods.
Hemispheric asymmetries of spatial attention signals
To quantify the strength of the attention effects to the contra- or ipsilateral visual field, a Laterality Index (LI; see Materials and Methods) was computed. The LI values were calculated separately for each of the ROIs within frontal and parietal cortex (Fig. 7), for each hemisphere and each subject and were then averaged across subjects to yield group data. Positive values indicate stronger responses to contralateral than ipsilateral presentations; negative values indicate the opposite. There were no differences in LI values between hemispheres after collapsing across all topographic areas (p > 0.30); the mean LI value across left topographic ROIs was 0.17 ± 0.02 (mean, SEM), whereas the mean LI value across right topographic ROIs was 0.15 ± 0.02 (Fig. 7), suggesting that the contralateral spatial biasing signals generated by the two hemispheres were balanced. This overall balance, however, resulted from two notable asymmetries. Within frontal cortex, attention signals showed a significantly greater contralateral bias in left than in right FEF (t(8) = 2.81, p < 0.05). Similarly, within PPC, left IPS1 and IPS2 showed a stronger contralateral bias than the corresponding right areas (IPS1, t(4) = 3.25, p < 0.05; IPS2, t(7) = 3.12, p < 0.05). No significant differences between hemispheres were found in PreCC/IFS, IPS3, IPS4, or IPS5 (all p values >0.40). SPL1 showed a pattern that was different from all of the other areas, since only right SPL1 carried attention signals that showed a strong contralateral bias (t(4) = 3.04, p < 0.05). It appears that the stronger contralateral bias generated by left FEF and IPS1/2 counterbalances the asymmetry imposed by the exclusive involvement of right SPL1 in spatial attention. Thus, the LI analysis revealed a second asymmetry in attention effects across hemispheres, such that left FEF and areas in the most posterior aspect of the left IPS (IPS1/2) showed a stronger contralateral bias than their RH counterparts.
Figure 7.

Laterality Index. LIs for each topographic ROI and hemisphere were calculated based on mean signal changes obtained from voxels activated during the spatial attention task (attended vs unattended contrast). LI values are shown separately for each hemisphere and for each topographic ROI, averaged across subjects. Black bars correspond to LH ROIs, white bars correspond to RH ROIs. Error bars indicate SEM across subjects. *p < 0.05. For LI definitions, see Materials and Methods.
Since each ROI contained a different number of voxels, we considered the possibility that the results were influenced by volume differences among ROIs. Therefore, we conducted an analysis in which a fixed number of 20 voxels were randomly chosen from each ROI. The same analyses as described above were conducted for the fixed-volume ROIs in each subject and in the group. All statistical results described above were confirmed in this analysis indicating that the results were not affected by differences in activated volumes.
Attention-related signals in non-topographic regions
All of the voxels that responded during the spatial attention task, but did not overlap with topographically organized areas of frontal and parietal cortex, were analyzed separately and assigned to non-topographic frontal and parietal ROIs. The only exception to this was the voxels within DMFC, which were analyzed independently as the putative human SEF. In contrast to the topographically organized areas of frontoparietal cortex, directing attention to the contralateral or ipsilateral visual field did not differentially modulate signals within the non-topographic regions located adjacent to the FEF or the PreCC/IFS (all p values >0.20) (Fig. 5A), nor within non-topographic regions of PPC (p > 0.05) (Fig. 5B), even though these areas showed strong attentional response enhancement effects (main effect of attention: F(1,7) = 70.56, p < 0.001). Correspondingly, the AMILVF and AMIRVF values for non-topographic ROIs within the RH (red, closed symbols) and LH (blue, closed symbols) of frontal (square symbols; RH AMILVF: 0.62 ± 0.11, AMIRVF: 0.62 ± 0.08; LH AMILVF: 0.75 ± 0.16, AMIRVF: 0.66 ± 0.13) and parietal cortex (circle symbols; RH AMILVF: 0.52 ± 0.14, AMIRVF: 0.56 ± 0.08; LH AMILVF: 0.53 ± 0.06, AMIRVF: 0.42 ± 0.09) did not differ from one another (all p values >0.10), and thus fell close to the equality line (Fig. 6). In addition, no significant differences were found between LI values within the LH and the RH of non-topographic areas of FEF, PreCC/IFS, or PPC (all p values >0.20). Thus, the functional role of regions within non-topographic higher-order cortex may be fundamentally different in the attentional selection process from that of regions within topographic cortex (see Discussion).
In addition to the frontal and parietal areas discussed thus far, the spatial attention task also activated a portion of DMFC, in the region of the putative human SEF (Fig. 8A). However, thus far, no topographic organization has been found in this region of cortex (Kastner et al., 2007). The human SEF is a midline structure that cannot be easily separated into right and left hemispheric components. Analyses therefore initially focused on regions of bilateral activations (see Table 2 for Talairach coordinates and mean activated volume). The fMRI time series within SEF were examined separately for activity evoked during the attended and unattended conditions and for attention directed to the RVF or LVF (Fig. 8B). Analyses of mean signal changes demonstrated a main effect of attention (Fig. 8C; attended versus unattended: F(1,8) = 68.43, p < 0.001), thereby confirming several previous reports (Kastner et al., 1999; Hopfinger et al., 2000). However, there were no differences in modulation when subjects attended to the RVF or LVF (F(1,8) = 0.22, p > 0.60).
SEF voxels were next examined separately by hemisphere. Only voxels that were located clearly in one hemisphere were used in this additional analysis. All voxels that were located in the midline, and could therefore not be unambiguously assigned to one or the other hemisphere, were excluded from the analysis. Mean signal changes did not differ when subjects were attending to the contralateral versus ipsilateral visual field in the voxels of left SEF (F(1,8) = 3.01, p > 0.10), nor in voxels of the right SEF (F(1,8) = 0.01, p > 0.90). In addition, there were no differences between LIs in left or right SEF (t(8) = 0.76, p > 0.50). It therefore appears that the human SEF is modulated by spatial attention, regardless of the specific direction of attention in the visual field.
Eye movement controls
Eye movement data were collected during scanning sessions for five subjects (S4–S6, S8, S9) performing the spatial attention task (see Materials and Methods for further details). Frequency histograms of the vertical and horizontal eye position data were calculated separately for each subject and for each of the experimental conditions. The maximum difference in mean horizontal and vertical eye positions among these conditions was 0.09 and 0.07 degrees, respectively. There were no systematic horizontal or vertical eye deviations between any of the different experimental conditions (all p values >0.10). Additionally, a small window of 1° × 1° in size was defined around the central fixation letter, and the number of times that the gaze left this window was calculated. Fixation was well maintained and almost never left the window surrounding the central RSVP task. Of the horizontal and vertical position samples, 99.3 ± 0.2% (mean, SEM) were within this region during a given scan session. This confirms that subjects maintained fixation throughout the spatial attention task and did not shift their gaze location along with attention.
Discussion
We characterized attention signals in topographic frontal and parietal areas using an ROI analysis in individual subjects performing a spatial attention task. Such an approach has been typically used when investigating functional response properties in retinotopic visual cortex. Here, we extended this approach to higher-order cortex to relate activations of the frontoparietal attention network to recently described frontal and parietal topographic areas for the first time and to quantitatively examine spatial attention signals in these areas. We found a stronger spatial bias toward the contralateral visual field in multiple higher-order topographic areas. Regions outside topographic higher-order cortex, including the SEF, showed a large attentional response enhancement regardless of attentional allocation across the visual field. Importantly, two hemispheric asymmetries were noted. Only right SPL1, but not left SPL1, carried attention signals, whereas left FEF and left IPS1/2 generated stronger contralateral attention signals than their RH counterparts, thereby possibly counteracting the right hemispheric asymmetry and balancing the frontoparietal system for spatial attentional control.
Our results are in agreement with a number of key findings concerning the frontoparietal attention network: our spatial attention task activated large regions of frontoparietal cortex in both hemispheres (Vandenberghe et al., 1997; Kastner et al., 1999; Hopfinger et al., 2000), the extent of activations in the RH tended to be larger than in the LH (Corbetta et al., 1993; Nobre et al., 1997; Gitelman et al., 1999), and many voxels showed a preference for contralateral visual space (Silver et al., 2005; Serences and Yantis, 2007; Egner et al., 2008; Huddleston and DeYoe, 2008). The ROI-based approach, however, extends these previous findings in several important ways. First, our study clarifies the diverse literature on the “spatial specificity” of the frontoparietal attention network. While a few studies have demonstrated contralateral preferences (Silver et al., 2005; Serences and Yantis, 2007; Egner et al., 2008; Huddleston and DeYoe, 2008; Saygin and Sereno, 2008), the majority of studies have failed to find such preferences (Fink et al., 1997; Nobre et al., 1997; Kastner et al., 1999; Corbetta et al., 2000; Vandenberghe et al., 2000, 2001; Yantis et al., 2002). We demonstrate that the frontoparietal network can be subdivided into at least 17 subunits that in previous studies have been treated as one entity, most likely leading to a mix of results. Topographic subunits showed a contralateral bias, but those located outside topographic higher-order cortex, including the SEF, did not. These different subregions within the frontoparietal attention network may play different roles in the attentional selection process. Attention signals in non-topographic areas may subserve the general maintenance of an attentional state throughout the task, thereby sustaining goal-directed behavior (Schlag and Schlag-Rey, 1987), whereas topographic areas may generate spatially specific biasing signals that are fed back to retinotopic representations of the attended location in visual cortex (Kastner et al., 1999; Moore and Armstrong, 2003). Second, our study systematically characterizes spatial attention signals in newly found higher-order topographic areas of frontal and parietal cortex. These areas have been characterized thus far with respect to motion signals (Konen and Kastner, 2008a), eye movement representations (Levy et al., 2007; Konen and Kastner, 2008a), object information (Konen and Kastner, 2008b), and reaching movements (Levy et al., 2007). Here, we add another response property by demonstrating that all topographic higher-order areas, with the exception of left SPL1, carry contralateral spatial biasing signals. Studying the response properties of topographic cortical units will ultimately lead to a better understanding of how these human areas compare to those that are well characterized in the macaque brain (for a more detailed discussion, see Konen and Kastner, 2008a; Silver and Kastner, 2009). Third, we show asymmetries in the spatial biasing signals generated by several of these topographic areas across hemispheres. And fourth, our findings inform spatial attentional control models that are largely based on behavioral studies in neglect patients, particularly interhemispheric competition accounts (Kinsbourne, 1977).
Several theories based on behavioral data from neglect patients have been proposed to explain how the intact human brain controls spatial attention. Heilman's hemispatial theory (Heilman and Van Den Abell, 1980) has proposed that the RH directs attention to both visual hemifields, whereas the LH directs attention to the RVF only (see also Mesulam, 1981). This account is supported by the far greater prevalence of neglect following RH damage than LH damage as well as fMRI studies demonstrating a greater extent of activations in the RH than in the LH (Corbetta et al., 1993; Nobre et al., 1997; Gitelman et al., 1999). Alternatively, Kinsbourne's interhemispheric competition theory has proposed an opponent processor control system, in which the two hemispheres each direct attention toward the contralateral visual field (or via a cortico-subcortical loop involving the SC) and balance one another through reciprocal inhibition (Kinsbourne, 1977). This theory is supported by evidence that patients with extinction will often manifest directional biases, favoring stimuli that are relatively ipsilesional over those that are relatively contralesional within and between visual fields. It therefore appears that with damage to frontal and parietal cortex, there is a gradient of attention loss across the visual field, rather than a complete loss of attention to one hemifield. The Kinsbourne model is further supported by evidence that neglect patients show improvement when TMS is used to interfere with the control system of their intact hemisphere (Oliveri et al., 1999), presumably by rebalancing the reciprocal inhibition between the two hemispheres.
The current study, based on data from the normal adult brain, potentially provides a neural basis for interhemispheric competition accounts of spatial attentional control (Kinsbourne, 1977; Smania et al., 1998). Specifically, we propose an account (Fig. 9) in which each of the LH and RH areas contributes to the control of spatial attention across the visual field by generating a spatial bias, or “attentional weight” (Duncan et al., 1999), as indexed by the LI, toward the contralateral hemifield. The sum of the weights contributed by each area within a hemisphere constitutes the overall spatial bias that can be exerted over contralateral space. As shown by our LI analysis, the net output of attentional weights generated by the two hemispheres is similar, indicating that the control system is normally balanced. This balance across the hemispheres may be achieved through reciprocal interhemispheric inhibition of corresponding areas. However, the higher-order control system appears to be complicated by the unique role of right SPL1 (Fig. 9). The attentional weight generated by this area was not counteracted by left SPL1. Instead, left FEF and left IPS1/2 generated stronger weights than their right-hemispheric counterparts, possibly to maintain a balanced distribution of attentional resources across the visual field. Thus, the LH control system requires the cooperation of several distributed subcomponents to balance the spatial biasing signals generated by the two hemispheres.
Figure 9.

Model of visuospatial attention. A new model of visuospatial attention control is proposed, in which a number of topographically organized areas in frontoparietal cortex bias attention to the contralateral visual field. Arrows toward the RVF or LVF denote the direction of attentional bias for each lobe (frontal cortex or PPC), while the thickness of each arrow refers to the strength of the attentional bias, or attentional weight. For example, left FEF and PreCC/IFS together exert a stronger contralateral bias toward the RVF than their RH counterparts exert toward the LVF. Gray nodes correspond to topographically organized areas within the RH, while black nodes correspond to those in the LH. Shaded nodes are located in frontal cortex, while nonshaded nodes are located in PPC.
Our spatial attentional control model makes a number of predictions that can account for key findings from behavioral studies in neglect patients. First, our model predicts that dysfunction of right PPC (including right SPL1) will result in a spatial bias toward the RVF and a neglect of the LVF due to the shift of the residual attentional weights toward contralateral space. This is in agreement with data from visuospatial neglect patients with damage to right parietal cortex (Mesulam, 1981). Second, our model predicts that if either the left PPC alone or the left FEF and surrounding regions alone were dysfunctional, a strong neglect of the RVF would be less likely to result, since the intact area (e.g., the FEF if PPC were damaged) could compensate for the other. Therefore, isolated dysfunction of either left PPC or left FEF is less likely to cause a strong shift in the weights toward the LVF. This is in agreement with observations that right neglect occurs much less frequently with isolated frontal or parietal lesions. Therefore, together, the first two predictions are consistent with the notion of right hemispheric dominance of attentional function (Heilman and Van Den Abell, 1980; Mesulam, 1981). Third, our model predicts that both left frontal cortex and left PPC need to be dysfunctional before right neglect is strongly manifested. In general, too few studies have examined patients in great enough detail to determine the exact neural correlates of right neglect. However, interestingly, right neglect has been reported to occur more frequently in patients with extensive LH damage covering frontal, parietal, and temporal cortex (Bartolomeo et al., 2001; Beis et al., 2004; Kleinman et al., 2007), thereby providing some preliminary evidence to support our model predictions regarding the incidence of right neglect.
Severe and protracted visuospatial neglect most often results from either right IPL (Mort et al., 2003) or right superior temporal gyrus (STG) (Karnath et al., 2001) damage, both of which are quite different from regions typically identified by functional brain imaging studies of spatial attention in healthy subjects. One possible explanation is that the spatial attention deficits observed in neglect after damage to the IPL/STG result from cortical dysfunction downstream from the structural lesion, perhaps due to an interruption of connections between IPL/STG and the IPS or SPL, or due to hypoperfused tissue in IPS/SPL (Hillis et al., 2005). Future studies using paradigms similar to the one in the present study in both healthy subjects and patients with brain lesions are necessary to better understand and possibly resolve this long-standing discrepancy between the patient and neuroimaging literature.
Footnotes
This study was supported by grants from National Institutes of Health (2RO1 MH64043, 1RO1 EY017699, 2P50 MH-62196) to S.K. and a grant from the German Academic Exchange Service to C.K. We thank Mark Pinsk for help with the eye movement control studies, Greg Detre for help with data analyses, and Stephanie McMains, Ryan Mruczek, and Marius Peelen for valuable suggestions on earlier drafts of the manuscript.
References
- Bandettini PA, Jesmanowicz A, Wong EC, Hyde JS. Processing strategies for time-course data sets in functional MRI of the human brain. Magn Reson Med. 1993;30:161–173. doi: 10.1002/mrm.1910300204. [DOI] [PubMed] [Google Scholar]
- Bartolomeo P, Chokron S, Gainotti G. Laterally directed arm movements and right unilateral neglect after left hemisphere damage. Neuropsychologia. 2001;39:1013–1021. doi: 10.1016/s0028-3932(01)00042-2. [DOI] [PubMed] [Google Scholar]
- Beis JM, Keller C, Morin N, Bartolomeo P, Bernati T, Chokron S, Leclercq M, Louis-Dreyfus A, Marchal F, Martin Y, Perennou D, Pradat-Diehl P, Prairial C, Rode G, Rousseaux M, Samuel C, Sieroff E, Wiart L, Azouvi P. Right spatial neglect after left hemisphere stroke: qualitative and quantitative study. Neurology. 2004;63:1600–1605. doi: 10.1212/01.wnl.0000142967.60579.32. [DOI] [PubMed] [Google Scholar]
- Bon L, Lucchetti C. Attention-related neurons in the supplementary eye field of the macaque monkey. Exp Brain Res. 1997;113:180–185. doi: 10.1007/BF02454156. [DOI] [PubMed] [Google Scholar]
- Brainard DH. The Psychophysics Toolbox. Spat Vis. 1997;10:433–436. [PubMed] [Google Scholar]
- Corbetta M, Shulman GL. Control of goal-directed and stimulus-driven attention in the brain. Nat Rev Neurosci. 2002;3:201–215. doi: 10.1038/nrn755. [DOI] [PubMed] [Google Scholar]
- Corbetta M, Miezin FM, Shulman GL, Petersen SE. A PET study of visuospatial attention. J Neurosci. 1993;13:1202–1226. doi: 10.1523/JNEUROSCI.13-03-01202.1993. [DOI] [PMC free article] [PubMed] [Google Scholar]
- Corbetta M, Akbudak E, Conturo TE, Snyder AZ, Ollinger JM, Drury HA, Linenweber MR, Petersen SE, Raichle ME, Van Essen DC, Shulman GL. A common network of functional areas for attention and eye movements. Neuron. 1998;21:761–773. doi: 10.1016/s0896-6273(00)80593-0. [DOI] [PubMed] [Google Scholar]
- Corbetta M, Kincade JM, Ollinger JM, McAvoy MP, Shulman GL. Voluntary orienting is dissociated from target detection in human posterior parietal cortex. Nat Neurosci. 2000;3:292–297. doi: 10.1038/73009. [DOI] [PubMed] [Google Scholar]
- Cox RW. AFNI: software for analysis and visualization of functional magnetic resonance neuroimages. Comput Biomed Res. 1996;29:162–173. doi: 10.1006/cbmr.1996.0014. [DOI] [PubMed] [Google Scholar]
- Culham JC, Brandt SA, Cavanagh P, Kanwisher NG, Dale AM, Tootell RB. Cortical fMRI activation produced by attentive tracking of moving targets. J Neurophysiol. 1998;80:2657–2670. doi: 10.1152/jn.1998.80.5.2657. [DOI] [PubMed] [Google Scholar]
- Dale AM, Fischl B, Sereno MI. Cortical surface-based analysis. I. Segmentation and surface reconstruction. Neuroimage. 1999;9:179–194. doi: 10.1006/nimg.1998.0395. [DOI] [PubMed] [Google Scholar]
- Duncan J, Bundesen C, Olson A, Humphreys G, Chavda S, Shibuya H. Systematic analysis of deficits in visual attention. J Exp Psychol Gen. 1999;128:450–478. doi: 10.1037//0096-3445.128.4.450. [DOI] [PubMed] [Google Scholar]
- Egner T, Monti JM, Trittschuh EH, Wieneke CA, Hirsch J, Mesulam MM. Neural integration of top-down spatial and feature-based information in visual search. J Neurosci. 2008;28:6141–6151. doi: 10.1523/JNEUROSCI.1262-08.2008. [DOI] [PMC free article] [PubMed] [Google Scholar]
- Engel SA, Glover GH, Wandell BA. Retinotopic organization in human visual cortex and the spatial precision of functional MRI. Cereb Cortex. 1997;7:181–192. doi: 10.1093/cercor/7.2.181. [DOI] [PubMed] [Google Scholar]
- Fink GR, Dolan RJ, Halligan PW, Marshall JC, Frith CD. Space-based and object-based visual attention: shared and specific neural domains. Brain. 1997;120:2013–2028. doi: 10.1093/brain/120.11.2013. [DOI] [PubMed] [Google Scholar]
- Fischl B, Sereno MI, Dale AM. Cortical surface-based analysis. II: Inflation, flattening, and a surface-based coordinate system. Neuroimage. 1999;9:195–207. doi: 10.1006/nimg.1998.0396. [DOI] [PubMed] [Google Scholar]
- Gitelman DR. ILAB: a program for postexperimental eye movement analysis. Behav Res Methods Instrum Comput. 2002;34:605–612. doi: 10.3758/bf03195488. [DOI] [PubMed] [Google Scholar]
- Gitelman DR, Nobre AC, Parrish TB, LaBar KS, Kim YH, Meyer JR, Mesulam M. A large-scale distributed network for covert spatial attention: further anatomical delineation based on stringent behavioural and cognitive controls. Brain. 1999;122:1093–1106. doi: 10.1093/brain/122.6.1093. [DOI] [PubMed] [Google Scholar]
- Heilman KM, Van Den Abell T. Right hemisphere dominance for attention: the mechanism underlying hemispheric asymmetries of inattention (neglect) Neurology. 1980;30:327–330. doi: 10.1212/wnl.30.3.327. [DOI] [PubMed] [Google Scholar]
- Hillis AE, Newhart M, Heidler J, Barker PB, Herskovits EH, Degaonkar M. Anatomy of spatial attention: insights from perfusion imaging and hemispatial neglect in acute stroke. J Neurosci. 2005;25:3161–3167. doi: 10.1523/JNEUROSCI.4468-04.2005. [DOI] [PMC free article] [PubMed] [Google Scholar]
- Hopfinger JB, Buonocore MH, Mangun GR. The neural mechanisms of top-down attentional control. Nat Neurosci. 2000;3:284–291. doi: 10.1038/72999. [DOI] [PubMed] [Google Scholar]
- Huddleston WE, DeYoe EA. The representation of spatial attention in human parietal cortex dynamically modulates with performance. Cereb Cortex. 2008;18:1272–1280. doi: 10.1093/cercor/bhm158. [DOI] [PubMed] [Google Scholar]
- Karnath HO, Ferber S, Himmelbach M. Spatial awareness is a function of the temporal not the posterior parietal lobe. Nature. 2001;411:950–953. doi: 10.1038/35082075. [DOI] [PubMed] [Google Scholar]
- Kastner S, Ungerleider LG. Mechanisms of visual attention in the human cortex. Annu Rev Neurosci. 2000;23:315–341. doi: 10.1146/annurev.neuro.23.1.315. [DOI] [PubMed] [Google Scholar]
- Kastner S, De Weerd P, Desimone R, Ungerleider LG. Mechanisms of directed attention in the human extrastriate cortex as revealed by functional MRI. Science. 1998;282:108–111. doi: 10.1126/science.282.5386.108. [DOI] [PubMed] [Google Scholar]
- Kastner S, Pinsk MA, De Weerd P, Desimone R, Ungerleider LG. Increased activity in human visual cortex during directed attention in the absence of visual stimulation. Neuron. 1999;22:751–761. doi: 10.1016/s0896-6273(00)80734-5. [DOI] [PubMed] [Google Scholar]
- Kastner S, DeSimone K, Konen CS, Szczepanski SM, Weiner KS, Schneider KA. Topographic maps in human frontal cortex revealed in memory-guided saccade and spatial working-memory tasks. J Neurophysiol. 2007;97:3494–3507. doi: 10.1152/jn.00010.2007. [DOI] [PubMed] [Google Scholar]
- Kinsbourne M. Hemi-neglect and hemisphere rivalry. Adv Neurol. 1977;18:41–49. [PubMed] [Google Scholar]
- Kleinman JT, Newhart M, Davis C, Heidler-Gary J, Gottesman RF, Hillis AE. Right hemispatial neglect: frequency and characterization following acute left hemisphere stroke. Brain Cogn. 2007;64:50–59. doi: 10.1016/j.bandc.2006.10.005. [DOI] [PMC free article] [PubMed] [Google Scholar]
- Konen CS, Kastner S. Representation of eye movements and stimulus motion in topographically organized areas of human posterior parietal cortex. J Neurosci. 2008a;28:8361–8375. doi: 10.1523/JNEUROSCI.1930-08.2008. [DOI] [PMC free article] [PubMed] [Google Scholar]
- Konen CS, Kastner S. Two hierarchically organized neural systems for object information in human visual cortex. Nat Neurosci. 2008b;11:224–231. doi: 10.1038/nn2036. [DOI] [PubMed] [Google Scholar]
- Levy I, Schluppeck D, Heeger DJ, Glimcher PW. Specificity of human cortical areas for reaches and saccades. J Neurosci. 2007;27:4687–4696. doi: 10.1523/JNEUROSCI.0459-07.2007. [DOI] [PMC free article] [PubMed] [Google Scholar]
- Mesulam MM. A cortical network for directed attention and unilateral neglect. Ann Neurol. 1981;10:309–325. doi: 10.1002/ana.410100402. [DOI] [PubMed] [Google Scholar]
- Moore T, Armstrong KM. Selective gating of visual signals by microstimulation of frontal cortex. Nature. 2003;421:370–373. doi: 10.1038/nature01341. [DOI] [PubMed] [Google Scholar]
- Mort DJ, Malhotra P, Mannan SK, Rorden C, Pambakian A, Kennard C, Husain M. The anatomy of visual neglect. Brain. 2003;126:1986–1997. doi: 10.1093/brain/awg200. [DOI] [PubMed] [Google Scholar]
- Nobre AC, Sebestyen GN, Gitelman DR, Mesulam MM, Frackowiak RS, Frith CD. Functional localization of the system for visuospatial attention using positron emission tomography. Brain. 1997;120:515–533. doi: 10.1093/brain/120.3.515. [DOI] [PubMed] [Google Scholar]
- Oliveri M, Rossini PM, Traversa R, Cicinelli P, Filippi MM, Pasqualetti P, Tomaiuolo F, Caltagirone C. Left frontal transcranial magnetic stimulation reduces contralesional extinction in patients with unilateral right brain damage. Brain. 1999;122:1731–1739. doi: 10.1093/brain/122.9.1731. [DOI] [PubMed] [Google Scholar]
- Polyn SM, Natu VS, Cohen JD, Norman KA. Category-specific cortical activity precedes retrieval during memory search. Science. 2005;310:1963–1966. doi: 10.1126/science.1117645. [DOI] [PubMed] [Google Scholar]
- Rafal RD. Hemispatial neglect: cognitive neuropsychological aspects. In: Feinberg TE, Farah MJ, editors. Behavioral neurology and neuropsychology. New York: McGraw-Hill; 1997. pp. 319–335. [Google Scholar]
- Reynolds JH, Chelazzi L. Attentional modulation of visual processing. Annu Rev Neurosci. 2004;27:611–647. doi: 10.1146/annurev.neuro.26.041002.131039. [DOI] [PubMed] [Google Scholar]
- Saygin AP, Sereno MI. Retinotopy and attention in human occipital, temporal, parietal, and frontal cortex. Cereb Cortex. 2008;18:2158–2168. doi: 10.1093/cercor/bhm242. [DOI] [PubMed] [Google Scholar]
- Schlag J, Schlag-Rey M. Evidence for a supplementary eye field. J Neurophysiol. 1987;57:179–200. doi: 10.1152/jn.1987.57.1.179. [DOI] [PubMed] [Google Scholar]
- Schluppeck D, Glimcher PW, Heeger DJ. Topographic organization for delayed saccades in human posterior parietal cortex. J Neurophysiol. 2005;94:1372–1384. doi: 10.1152/jn.01290.2004. [DOI] [PMC free article] [PubMed] [Google Scholar]
- Serences JT, Yantis S. Selective visual attention and perceptual coherence. Trends Cogn Sci. 2006;10:38–45. doi: 10.1016/j.tics.2005.11.008. [DOI] [PubMed] [Google Scholar]
- Serences JT, Yantis S. Spatially selective representations of voluntary and stimulus-driven attentional priority in human occipital, parietal, and frontal cortex. Cereb Cortex. 2007;17:284–293. doi: 10.1093/cercor/bhj146. [DOI] [PubMed] [Google Scholar]
- Sereno MI, Pitzalis S, Martinez A. Mapping of contralateral space in retinotopic coordinates by a parietal cortical area in humans. Science. 2001;294:1350–1354. doi: 10.1126/science.1063695. [DOI] [PubMed] [Google Scholar]
- Silver MA, Kastner S. Topographic maps in human frontal and parietal cortex. Trends Cogn Sci. 2009;13:488–495. doi: 10.1016/j.tics.2009.08.005. [DOI] [PMC free article] [PubMed] [Google Scholar]
- Silver MA, Ress D, Heeger DJ. Topographic maps of visual spatial attention in human parietal cortex. J Neurophysiol. 2005;94:1358–1371. doi: 10.1152/jn.01316.2004. [DOI] [PMC free article] [PubMed] [Google Scholar]
- Smania N, Martini MC, Gambina G, Tomelleri G, Palamara A, Natale E, Marzi CA. The spatial distribution of visual attention in hemineglect and extinction patients. Brain. 1998;121:1759–1770. doi: 10.1093/brain/121.9.1759. [DOI] [PubMed] [Google Scholar]
- Sprague JM. Interaction of cortex and superior colliculus in mediation of visually guided behavior in the cat. Science. 1966;153:1544–1547. doi: 10.1126/science.153.3743.1544. [DOI] [PubMed] [Google Scholar]
- Swisher JD, Halko MA, Merabet LB, McMains SA, Somers DC. Visual topography of human intraparietal sulcus. J Neurosci. 2007;27:5326–5337. doi: 10.1523/JNEUROSCI.0991-07.2007. [DOI] [PMC free article] [PubMed] [Google Scholar]
- Talairach J, Tournoux P. Co-planar stereotaxic atlas of the human brain. Stuttgart, Germany: Thieme; 1988. [Google Scholar]
- Tootell RB, Mendola JD, Hadjikhani NK, Ledden PJ, Liu AK, Reppas JB, Sereno MI, Dale AM. Functional analysis of V3A and related areas in human visual cortex. J Neurosci. 1997;17:7060–7078. doi: 10.1523/JNEUROSCI.17-18-07060.1997. [DOI] [PMC free article] [PubMed] [Google Scholar]
- Tootell RB, Hadjikhani NK, Vanduffel W, Liu AK, Mendola JD, Sereno MI, Dale AM. Functional analysis of primary visual cortex (V1) in humans. Proc Natl Acad Sci U S A. 1998;95:811–817. doi: 10.1073/pnas.95.3.811. [DOI] [PMC free article] [PubMed] [Google Scholar]
- Vandenberghe R, Duncan J, Dupont P, Ward R, Poline JB, Bormans G, Michiels J, Mortelmans L, Orban GA. Attention to one or two features in left or right visual field: a positron emission tomography study. J Neurosci. 1997;17:3739–3750. doi: 10.1523/JNEUROSCI.17-10-03739.1997. [DOI] [PMC free article] [PubMed] [Google Scholar]
- Vandenberghe R, Duncan J, Arnell KM, Bishop SJ, Herrod NJ, Owen AM, Minhas PS, Dupont P, Pickard JD, Orban GA. Maintaining and shifting attention within left or right hemifield. Cereb Cortex. 2000;10:706–713. doi: 10.1093/cercor/10.7.706. [DOI] [PubMed] [Google Scholar]
- Vandenberghe R, Gitelman DR, Parrish TB, Mesulam MM. Location- or feature-based targeting of peripheral attention. Neuroimage. 2001;14:37–47. doi: 10.1006/nimg.2001.0790. [DOI] [PubMed] [Google Scholar]
- Wojciulik E, Kanwisher N. The generality of parietal involvement in visual attention. Neuron. 1999;23:747–764. doi: 10.1016/s0896-6273(01)80033-7. [DOI] [PubMed] [Google Scholar]
- Yantis S, Schwarzbach J, Serences JT, Carlson RL, Steinmetz MA, Pekar JJ, Courtney SM. Transient neural activity in human parietal cortex during spatial attention shifts. Nat Neurosci. 2002;5:995–1002. doi: 10.1038/nn921. [DOI] [PubMed] [Google Scholar]