

Abstract
MicroRNAs (miRNAs) are short (20–23 nt) RNAs that are sequence-specific mediators of transcriptional and post-transcriptional regulation of gene expression. Modern high-throughput technologies enable deep sequencing of such RNA species on an unprecedented scale. We find that the analysis of small RNA deep-sequencing libraries can be affected by cross-mapping, in which RNA sequences originating from one locus are inadvertently mapped to another. Similar to cross-hybridization on microarrays, cross-mapping is prevalent among miRNAs, as they tend to occur in families, are similar or derived from repeat or structural RNAs, or are post-transcriptionally modified. Here, we develop a strategy to correct for cross-mapping, and apply it to the analysis of RNA editing in mature miRNAs. In contrast to previous reports, our analysis suggests that RNA editing in mature miRNAs is rare in animals.
In recent years, the use of high-throughput deep-sequencing technologies has revolutionized transcriptomics research (Kahvejian et al. 2008; Morozova and Marra 2008; Schuster 2008) and facilitated the evolutionary and genome-wide assessment of microRNA (miRNA) expression (Ruby et al. 2006; Landgraf et al. 2007; Babiarz et al. 2008; Kuchenbauer et al. 2008; Morin et al. 2008), These short (20–23 nt) RNA species, which play important roles in transcriptional and post-transcriptional gene regulation, are generally processed from long primary transcripts in two steps. First, short hairpin structures are excised from long primary miRNA (pri-miRNA) transcripts in the nucleus by the microprocessor complex, which is composed of the ribonuclease RNASEN (DROSHA) and the RNA-binding protein DGCR8 (Winter et al. 2009). After export to the cytoplasm by XPO5 (Exportin 5), DICER1 cleaves the hairpin to yield an RNA duplex with a characteristic two-base 3′ overhang (Winter et al. 2009). One strand of this duplex, the mature miRNA, is loaded into a regulatory protein complex, RISC (the RNA-induced silencing complex), while the other strand is usually, although not exclusively, degraded (Winter et al. 2009). Mature miRNAs typically regulate gene expression by binding to messenger RNA 3′ untranslated regions (UTRs) via the “seed sequence” (nucleotides 2–8) and inducing either transcript degradation or translation inhibition, although there are also examples of miRNAs interacting with 5′ UTRs and promoter regions (Lee et al. 2009).
Several recent studies have reported evidence of adenosine to inosine (A-to-I) editing in pri-miRNAs (Luciano et al. 2004; Blow et al. 2006; Kawahara et al. 2008). Such editing can affect the efficacy of DICER1 and RNASEN processing or lead to transcript degredation (Gottwein et al. 2006; Obernosterer et al. 2006; Thomson et al. 2006; Yang et al. 2006; Kawahara et al. 2007b; Viswanathan et al. 2008). The discovery of A-to-I editing sites within the region of the pri-miRNA comprising the mature miRNA led to the enticing hypothesis that A-to-I editing may generally affect miRNA target selection and stability (Luciano et al. 2004; Blow et al. 2006). Indeed, tissue-specific editing of bases in the seed region of the miRNA miR-376a alters the set of genes it silences (Kawahara et al. 2007a). Similarly, deep sequencing of small RNAs from three mouse tissues showed extensive nucleotide heterogeneity and modifications in mature miRNAs of the let-7 family (Reid et al. 2008), including internal insertions, deletions, and nucleotide substitutions. However, most of these sequence variations are distinct from the A-to-I editing events, suggesting widespread editing of mature miRNAs by currently unknown RNA processing enzymes.
In this study, we analyze short RNA libraries produced during a time course of differentiation of THP-1 cells in response to phorbol-mysterate-acetate (PMA), which mimics macrophage maturation (The FANTOM Consortium and the Riken Omics Science Center 2009; Taft et al. 2009). These libraries are of sufficient sequencing depth to make an accurate assessment of the prevalence of editing in mature miRNAs. Similar to cross-hybridization in microarray experiments, short RNA sequences obtained from deep-sequencing experiments can be inadvertently mapped to multiple, and sometimes incorrect, loci if there are many similar sequences in the genome or if sequencing errors or post-transcriptional modifications occur. Such cross-mapping events can lead to overrepresented mismatches at specific genome locations between the genome sequence and the RNA sequence, giving the appearance of RNA editing. Using a novel strategy to avoid cross-mapping artifacts, we find that editing of mature miRNAs is rare. Indeed, reanalysis of murine deep-sequencing data (Reid et al. 2008) suggests that cross-mapping rather than RNA editing is responsible for the previously observed sequence heterogeneity in the murine let-7 miRNA family.
Results
The FANTOM4 short RNA libraries
The FANTOM4 project sought to detail the entire genetic network of a model human monocytic leukemia cell line, THP-1, as it differentiated from a monoblast-like to a monocyte-like cell after stimulation with PMA (The FANTOM Consortium and the Riken Omics Science Center 2009). As part of this effort, short RNAs, 10 to 26 nt in size, were harvested at eight time points over 96 h and were reverse-transcribed to produce cDNAs, which were sequenced using a 454 Life Sciences (Roche) sequencer (Taft et al. 2009). To analyze editing sites in mature miRNAs, we combined sequences from all time points into a data set of ∼3.5 million short RNAs. To ensure that miRNA editing could be accurately assessed in this model, we examined the expression of the adenosine deaminase (ADAR) and the cytodine deaminase (APOBEC) families of proteins by microarray and CAGE profiling (The FANTOM Consortium and the Riken Omics Science Center 2009) and confirmed that they are expressed throughout the PMA time course (Supplemental Fig. 1).
Cross-mapping in short RNA sequencing libraries
We mapped THP-1 small RNAs to the human genome and identified all loci where they aligned with the fewest errors. An error can be a mismatch, an insertion, or a deletion (for details, see Methods). Small RNAs do not necessarily map uniquely. As shown in Figure 1, more than half of the short RNAs in the FANTOM4 library map to multiple loci. The ambiguity in the genomic origin of these RNAs may lead to cross-mapping, in which a short RNA originating from one locus is partially or completely assigned to a different location. Cross-mapping complicates an accurate identification of RNA editing sites, which is based on an analysis of the mismatches between the sequenced RNA (i.e., the deep sequencing tag) and the genome. However, as shown in Figure 1, 66% of short RNAs with one mismatch map to multiple genome locations, making this analysis nontrivial.
Figure 1.

Number of mapping locations. The number of mapping locations for all FANTOM4 THP-1 short RNA sequences. More than half of the short RNAs in these libraries map to more than one genome location.
MicroRNAs are particularly susceptible to cross-mapping, as they are short and tend to occur in families with highly similar sequences (Bartel 2004). A further complication is that many mature miRNAs have single-nucleotide non-template 3′ adenosine or uracil additions (Landgraf et al. 2007; Kuchenbauer et al. 2008; Jones et al. 2009; Katoh et al. 2009). Figure 2 shows an example of cross-mapping between the let-7b and let-7c miRNAs, whose mature miRNAs differ by only one nucleotide. Let-7b with an additional 3′ adenosine maps equally well to the let-7b locus and the let-7c locus. The sequence counts of such multimapping RNAs are usually divided equally between the candidate genomic loci, assigned arbitrarily to one of the mapping locations, or discarded altogether (Ruby et al. 2006; Landgraf et al. 2007; Babiarz et al. 2008; Morin et al. 2008; Taft et al. 2009). In this example, short RNAs produced at the let-7b locus, but cross-mapped to let-7c, will lead to overrepresented mismatches at bases where let-7c differs from let-7b, resulting in an alignment that can be incorrectly interpreted as an RNA editing site in let-7c.
Figure 2.

Cross-mapping in short RNA sequencing libraries. Sequences in green and blue represent the genome sequence and the RNA sequence, respectively. Mismatches between the genome sequence and the RNA sequence are shown in red. A miRNA sequence with an additional 3′ adenosine, either due to post-transcriptional addition (as discussed in the text) or a sequencing error, maps equally well to the genome loci encoding the human miRNAs let-7b and let-7c. This miRNA sequence was read 20 times in the FANTOM4 time course short RNA libraries. Dividing the sequence counts equally between these two genome loci leads to a spurious RNA editing site in let-7c. Alternatively, cross-mapping to unannotated genome regions may give rise to spurious novel noncoding RNA loci.
To counter the effects of cross-mapping, we have developed an expectation-maximization algorithm, described in detail in the Methods, which assigns weights to the candidate loci of each short RNA using both the expression level and the alignment between the RNA and the genome sequence (Fig. 3). At each iteration of the algorithm, we calculate the expression level from the weighted number of RNAs that map at each locus, and assign a probability to the sequence alignment between the RNA and the genome sequence. The latter is calculated using an error profile, representing the overall prevalence of alignment errors as a function of position along the alignment. We then calculate the number of RNAs expected at each candidate mapping location, and choose the mapping weights in proportion to this value. Upon convergence of the expectation-maximization algorithm, the sequence counts of multimapping RNAs are assigned to their candidate mapping locations according to the mapping weights. To assess the impact of this approach, we contrast it to an equal-weight strategy. We calculate a weight ratio of an RNA mapping at a candidate mapping site by dividing the value of the weight obtained in our weighting strategy by its value under an equal-weight approach (for details, see Methods). Figure 4A shows the cumulative distribution of these weight ratios. For more than 75% of the mappings, the cross-map corrected weight differs from the corresponding equal weight by more than 25%. Most of the weight ratios are less than one, whereas a few mappings have a weight ratio much larger than one. This implies that the cross-mapping correction based on this weighting scheme establishes a clear preference between the candidate mapping locations, which we found to be independent of the expression level of the short RNA (Fig. 4B).
Figure 3.

Cross-mapping correction strategy. For each short RNA that can be aligned to multiple genome regions with an equal number of errors, our strategy to correct for cross-mapping assigns weights to each candidate mapping location based on the local expression level as well as the alignment errors. The latter is based on the error profile describing the probability of an alignment error as a function of the position along the alignment. Both the local expression level and the error profile are calculated from the mapped RNAs themselves using an expectation-maximization algorithm. First, we assign equal weights to all candidate mapping locations. We then calculate the error profile and the expression level of each genome location from the complete set of mapped RNA sequences. This allows us then to recalculate the error profile and the expression levels. This process is iterated until convergence.
Figure 4.

Effect of the cross-mapping correction on mapping weights. The weight ratio is defined as the weight calculated by the cross-mapping correction strategy divided by the corresponding weight under an equal-weight strategy (see text for more detail). The more a weight ratio differs from unity, the larger the cross-mapping correction. (A) The cumulative distribution of the weight ratios, revealing that most weights are reduced in comparison to the equal-weight strategy, while a few weights are greatly increased. (B) A two-dimensional binning plot of the count of each short RNA sequence and the weight ratio, using a logarithmic color scheme to represent the number of mapping events in each bin.
Identification of editing sites in mature miRNAs
Almost half (43.5%) of the small RNAs in the FANTOM4 time course can be mapped to loci encoding miRNAs, and 19% can be aligned to transfer RNAs (tRNAs) (Supplemental Fig. 2). In total, 236 mature miRNAs with a total count of at least 10 were identified (see Supplemental Table 1). Cross-mapping did not affect the relative expression values of the majority of miRNAs (Fig. 5; Supplemental Table 2).
Figure 5.

Comparison of miRNA expression before and after cross-mapping correction. This scatter plot shows the expression of miRNAs before and after correcting for cross-mapping. With a Spearman correlation coefficient of 0.99, the cross-mapping correction has a minor effect on the estimated expression of most miRNAs. However, for 14 miRNAs the relative difference between the estimated expression with and without the cross-mapping correction was larger than 50%. These miRNAs are circled and shown together with their short RNA counts before and after the cross-mapping correction.
To search for putative RNA editing sites, each position along the length of mature miRNAs was analyzed to find the total number of RNA reads, as well as the number of mismatches. Under the null hypothesis, mismatches are caused by experimental errors rather than by miRNA editing. We calculated the tail probability of finding the mismatches associated with any particular locus using the rate of experimental errors given by the error profile, and applied the Bonferroni correction to correct for multiple testing. We rejected the null hypothesis if the Bonferroni-corrected tail probability at a particular genome position is less than 0.05, suggesting that the overrepresented mismatches at that position are due to editing (for details, see Methods). For a typical case in which 100 transcripts of a given miRNA are sequenced, an editing site can be detected if at least 10% of the transcripts contain the modified nucleotide.
Table 1 shows all potential RNA editing sites found in the FANTOM4 short RNA data in mature miRNA sequences, excluding overrepresented mismatches at the 3′ terminal position, which can be affected by enzymatic nucleotide additions to the 3′ end (Jones et al. 2009; Katoh et al. 2009). Without correcting for cross-mapping, we find 10 genome locations in nine miRNA species in which the number of mismatches between the RNA sequence and the genome is statistically significant (P < 0.05). However, only three mismatch sites remain after correcting for cross-mapping.
Table 1.
Overrepresented mismatches in mature miRNA sequences

This table shows all overrepresented mismatches found in mature miRNAs before and after correcting for cross-mapping, except those occurring at the 3′ terminal nucleotide of the mature miRNA, together with the corresponding sequence counts, statistical significance after Bonferroni correction (see Methods), and the origin of cross-mapping RNAs if applicable. Before correcting for cross-mapping, 10 such potential miRNA editing sites are found. As shown in this table, eight of these are due to cross-mapping; one additional apparent editing site is due to a single nucleotide polymorphism in the THP-1 genome. The remaining editing site, in the mature miR-376c, has been identified previously (Kawahara et al. 2007a).
To verify that sites of overrepresented mismatches are indeed caused by cross-mapping rather than miRNA editing, we calculated the Spearman correlation along the PMA time course between RNAs that map to the genome with mismatches and highly expressed RNAs that map unambiguously at each of the candidate mapping loci. This is an independent verification of the cross-mapping correction, since the correlation along the time course depends on the relative expression variation between time points, but not on the absolute counts of each RNA, whereas the cross-mapping correction depends on the total count of each RNA summed over the eight time points, but not on the RNA counts at each time point separately. For each of the potential editing sites, we identified the most highly expressed perfectly mapping short RNA at the miRNA site as well as the proposed cross-mapping origin and calculated the Spearman correlation between their sequence counts and the counts of the most highly expressed sequence containing a mismatch at the potential miRNA editing site. As shown in Figure 6, we found that the correlation at the proposed cross-mapping origin was higher than the correlation at the miRNA locus, in agreement with our conclusion that the sites with overrepresented mismatches are caused by cross-mapping rather than RNA editing.
Figure 6.

Verification of the cross-mapping correction at spurious editing sites. Our analysis showed that eight out of 10 sites with overrepresented mismatches in mature miRNAs are due to cross-mapping rather than true RNA editing sites (Table 1). For each of these miRNAs, we identified the most abundant RNA that mapped exactly (i.e., without mismatches) to the miRNA locus and the most abundant RNA that mapped to the putative origin of cross-mapping. We also identified the most abundant RNA mapping to the miRNA locus with one mismatch at the site of overrepresented mismatches. For this RNA, we calculated the Spearman correlation along the time course of its counts with the counts of the RNA derived from the miRNA locus (light gray), and the Spearman correlation along the time course of the RNA derived from the putative origin of cross-mapping (dark gray). In all cases, we find that the putative origin of cross-mapping yields a stronger correlation than the miRNA site, supporting our conclusion that the mismatched RNA originates from the cross-mapping locus rather than the miRNA locus.
As shown in Table 1, cross-mapping typically occurs between miRNAs of the same family (e.g., miR-27a and miR-27b or miR-18a and miR-18b), although in miR-1274a, a spurious editing site is caused by cross-mapping of RNA fragments from a lysine tRNA. Indeed, this miRNA was previously discovered by deep RNA sequencing (Morin et al. 2008), overlaps an annotated ERVK long terminal repeat, and may itself be a cross-mapping artifact. Similarly, cross-mapping is likely to be responsible for a spurious editing site in miR-1260. Small RNAs that map to miR-1260 with a single mismatch can alternatively be mapped to leucine tRNA, which is expressed almost 80 times higher than miR-1260. As shown in Supplemental Figure 3, the expression level of leucine tRNA more than compensates for the alignment with fewer errors to miR-1260. Indeed, the odds-ratio that this sequence originates from leucine tRNA instead of miR-1260 is more than 36, strongly suggesting that the overrepresented mismatches at the putative editing site in miR-1260 are due to cross-mapping leucine tRNA sequences rather than miRNA editing.
G-to-C mismatches were found at the tenth residue in 187 of 250 RNAs that map to miR-629. Since no enzyme has been identified that mediates such editing events, we considered the possibility that these overrepresented mismatches were due to a nucleotide polymorphism in the THP-1 genome. Indeed, resequencing of this genomic region revealed a novel single nucleotide polymorphism (SNP): A cytosine nucleotide instead of a guanine can be found at the mismatch location in THP-1 cells (Supplemental Fig. 4).
In miR-376c we found A-to-G mismatches at position 6 of the mature miRNA in eight out of 10 RNA sequences. This position was previously identified as an A-to-I editing site (Kawahara et al. 2007a), and was the only editing site validated by the cross-mapping correction in mature miRNAs in the FANTOM4 libraries.
In contrast to mature miRNAs, we found 385 genome sites with overrepresented mismatches in tRNA sequences after correcting for cross-mapping. Most (61%) of these sites are known to be post-transcriptionally modified (Supplemental Table 3), similar to what was recently found in an analysis of high-throughput short RNA sequencing libraries in plants (Ebhardt et al. 2009).
Given the apparent paucity of bona fide editing sites in mature miRNAs, we reanalyzed the short RNA data (Reid et al. 2008) that purportedly showed evidence of editing at the ninth position of murine mature let-7a. Using the same methodology we used to analyze the FANTOM4 data, we mapped these short RNAs to the mouse genome and applied the cross-mapping correction strategy. Supplemental Table 4 shows the alignments between the sequenced short RNA and members of the murine let-7 family. The short RNA sequences that map to the let-7a locus with a mismatch at the proposed editing position can alternatively be mapped to miRNA let-7e, with a single mismatch at the 3′ terminal nucleotide. Our cross-mapping analysis finds an 80% probability that these sequences are produced from the let-7e locus instead of the let-7a locus. This suggests that these sequences originate from the let-7e locus with a single 3′ nucleotide extension, rather than the let-7a locus with a U-to-G editing event, and that the overrepresented mismatches in murine let-7a are caused by cross-mapping rather than RNA editing.
Discussion
Small RNA sequences that cross-map to multiple genome locations can give rise to spurious alignments that can be interpreted as novel editing events. miRNAs are particularly likely to cross-map, since they are short, occur in families with highly similar sequences, and may contain nontemplate single-nucleotide additions on their 3′ end. Previous miRNA microarray probe design algorithms have attempted to ameliorate the chance of cross-hybridization between miRNAs with single-base differences (Lee et al. 2008). Similarly, our strategy aims to mitigate the occurrence of cross-mapping artifacts in high-throughput short RNA sequencing experiments by carefully weighting the assignment of RNAs to genome loci. Similar strategies have been developed previously for mapping short sequences obtained from CAGE and RNA-seq (Jurka 2000; Faulkner et al. 2008).
Alignment errors preferentially occur near the 5′ and 3′ ends of short RNAs and are likely due to imperfections in the linker ligation during the construction of the cDNA library used for sequencing and enzymatic nucleotide additions to the 3′ end of miRNAs (Jones et al. 2009; Katoh et al. 2009), rather than to true sequencing errors. Cross-mapping caused by such alignment errors, therefore, cannot be resolved by using the per-nucleotide quality scores of the sequences reads as used in the mapping algorithms implemented in MAQ (Li et al. 2008) and Bowtie (Langmead et al. 2009). Mapping our short RNA data set by MAQ resulted in three new spurious miRNA editing sites due to cross-mapping, in addition to those shown in Table 1, while the true miRNA editing site in miR-376c was missed. Using Bowtie resulted in eight new spurious miRNA editing sites.
Our cross-mapping correction uses both the expression level and the error profile to assign weights to candidate mapping locations. Mortazavi et al. (2008) previously developed a weighting scheme for RNA-seq and SNP detection, in which sequences mapping to multiple locations are weighted based on the counts of uniquely mapping sequences in the neighborhood of each candidate mapping location. Applying this method to our short RNA data set resulted in three to eight spurious cross-mapping loci, depending on which alignment program was used to find the candidate mapping locations.
Current mapping strategies typically use a hierarchical approach, which first attempts to map short RNAs to the genome without any mismatches, then to map the remaining short RNAs with one mismatch, and continue this process up to some upper limit on the allowable number of mismatches. Due to the large dynamic range in deep-sequencing libraries, this strategy may not be optimal. For example, we can reasonably expect the absolute number of sequences with errors to increase with the sequences produced at a given locus. Indeed, the most highly expressed short RNA in the FANTOM4 libraries, which mapped to miR-27a, was sequenced 107,777 times. With errors preferentially occurring at the 5′ and 3′ end of the RNA, even a 1% error rate can result in thousands of short RNAs cross-mapping to a locus elsewhere in the genome, confounding expression, annotation, or editing analyses, as illustrated by the example of miR-1260 above. Hence, particularly for sequences originating from highly expressed loci, the candidate genome locus with the fewest alignment errors is not necessarily the best. In general, these kinds of artifacts can be avoided by including more candidate mapping locations in the analysis, even though the alignment quality between the transcript and the genome sequence may be lower. For example, the ELAND mapping software (AJ Cox, unpubl.) reports all candidate mapping loci with up to two mismatches, instead of only the locus with simply the best sequence alignment. Such a strategy could particularly be useful if combined with a cross-mapping correction strategy, as RNAs would be assigned a very low weight at candidate mapping loci where they align poorly except if they are highly expressed.
The recent revelation that tRNAs can be processed into discrete small RNA species (Kawaji et al. 2008; Elbarbary et al. 2009; Thompson and Parker 2009; Yamasaki et al. 2009) further complicates the analysis of small RNA deep-sequencing libraries. tRNA-derived small RNAs are highly expressed and are therefore particularly prone to produce cross-mapping artifacts, suggesting that cross-mapping correction is an essential step of deep-sequencing data analysis. Indeed, tRNAs are also characterized by post-transcriptional modifications, including CCA additions to the 3′ end of tRNAs and site-specific nucleotide modifications (Ebhardt et al. 2009), which cause mismatches between the genome and the sequenced RNA. An example of the latter is the methylated adenine in the TΨC arm of tRNAs, which is frequently read as a uridine in our RNA sequencing libraries. Whereas our mapping strategy already takes the 3′ CCA sequence tags into account (see Methods), other post-transcriptional modifications are more difficult to include, as such modifications and their potential manifestation in short RNA sequencing are generally unknown. Examples of miRNAs that align to mature tRNAs, suggesting that they may be cross-mapping artifacts, are the human miRNAs miR-720, miR-1274a, miR-1274b, and miR-1308, and the mouse miRNAs miR-720, miR-1937a, and miR-1937b.
Few editing events in mature miRNAs in animals
The FANTOM4 time course short RNA libraries are dominated by mature miRNAs, which occur in miRNA families with highly similar mature miRNA sequences. Cross-mapping between different miRNAs may lead to the artifactual identification of editing or modification sites, since cross-mapping RNAs originating from a particular locus will, at the cross-mapped locus, give rise to sequence mismatches at specific genome positions.
We found few bona-fide editing sites in mature miRNAs sequenced in the FANTOM4 libraries. Overrepresented mismatches at specific genome positions were, in the vast majority of cases, caused by cross-mapping short RNAs originating from other miRNAs or from tRNAs. Similarly, previously identified sites of overrepresented mismatches in mature miRNAs (Reid et al. 2008) also seem to be due to cross-mapping rather than RNA editing. The lack of editing in mature miRNAs supports the idea that the primary biological function of miRNA editing in animals is the regulation of the processing pathway, rather than the targeting of miRNAs (Kawahara et al. 2007b, 2008).
Methods
THP-1 cell culture, RNA extraction, small RNA library preparation, and sequencing were described previously (Taft et al. 2009). As the presence of more than one bead within one droplet in the water/oil emulsion used for PCR amplification gives rise to multiple counts of identical reads, only one count was retained for identical reads to avoid emulsion PCR biases. Potential editing sites in mature murine miRNAs (Reid et al. 2008) were analyzed using sequences that were kindly provided by the Gunaratne laboratory (Department of Biology and Biochemistry, University of Houston, TX).
Finding candidate mapping sites of small RNAs
We align each sequenced RNA to the genome by minimizing the number of substitutions, insertions, and deletions in the alignment. To enable an unbiased assessment of the occurrence of RNA editing, we allowed any number of alignment errors between the RNA and the genome.
We used Nexalign (T Lassmann, unpubl.; http://genome.gsc.riken.jp/osc/english/software) for alignments with up to one mismatch, insertion, or deletion. Nexalign is a suffix array-based method (Manber and Myers 1990) that guarantees to find all full-length exact matches of a query to a target database. To allow for matching with errors, Nexalign generates a library of all sequences that can be generated from the queries using the user-specified number of mismatches, insertions, or deletions. All sequences in the libraries are searched one by one, thus guaranteeing a complete set of matches within the given number of mismatches, insertions, or deletions. Per-base quality values are not taken into consideration.
Using Nexalign, we first map the extracted small RNA reads, using exact matches only, to the human genome (assembly hg18; NCBI build 36.1) (The Genome Sequencing Consortium 2001; Kuhn et al. 2009), ribosomal sequences contained in the GenBank (Benson et al. 2008) record with accession number U13369, and a collection of human mature tRNAs, which was created by appending the CCA sequence tag to the 3′ end of each tRNA sequence as encoded in the genome (see Supplemental Table 5). This sequence, which is added post-transcriptionally during the maturation process of tRNAs, is usually not present in the genome. Short RNA sequences mapping to ribosomal sequences were removed from the further analysis, while the coordinates of short RNAs mapping to mature tRNAs were converted to genome coordinates. The remaining short RNAs were then mapped, using Nexalign, to the human genome, ribosomal sequences, and mature tRNAs, allowing for one mismatch, insertion, or deletion, again converting the coordinates of short RNAs mapping to mature tRNAs and discarding short RNAs mapping to ribosomal sequences. The remaining short RNAs were mapped to the genome, ribosomal sequences, and mature tRNA sequences using BLAST (Altschul et al. 1990) with the command-line options -p blastn -m 7 -F F -G 10 -E 6 -q -4 -r 5 -W 7 -b 1000000 -v 1000000 -J T. The short RNAs were then aligned to the regions identified by Blast, extended by 10 bp on both sides, using an in-house global alignment algorithm to obtain an alignment over the full length of the RNA. Alignments with the minimum number of errors were retained, where each mismatch, insertion, or deletion in the alignment was counted as one error. Without correcting for cross-mapping, the counts of RNAs mapping to more than one locus with an equal number of errors were divided equally between these loci. RNAs mapping to more than 100 locations were removed from the analysis.
Cross-mapping correction
The mapping procedure described above finds candidate mapping locations in the genome for each of the RNAs in the data set. For short RNAs with multiple candidate mapping sites, we apply the cross-mapping correction to assign weights to each candidate mapping site.
The cross-mapping correction calculates weights using both the expression level of each candidate mapping site and the errors in the alignment between the short RNA and the genome sequence at each candidate mapping site. The expression level of each candidate mapping site depends on the number of short RNAs mapping there, whereas the alignment errors are assessed using an error profile describing the prevalence of errors as a function of position along the RNA. Since both the expression level and the error profile depend on the weights assigned to each short RNA, the cross-mapping correction is necessarily an iterative process.
As the first step of the cross-mapping correction, for each short RNA r we assign an equal weight wi(r) = 1/mr to each of its mr candidate mapping locations. The expression level of a candidate mapping site i is then calculated as
where the sum extends over all RNAs r that overlap the candidate mapping site i, and wi(r) is the weight of RNA r mapping to candidate mapping site i.
We also calculate the error profile, defined as the relative frequency of alignment errors as a function of the position k along the RNA:
 |
where ai(r; k) equals 1 if there is an alignment error at position k along the RNA in the alignment of RNA r to candidate mapping location i, and 0 otherwise. In practice, we found that the error profile is larger toward the 5′ and 3′ ends of the RNA, and essentially flat toward the center of the RNA. We therefore calculate the error profile at the first, second, and third nucleotide at the 5′ end; the first, second, and third nucleotide at the 3′ end; and an average p at all intermediate positions. Supplemental Figure 5 shows the error profile as calculated for the FANTOM4 short RNA time course data.
Using the error profile, we can now calculate the probability Pr(r|si) that transcription of the candidate mapping region i with genome sequence si will result in a sequenced transcript r:
where the product extends over all positions k along the alignment.
By multiplying Equations 1 and 3, we find the number ni × Pr(r|si) of expected sequences r originating from candidate mapping site i. We assign weights to each candidate mapping site in proportion to this expected number of sequences:
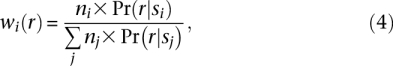 |
where j iterates over all candidate mapping locations of sequence r.
Using these weights, we recalculate the expression level of each genome location i using Equation 1, the error profile using Equation 2, the probabilities Pr(r|si) using Equation 3, and the weights using Equation 4. We repeat this process until convergence.
For lowly-expressed regions, where the expression level ni may be due to a single transcript variant, the presence of one uniquely mapping transcript in any of the candidate mapping regions will cause all multimapping transcripts to be assigned there at the exclusion of the other candidate mapping regions. To avoid such instabilities in the iteration process, we added pseudocounts equal to  , equally divided between the candidate mapping regions, to all expression levels ni in Equation 4.
Convergence is reached when the mapping weights wi(r) no longer change. We stop the iteration as soon as the absolute change in the weights wi(r) summed over all RNAs r and all candidate mapping locations i is less than 1. In practice, a much smaller number of iterations will be adequate. As a case in point, in our analysis of editing in mature miRNAs, a single iteration is sufficient to identify all spurious editing sites as such.
The weight ratios shown in Figure 4 were calculated by dividing the mapping weights wi(r) by their value under an equal-weight strategy, resulting in mr wi(r).
Analysis of potential miRNA editing sites
We calculate the number n of RNA sequences for each genome position in mature miRNAs as well as the number K of the most prevalent mismatch nucleotides at that position. Under the null hypothesis, we assume that the mismatches are caused by errors at a background probability p obtained from the error profiles calculated by the cross-mapping correction. The tail probability is then calculated as:
For non-integer K, n, this can be generalized as
where I is the regularized incomplete beta function.
We apply Bonferroni's correction for multiple hypothesis testing based on the number of sites N in mature miRNAs that were evaluated for the presence of overrepresented mismatches:
 |
Capillary sequencing of the miR-629 region in the THP-1 cell line
Total genome DNA from THP-1 cells was extracted with a DNeasy Blood & Tissue Kit (Qiagen) according to the manufacturer's instructions. The DNA fragments of the miR-629 region were amplified by PCR using the following two primers: SNP2_F: 5′-AGACAGGACTGTGTAGGGTTGAG-3′ and SNP2_R: 5′-CCAAGAGGGTACTAGCAGATGATG-3′. PCRs were performed in a total volume of 50 μL, using 0.5 μg of THP-1 genome DNA/1 μL of DNA polymerase (5 U/μL)/5 μL of 10× reaction buffer/1μL of 2.5 mM dNTPs/3 μL of 1 μM SNP2_F primer/3 μL of 1 μM SNP2_R primer/water up to 50 μL. Samples were incubated at 94°C for 7 min, 45 cycles at 94°C for 30 sec/63°C for 30 sec/73°C for 1 min, and at 72°C for 1 min were performed. A total of 10 μL of PCR samples were separated in 3% agarose gel, and the target band (188 bp) was cut out and extracted by Gelextraction kit (Qiagen). Capillary sequencing was performed using the ABI3100 sequencer according to the manufacturer's instructions.
Acknowledgments
This work was supported by a Research Grant for the RIKEN Omics Science Center from the Ministry of Education, Culture, Sports, Science, and Technology, Japan to Y.H., and a grant of the Genome Network Project from the Ministry of Education, Culture, Sports, Science and Technology, Japan to Y.H. (http://genomenetwork.nig.ac.jp/index_e.html).
Footnotes
[Supplemental material is available online at http://www.genome.org.]
Article published online before print. Article and publication date are at http://www.genome.org/cgi/doi/10.1101/gr.095273.109.
References
- Altschul SF, Gish W, Miller W, Myers EW, Lipman DJ. Basic local alignment search tool. J Mol Biol. 1990;215:403–410. doi: 10.1016/S0022-2836(05)80360-2. [DOI] [PubMed] [Google Scholar]
- Babiarz JE, Ruby JG, Wang Y, Bartel DP, Blelloch R. Mouse ES cells express endogenous shRNAs, siRNAs, and other Microprocessor-independent, Dicer-dependent small RNAs. Genes & Dev. 2008;22:2773–2785. doi: 10.1101/gad.1705308. [DOI] [PMC free article] [PubMed] [Google Scholar]
- Bartel DP. MicroRNAs: Genomics, biogenesis, mechanism, and function. Cell. 2004;116:281–297. doi: 10.1016/s0092-8674(04)00045-5. [DOI] [PubMed] [Google Scholar]
- Benson DA, Karsch-Mizrachi I, Lipman DJ, Ostell J, Wheeler DL. GenBank. Nucleic Acids Res. 2008;36:D25–D30. doi: 10.1093/nar/gkm929. [DOI] [PMC free article] [PubMed] [Google Scholar]
- Blow MJ, Grocock RJ, Van Dongen S, Enright AJ, Dicks E, Futreal PA, Wooster R, Stratton MR. RNA editing of human microRNAs. Genome Biol. 2006;7:R27. doi: 10.1186/gb-2006-7-4-r27. [DOI] [PMC free article] [PubMed] [Google Scholar]
- Ebhardt HA, Tsang HH, Dai DC, Liu Y, Bostan B, Fahlman RP. Meta-analysis of small RNA-sequencing errors reveals ubiquitous post-transcriptional RNA modifications. Nucleic Acids Res. 2009;37:2461–2470. doi: 10.1093/nar/gkp093. [DOI] [PMC free article] [PubMed] [Google Scholar]
- Elbarbary RA, Takaku H, Uchiumi N, Tamiya H, Abe M, Takahashi M, Nishida H, Nashimoto M. Modulation of gene expression by human cytosolic tRNase ZL through 5′-half-tRNA. PLoS One. 2009;4:e5908. doi: 10.1371/journal.pone.0005908. [DOI] [PMC free article] [PubMed] [Google Scholar]
- The FANTOM Consortium and the Riken Omics Science Center. The transcriptional network that controls growth arrest and differentiation in a human myeloid leukemia cell line. Nat Genet. 2009;41:553–562. doi: 10.1038/ng.375. [DOI] [PMC free article] [PubMed] [Google Scholar]
- Faulkner GJ, Forrest ARR, Chalk AM, Schroder K, Hayashizaki Y, Carninci P, Hume DA, Grimmond SM. A rescue strategy for multimapping short sequence tags refines surveys of transcriptional activity by CAGE. Genomics. 2008;91:281–288. doi: 10.1016/j.ygeno.2007.11.003. [DOI] [PubMed] [Google Scholar]
- The Genome Sequencing Consortium. Initial sequencing and analysis of the human genome. Nature. 2001;409:860–921. doi: 10.1038/35057062. [DOI] [PubMed] [Google Scholar]
- Gottwein E, Cai X, Cullen BR. A novel assay for viral microRNA function identifies a single nucleotide polymorphism that affects Drosha processing. J Virol. 2006;80:5321–5326. doi: 10.1128/JVI.02734-05. [DOI] [PMC free article] [PubMed] [Google Scholar]
- Jones MR, Quinton LJ, Blahna MT, Neilson JR, Fu S, Ivanov AR, Wolf DA, Mizgerd JP. Zcchc11-dependent uridylation of microRNA directs cytokine expression. Nat Cell Biol. 2009;11:1157–1163. doi: 10.1038/ncb1931. [DOI] [PMC free article] [PubMed] [Google Scholar]
- Jurka J. Repbase update: A database and an electronic journal of repetitive elements. Trends Genet. 2000;16:418–420. doi: 10.1016/s0168-9525(00)02093-x. [DOI] [PubMed] [Google Scholar]
- Kahvejian A, Quackenbush J, Thompson JF. What would you do if you could sequence everything? Nat Biotechnol. 2008;26:1125–1133. doi: 10.1038/nbt1494. [DOI] [PMC free article] [PubMed] [Google Scholar]
- Katoh T, Sakaguchi Y, Miyauchi K, Suzuki T, Kashiwabara S-I, Baba T, Suzuki T. Selective stabilization of mammalian microRNAs by 3′ adenylation mediated by the cytoplasmic poly(A) polymerase GLD-2. Genome Res. 2009;23:433–438. doi: 10.1101/gad.1761509. [DOI] [PMC free article] [PubMed] [Google Scholar]
- Kawahara Y, Zinshteyn B, Sethupathy P, Iizasa H, Hatzigeorgiou AG, Nishikura K. Redirection of silencing targets by adenosine-to-inosine editing of miRNAs. Science. 2007a;315:1137–1140. doi: 10.1126/science.1138050. [DOI] [PMC free article] [PubMed] [Google Scholar]
- Kawahara Y, Zinshteyn B, Chendrimada TP, Shiekhattar R, Nishikura K. RNA editing of the microRNA-151 precursor blocks cleavage by the Dicer–TRBP complex. EMBO Rep. 2007b;8:763–769. doi: 10.1038/sj.embor.7401011. [DOI] [PMC free article] [PubMed] [Google Scholar]
- Kawahara Y, Megraw M, Kreider E, Iizasa H, Valente L, Hatzigeorgiou AG, Nishikura K. Frequency and fate of microRNA editing in human brain. Nucleic Acids Res. 2008;36:5270–5280. doi: 10.1093/nar/gkn479. [DOI] [PMC free article] [PubMed] [Google Scholar]
- Kawaji H, Nakamura M, Takahashi Y, Sandelin A, Katayama S, Fukuda S, Daub CO, Kai C, Kawai J, Yasuda J, et al. Hidden layers of human small RNAs. BMC Genomics. 2008;9:157. doi: 10.1186/1471-2164-9-157. [DOI] [PMC free article] [PubMed] [Google Scholar]
- Kuchenbauer F, Morin RD, Argiropoulos B, Petriv OI, Griffith M, Heuser M, Yung E, Piper J, Delaney A, Prabhu AL, et al. In-depth characterization of the microRNA transcriptome in a leukemia progression model. Genome Res. 2008;18:1787–1797. doi: 10.1101/gr.077578.108. [DOI] [PMC free article] [PubMed] [Google Scholar]
- Kuhn RM, Karolchik D, Zweig AS, Wang T, Smith KE, Rosenbloom KR, Rhead B, Raney BJ, Pohl A, Pheasant M, et al. The UCSC Genome Browser Database: Update 2009. Nucleic Acids Res. 2009;37:D755–D761. doi: 10.1093/nar/gkn875. [DOI] [PMC free article] [PubMed] [Google Scholar]
- Landgraf P, Rusu M, Sheridan R, Sewer A, Iovino N, Aravin A, Pfeffer S, Rice A, Kamphorst AO, Landthaler M, et al. A mammalian microRNA expression atlas based on small RNA library sequencing. Cell. 2007;129:1401–1414. doi: 10.1016/j.cell.2007.04.040. [DOI] [PMC free article] [PubMed] [Google Scholar]
- Langmead B, Trapnell C, Pop M, Salzberg SL. Ultrafast and memory-efficient alignment of short DNA sequences to the human genome. Genome Biol. 2009;10:R25. doi: 10.1186/gb-2009-10-3-r25. [DOI] [PMC free article] [PubMed] [Google Scholar]
- Lee I, Ajay SS, Chen H, Maruyama A, Wang N, McInnis MG, Athey BD. Discriminating single-base difference miRNA expressions using microarray Probe Design Guru (ProDeG) Nucleic Acids Res. 2008;36:e27. doi: 10.1093/nar/gkm1165. [DOI] [PMC free article] [PubMed] [Google Scholar]
- Lee I, Ajay SS, Yook JI, Kim HS, Hong SH, Kim NH, Dhanasekaran SM, Chinnaiyan A, Athey BD. New class of microRNA targets containing simultaneous 5′-UTR and 3′-UTR interaction sites. Genome Res. 2009;19:1175–1183. doi: 10.1101/gr.089367.108. [DOI] [PMC free article] [PubMed] [Google Scholar]
- Li H, Ruan J, Durbin R. Mapping short DNA sequencing reads and calling variants using mapping quality scores. Genome Res. 2008;18:1851–1858. doi: 10.1101/gr.078212.108. [DOI] [PMC free article] [PubMed] [Google Scholar]
- Luciano DJ, Mirsky H, Vendetti NJ, Maas S. RNA editing of a miRNA precursor. RNA. 2004;10:1174–1177. doi: 10.1261/rna.7350304. [DOI] [PMC free article] [PubMed] [Google Scholar]
- Manber U, Myers G. Proceedings of the first annual ACM-SIAM symposium on discrete algorithms. Society for Industrial and Applied Mathematics; Philadelphia: 1990. Suffix arrays: A new method for on-line string searches; pp. 319–327. [Google Scholar]
- Morin RD, O'Connor MD, Griffith M, Kuchenbauer F, Delaney A, Prabhu AL, Zhao Y, McDonald H, Zeng T, Hirst M, et al. Application of massively parallel sequencing to microRNA profiling and discovery in human embryonic stem cells. Genome Res. 2008;18:610–621. doi: 10.1101/gr.7179508. [DOI] [PMC free article] [PubMed] [Google Scholar]
- Morozova O, Marra MA. Applications of next-generation sequencing technologies in functional genomics. Genomics. 2008;92:255–264. doi: 10.1016/j.ygeno.2008.07.001. [DOI] [PubMed] [Google Scholar]
- Mortazavi A, Williams BA, McCue K, Schaeffer L, Wold B. Mapping and quantifying mammalian transcriptomes by RNA-Seq. Nat Methods. 2008;5:621–628. doi: 10.1038/nmeth.1226. [DOI] [PubMed] [Google Scholar]
- Obernosterer G, Leuschner PJF, Alenius M, Martinez J. Post-transcriptional regulation of microRNA expression. RNA. 2006;12:1161–1167. doi: 10.1261/rna.2322506. [DOI] [PMC free article] [PubMed] [Google Scholar]
- Reid JG, Nagaraja AK, Lynn FC, Drabek RB, Muzny DM, Shaw CA, Weiss MK, Naghavi AO, Khan M, Zhu H, et al. Mouse let-7 miRNA populations exhibit RNA editing that is constrained in the 5′-seed/ cleavage/anchor regions and stabilize predicted mmu-let-7a:mRNA duplexes. Genome Res. 2008;18:1571–1581. doi: 10.1101/gr.078246.108. [DOI] [PMC free article] [PubMed] [Google Scholar]
- Ruby JG, Jan C, Player C, Axtell MJ, Lee W, Nusbaum C, Ge H, Bartel DP. Large-scale sequencing reveals 21U-RNAs and additional microRNAs and endogenous siRNAs in C. elegans. Cell. 2006;127:1193–1207. doi: 10.1016/j.cell.2006.10.040. [DOI] [PubMed] [Google Scholar]
- Schuster SC. Next-generation sequencing transforms today's biology. Nat Methods. 2008;5:16–18. doi: 10.1038/nmeth1156. [DOI] [PubMed] [Google Scholar]
- Taft RJ, Glazov EA, Cloonan N, Simons C, Stephen S, Faulkner GJ, Lassmann T, Forrest ARR, Grimmond SM, Schroder K, et al. Tiny RNAs associated with transcription start sites in animals. Nat Genet. 2009;41:572–578. doi: 10.1038/ng.312. [DOI] [PubMed] [Google Scholar]
- Thompson DM, Parker R. The RNase Rny1p cleaves tRNAs and promotes cell death during oxidative stress in Saccharomyces cerevisiae. J Cell Biol. 2009;185:43–50. doi: 10.1083/jcb.200811119. [DOI] [PMC free article] [PubMed] [Google Scholar]
- Thomson JM, Newman M, Parker JS, Morin-Kensicki EM, Wright T, Hammond SM. Extensive post-transcriptional regulation of microRNAs and its implications for cancer. Genes & Dev. 2006;20:2202–2207. doi: 10.1101/gad.1444406. [DOI] [PMC free article] [PubMed] [Google Scholar]
- Viswanathan SR, Daley GQ, Gregory RI. Selective blockade of microRNA processing by Lin28. Science. 2008;320:97–100. doi: 10.1126/science.1154040. [DOI] [PMC free article] [PubMed] [Google Scholar]
- Winter J, Jung S, Keller S, Gregory RI, Diederichs S. Many roads to maturity: microRNA biogenesis pathways and their regulation. Nat Cell Biol. 2009;11:228–234. doi: 10.1038/ncb0309-228. [DOI] [PubMed] [Google Scholar]
- Yamasaki S, Ivanov P, Hu GF, Anderson P. Angiogenin cleaves tRNA and promotes stress-induced translational repression. J Cell Biol. 2009;185:35–42. doi: 10.1083/jcb.200811106. [DOI] [PMC free article] [PubMed] [Google Scholar]
- Yang W, Chendrimada TP, Wang Q, Higuchi M, Seeburg PH, Shiekhattar R, Nishikura K. Modulation of microRNA processing and expression through RNA editing by ADAR deaminases. Nat Struct Mol Biol. 2006;13:13–21. doi: 10.1038/nsmb1041. [DOI] [PMC free article] [PubMed] [Google Scholar]