

Abstract
MicroRNAs (miRNAs) are small noncoding RNAs that direct gene regulation through translational repression and degradation of complementary mRNA. Although miRNAs have been implicated as oncogenes and tumor suppressors in a variety of human cancers, functional roles for individual miRNAs have not been described in clear cell ovarian carcinoma, an aggressive and chemoresistant subtype of ovarian cancer. We performed deep sequencing to comprehensively profile miRNA expression in 10 human clear cell ovarian cancer cell lines compared with normal ovarian surface epithelial cultures and discovered 54 miRNAs that were aberrantly expressed. Because of the critical roles of the phosphatidylinositol 3-kinase/v-akt murine thymoma viral oncogene homolog 1/mammalian target of rapamycin (mTOR) pathway in clear cell ovarian cancer, we focused on mir-100, a putative tumor suppressor that was the most down-regulated miRNA in our cancer cell lines, and its up-regulated target, FRAP1/mTOR. Overexpression of mir-100 inhibited mTOR signaling and enhanced sensitivity to the rapamycin analog RAD001 (everolimus), confirming the key relationship between mir-100 and the mTOR pathway. Furthermore, overexpression of the putative tumor suppressor mir-22 repressed the EVI1 oncogene, which is known to suppress apoptosis by stimulating phosphatidylinositol 3-kinase/v-akt murine thymoma viral oncogene homolog 1 signaling. In addition to these specific effects, reversing the expression of mir-22 and the putative oncogene mir-182 had widespread effects on target and nontarget gene populations that ultimately caused a global shift in the cancer gene signature toward a more normal state. Our experiments have revealed strong candidate miRNAs and their target genes that may contribute to the pathogenesis of clear cell ovarian cancer, thereby highlighting alternative therapeutic strategies for the treatment of this deadly cancer.
Mir-100 is a candidate tumor suppressor microRNA that inhibits mTOR signaling and enhances sensitivity to the rapamycin analog RAD001 (everolimus) in clear cell ovarian cancer.
Ovarian cancer is the fifth leading cause of cancer death in women and the most lethal gynecologic malignancy in the Western world (1). Approximately 90% of ovarian cancers are epithelial (carcinomas) and are thought to arise via transformation of the ovarian surface epithelium (OSE), the single layer of squamous-to-cuboidal cells that constitutes the ovarian surface (2). The four major histological subtypes of ovarian carcinoma are serous (50% of ovarian cancers), endometrioid (20%), mucinous (10%), and clear cell (5%) (3,4,5). Each subtype is a genetically distinct disease with unique pathogenesis and different susceptibility to chemotherapy, yet the regulatory mechanisms underlying this heterogeneity are not well understood (5,6). Hence, the clinical management of ovarian carcinoma has remained relatively uniform across subtypes, thereby limiting progress in reducing mortality.
Clear cell ovarian cancers are characterized by cuboidal or hobnail epithelial cells with abundant glycogen-rich clear cytoplasm (7,8). Nearly 70% of clear cell ovarian carcinomas are diagnosed at an early stage (I and II), in contrast to 20% of serous ovarian carcinomas (9). Nonetheless, advanced stage clear cell disease has the worst prognosis of any subtype, with 5-yr disease-specific survival rates of 31.5% for stage III and 17.5% for stage IV cancer (9). These sobering statistics in part reflect resistance to platinum-based chemotherapy, and women with clear cell ovarian cancer also have a higher incidence of thromboembolic vascular complications and hypercalcemia (8,10,11,12). Similar to ovarian carcinomas of the endometrioid subtype, clear cell tumors are strongly associated with endometriosis (13,14,15).
The phosphatidylinositol 3-kinase (PI3K)/v-akt murine thymoma viral oncogene homolog 1 (AKT1)/mammalian target of rapamycin (FRAP1/mTOR) pathway is a key signaling system in cancer and multiple tissues including the ovary (16,17). The phosphorylation of phosphatidylinositol (4,5)-bisphosphate (PIP2) to phosphatidylinositol (3,4,5)-triphosphate (PIP3) by PI3K activates the pathway and downstream AKT signaling, whereas phosphatase and tensin homolog (PTEN) is an antagonist of this signaling pathway by reversing the phosphorylation status of PIP3 to PIP2. Constitutive activation of PI3K/AKT signaling is a distinguishing feature of clear cell and endometrioid ovarian carcinomas (5,7,16). Whereas endometrioid tumors demonstrate inactivating mutations in PTEN, gain of function mutations in PIK3CA, encoding the PI3K catalytic subunit, are more frequent in clear cell tumors than in any other subtype (18). The serine/threonine kinase mTOR is a principal downstream effector of AKT activation. Treatment of multiple ovarian cancer mouse models, including xenograft models of the clear cell subtype, with the mTOR inhibitor and rapamycin analog RAD001 (everolimus) delayed tumor development and/or dramatically reduced tumor burden, indicating the important therapeutic implications of specific inhibition of mTOR in vivo (19,20,21).
The discovery of miRNAs has added another layer of complexity to gene regulation in cancer. miRNAs are 21- to 23-nucleotide single-stranded noncoding RNAs that direct gene regulation through translational repression and degradation of complementary mRNA (22). Although target pairing in mammalian cells is often imperfect, the specificity of interaction is especially dependent on complementarity to nucleotides 2–8 of the mature miRNA, known as the seed sequence (22). Each miRNA is predicted to target hundreds of genes, and each transcript may interact with multiple miRNAs, underscoring the potential for broad, intricate regulatory networks.
Altered miRNA expression has been observed in a variety of human cancers, and miRNA signatures accurately reflect the developmental lineages and differentiation states of tumors (23,24). Several microarray profiling studies have found differentially expressed miRNAs between epithelial ovarian tumors and normal ovary, immortalized OSE cell lines, or primary OSE cultures, in addition to uncovering miRNAs that may predict chemoresponsiveness and prognosis (25,26,27,28,29,30,31). However, only a few miRNAs have been ascribed specific functional roles as oncogenes or tumor suppressors, mainly because identifying bona fide gene targets is a challenging task (reviewed in Ref. 32). For instance, TP53 inactivation is frequent in high-grade ovarian carcinomas and may subsequently decrease TP53-dependent miRNAs such as mir-34, leading to derepression of BCL2, CDK4/6, CCNE2, and MET (33). Reduced let-7i expression promotes chemoresistance (30), consistent with data indicating that let-7 family members are master regulators of cell proliferation and differentiation by suppressing KRAS, HRAS, MYC, and HMGA2 (34,35,36,37). Overexpression of mir-214 likewise enhances chemoresistance by targeting PTEN (27), whereas loss of function of mir-199a-5p up-regulates IκB kinase β and stimulates nuclear factor-κB signaling, possibly cultivating a protumor microenvironment (38).
These observations support the hypothesis that miRNAs contribute to the pathogenesis of ovarian cancer, but this work has predominantly centered on the most common serous subtype. Here, we performed deep sequencing to comprehensively profile and compare miRNA expression between an extensive panel of human clear cell ovarian cancer cell lines and short-term primary cultures of human normal ovarian surface epithelium. Putative target genes of differentially expressed miRNAs were identified by integrating in silico prediction algorithms with mRNA signatures. We then selected the top candidate miRNA, mir-100, which targets mTOR, as well as mir-22, mir-182, and mir-30a, and investigated the specific and global effects of each miRNA on the gene expression pattern of clear cell ovarian cancer, simultaneously performing preliminary validation for a multitude of presumptive target genes. Our experiments reveal influential roles for specific miRNAs in determining the clear cell gene signature and highlight candidate miRNA-mRNA interactions that might drive the formation or progression of this aggressive subtype of ovarian carcinoma.
Results
miRNAs are aberrantly expressed in clear cell ovarian cancer
We used Illumina next-generation sequencing technology to exhaustively identify the repertoire of approximately 18- to 30-nucleotide small RNAs expressed in human clear cell ovarian cancer cell lines and short-term primary cultures of human normal ovarian surface epithelium (NOSE). After passing the raw sequence data through a series of quality control filters (see Materials and Methods), on average we generated 3.8 million usable small RNA reads for each cancer specimen and 1.7 million usable small RNA reads for each NOSE culture. Approximately 50–70% of the reads for each sample mapped to known mature miRNAs in miRBase release 11.0, with 305 miRNAs detected in cancer, 227 miRNAs detected in NOSE (Table 1), and a total of 338 miRNAs detected in at least one sample. By comparing the miRNA signatures for clear cell ovarian cancer and NOSE, we found that 21 miRNAs were up-regulated and 33 miRNAs were down-regulated in cancer (P < 0.01, fold change >2) (Fig. 1A and supplemental data S2 published on The Endocrine Society's Journals Online web site at http://mend.endojournals.org).
Table 1.
Thirty most abundant miRNAs in NOSE and their average relative expression
| miRNA | % miRNA population |
|---|---|
| hsa-let-7f | 38.57 |
| hsa-let-7a | 20.12 |
| hsa-mir-21 | 5.38 |
| hsa-let-7g | 4.87 |
| hsa-let-7b | 3.48 |
| hsa-mir-103 | 2.85 |
| hsa-mir-140-3p (−6.6) | 2.83 |
| hsa-let-7e | 2.38 |
| hsa-mir-31 | 2.33 |
| hsa-mir-29a | 2.06 |
| hsa-let-7d | 1.65 |
| hsa-mir-320a | 1.13 |
| hsa-mir-191 | 1.09 |
| hsa-mir-221 | 0.74 |
| hsa-mir-100 (−117.7) | 0.73 |
| hsa-let-7i (+4.3) | 0.67 |
| hsa-mir-222 | 0.63 |
| hsa-let-7c | 0.52 |
| hsa-mir-107 | 0.52 |
| hsa-mir-152 | 0.52 |
| hsa-mir-181a | 0.48 |
| hsa-mir-30a (+8.1) | 0.39 |
| hsa-mir-101 | 0.38 |
| hsa-mir-423–5p | 0.36 |
| hsa-mir-130a | 0.33 |
| hsa-mir-22 (−7.0) | 0.31 |
| hsa-mir-24 | 0.28 |
| hsa-mir-99b (−2.9) | 0.27 |
| hsa-mir-26a | 0.23 |
| hsa-mir-378 | 0.20 |
miRNAs in bold were aberrantly expressed in clear cell ovarian cancer, and their fold change in cancer vs. normal is in parentheses.
Figure 1.

Expression profiling of miRNAs and genes in human clear cell ovarian cancer cell lines and NOSE cultures. A, Heat map representation of miRNAs overexpressed (yellow) and underexpressed (blue) in clear cell ovarian cancer compared with NOSE (P < 0.01, fold change >2). Rows, miRNAs; columns, Profiled samples. Two candidate oncogenic miRNAs, mir-182 and mir-30a, and two candidate tumor suppressor miRNAs, mir-22 and mir-100, are labeled. B, Heat map representation of transcripts overexpressed (yellow) and underexpressed (blue) in cancer vs. normal (P < 0.01, fold change >2). Rows, Transcripts; columns, Profiled samples. C, Numbers of predicted miRNA-mRNA functional pairs for each algorithm and intersection of algorithms based on anticorrelated expression in clear cell ovarian cancer.
The significant association between clear cell ovarian carcinoma and endometriosis has led to the hypothesis that endometriosis may be a direct precursor lesion for this subtype of ovarian cancer (13,14,15). Hence, we considered the possibility that in addition to NOSE, endometrium may be an appropriate control group for our study. We sequenced the miRNA repertoire of human endometrium and compared it with the miRNA signature of our clear cell lines. Interestingly, we found that 13 of the 21 miRNAs up-regulated and 26 of the 33 miRNAs down-regulated in clear cell ovarian cancer vs. NOSE were significantly misregulated in the same direction when we compared clear cell ovarian cancer with endometrium (supplemental data S1 and S7). Notably, the set of overlapping miRNAs included four miRNAs of particular interest for further analyses: mir-100, mir-22, mir-182, and mir-30a (described below). Thus, using either NOSE or endometrium as our control group provided a similar baseline for the identification of differentially expressed miRNAs in clear cell ovarian cancer.
Genes differentially expressed in clear cell ovarian cancer are predicted targets of altered miRNAs
One mechanism of miRNA-mediated gene silencing is through mRNA destabilization. Therefore, we explored the functional consequences of miRNA alterations in clear cell ovarian cancer by generating gene expression profiles of our clear cell lines and NOSE cultures. There were 1160 genes (1345 probes) up-regulated and 1366 genes (1709 probes) down-regulated in cancer compared with normal (P < 0.01, fold change >2) (Fig. 1B and supplemental data S3). To identify putative miRNA-mRNA functional pairs, we integrated miRNA and mRNA profiles using multiple algorithms for miRNA target prediction, namely TargetScan, PicTar, and miRanda. For genes that were up-regulated in clear cell ovarian cancer compared with NOSE, we searched for targeting miRNAs that were down-regulated, and vice versa. This approach allowed us to focus on interactions that might be especially relevant to our model system. The overall numbers of miRNA up-mRNA down and miRNA down-mRNA up prediction pairs for each algorithm and intersection of algorithms are illustrated in Fig. 1C, with the specific pairs provided as supplemental data (S4 and S5).
mir-100 overexpression represses mTOR and fibroblast growth factor receptor (FGFR)3, and mir-22 overexpression represses other key oncogenes in clear cell ovarian cancer cells
Our bioinformatic analyses resulted in a large collection of putative miRNA-mRNA interactions, leading us to hypothesize that changes in miRNA expression may regulate the gene signature of clear cell ovarian cancer. A subset of up-regulated miRNAs might function as oncogenes by silencing target tumor suppressors, and a subset of down-regulated miRNAs might be tumor suppressors by silencing target oncogenes. According to this hypothesis, if we reverse the expression of candidate oncogenic or tumor suppressor miRNAs in the cancer cell lines, then we should cause a concomitant reversal in the cancer gene signature and partially restore gene expression to a more normal state. These experiments would also help to differentiate functional miRNA-mRNA predictions from those that are purely correlative.
Of the miRNAs that were down-regulated in cancer compared with normal, we selected two candidates to overexpress in our clear cell lines: mir-100 (118-fold decrease) and mir-22 (7-fold decrease). mir-100 was abundant in NOSE cultures and nearly absent in eight of ten clear cell lines, making it the most differentially expressed miRNA. Several groups have found lower levels of mir-100 in ovarian cancer (25,26,27,31), and a recent study reported decreased expression of mir-22 in serous, endometrioid, and clear cell ovarian carcinomas compared with primary NOSE cultures (31). Using miRNA mimics, we overexpressed mir-100 in OVSAYO cells and mir-22 in ES-2 cells. After transfection, we compared gene expression profiles between overexpression cells and cells transfected with a negative control mimic. If down-regulation of these miRNAs was responsible for derepressing and inducing genes in clear cell ovarian cancer, then overexpression of these miRNAs should silence functional targets, including genes that were up-regulated in clear cell ovarian cancer compared with NOSE.
For each miRNA, global differences in gene expression between overexpression and control cells were subtle. Therefore, to test for enrichment of predicted miRNA targets, we used rank-based methods such as Gene Set Enrichment Analysis (GSEA) and the classical Spearman's rank sum statistic, both of which can detect modest but coordinate expression changes in groups of functionally related genes (39,40). For each dataset, we sorted all profiled genes in descending order of fold change in overexpression vs. control (i.e. gene most induced after overexpression at the top and gene most repressed at the bottom). Within this ranked list, we used enrichment analysis to capture the positions of predicted miRNA target genes from miRanda, PicTar, and TargetScan. For each of these gene sets, we determined whether the genes as a group were at or near the top of the ranked list (enrichment), at or near the bottom of the ranked list (antienrichment), or randomly distributed (no enrichment).
Using enrichment analysis, the entire sets of mir-100 and mir-22 target predictions were down-regulated as a group (antienrichment) after mir-100 and mir-22 overexpression, respectively (Fig. 2, A–C). For each miRNA, the subset of predictions that were elevated in clear cell ovarian cancer compared with NOSE were also repressed and significantly antienriched. These enrichment patterns were visually evident by the negative enrichment score curves and the greater density of miRNA target predictions near the bottom vs. the top of the ranked lists. Whereas miRanda, PicTar, and TargetScan each predicted targets that were down-regulated after miRNA overexpression, it was not possible to compare their performance using the described analytical approaches because different numbers of genes were predicted by each algorithm, with more genes providing greater power over fewer genes.
Figure 2.

Enrichment analysis of gene expression profiles after modulation of specific miRNAs in clear cell ovarian cancer cell lines. A, GSEA after mir-100 overexpression in OVSAYO cells. All genes on the microarray were ranked by fold change (overexpression/control), and the GSEA algorithm was used to identify significant patterns in gene sets of interest. For each gene set, vertical bars along the x-axis of the GSEA plot represent the positions of genes within the ranked list (i.e. their fold change). Negative GSEA enrichment score curve indicates antienrichment (down-regulation), and positive curve denotes enrichment (up-regulation). NES, Normalized enrichment score. Because there were very few genes overexpressed in clear cell ovarian cancer (OvCa up) that were also predicted targets of mir-100, we performed GSEA on all mir-100 target predictions by miRanda (green), PicTar (blue), or TargetScan (red), regardless of their expression pattern in ovarian cancer. B, GSEA after mir-22 overexpression in ES-2 cells to examine OvCa up genes that were also predicted mir-22 targets by PicTar or TargetScan. There were no mir-22 targets predicted by miRanda (September 2008 release, MIMAT0000077). C, Spearman's rank sum analysis after overexpression of mir-100 (top) or mir-22 (bottom). For each miRNA, the gene sets of interest included all predicted targets by miRanda, PicTar, or TargetScan; all genes overexpressed (OvCa up) or underexpressed (OvCa down) in clear cell ovarian cancer; and OvCa up genes that were also predicted miRNA targets by miRanda, PicTar, or TargetScan. Numbers of genes in each set are indicated in parentheses. Negative rank sum statistic indicates antienrichment (down-regulation), and positive statistic denotes enrichment (up-regulation). Colors correspond to the sets analyzed by GSEA in panels A and B. D, GSEA after knockdown of mir-182 in ES-2 cells to examine OvCa down genes that were also predicted mir-182 targets. E, GSEA after knockdown of mir-30a in OVSAYO cells. F, Spearman's rank sum analysis after knockdown of mir-182 (top) or mir-30a (bottom). Gene sets of interest were similar to panel C but instead included OvCa down genes that were also predicted miRNA targets. Colors correspond to the sets analyzed by GSEA in panels E and F. Two-sided significance levels: *, P < 0.05; **, P < 0.01; ***, P < 0.001; ****, P < 0.0001. ctrl, Control; expt, experimental.
Of the 1160 genes overexpressed in clear cell ovarian cancer, those predicted to be targeted by mir-100 and mir-22 are listed in Tables 2 and 3, respectively. Overexpression of mir-100 down-regulated nine of 14 putative targets, whereas overexpression of mir-22 down-regulated 22 of 27 target predictions. Several of these interactions were independently validated by quantitative real-time PCR (QPCR). In support of our hypothesis that mir-100 and mir-22 are tumor suppressors in clear cell ovarian cancer, we confirmed significant down-regulation of multiple target oncogenes after miRNA overexpression, including the mir-100 targets FRAP1/mTOR and FGFR3 (Fig. 3A), and the mir-22 targets ARRB1, CLIP2, EVI1, and FRAT2 (Fig. 3B). Interestingly, we also found repression of the mir-100 target EIF2C2/AGO2 and the mir-22 target EDC3, two components of the miRNA machinery that were overexpressed in clear cell ovarian cancer. It was important that we included the mock transfection group during QPCR validation because in rare instances we observed unexpected effects after treatment with negative control mimic, specifically, increased FGFR3 and decreased EIF2C2/AGO2. Of all the predicted mir-100 or mir-22 target predictions that were overexpressed in clear cell ovarian cancer, EIF2C2/AGO2 was the only gene also predicted to be silenced by the negative control mimic based on its seed sequence, in agreement with our findings.
Table 2.
All mir-100 predicted target genes that were overexpressed in clear cell ovarian cancer
| Gene | Description | Microarray fold change (clear cell vs. NOSE) | Microarray fold change (mir-100 overexpression) | Algorithm |
|---|---|---|---|---|
| FGFR3 | Fibroblast growth factor receptor 3 | +13.10 | −2.62 | T, P, M |
| FRAP1/mTORa | FK506-binding protein 12-rapamycin associated protein 1 | +1.92 | −1.85 | T, P, M |
| CTDSPL | CTD (carboxy-terminal domain, RNA polymerase II, polypeptide A) small phosphatase-like | +3.86 | −1.62 | T, P, M |
| TRIB1 | Tribbles homolog 1 (Drosophila) | +3.47 | −1.28 | T |
| CMTM6 | CKLF-like MARVEL transmembrane domain containing 6 | +3.12 | −1.15 | M |
| HLTF | Helicase-like transcription factor | +2.09 | −1.12 | M |
| EIF2C2/AGO2 | Eukaryotic translation initiation factor 2C, 2 | +3.29 | −1.07 | T, P, M |
| IMPDH1 | IMP (inosine monophosphate) dehydrogenase 1 | +2.31 | −1.07 | M |
| RAVER2 | Ribonucleoprotein, PTB-binding 2 | +2.44 | −1.06 | T, P, M |
| CCDC21 | Coiled-coil domain containing 21 | +2.30 | +1.04 | T |
| KAZALD1 | Kazal-type serine peptidase inhibitor domain 1 | +4.32 | +1.06 | M |
| E2F2 | E2F transcription factor 2 | +6.76 | +1.07 | M |
| CDC25A | Cell division cycle 25 homolog A (S. pombe) | +3.06 | +1.61 | M |
| PLAGL2 | Pleiomorphic adenoma gene-like 2 | +3.82 | +1.63 | M |
Nine of 14 genes were down-regulated after mir-100 overexpression. Prediction algorithms: T, TargetScan; P, PicTar; M, miRanda.
Although FRAP1/mTOR was less than 2-fold up-regulated in clear cell vs. NOSE, it was included in our analysis based on previous work validating the gene as a bona fide mir-100 target (44).
Table 3.
All mir-22 predicted target genes that were overexpressed in clear cell ovarian cancer
| Gene | Description | Microarray fold change (clear cell vs. NOSE) | Microarray fold change (mir-22 overexpression) | Algorithm |
|---|---|---|---|---|
| EDC3 | Enhancer of mRNA decapping 3 homolog (S. cerevisiae) | +2.03 | −2.22 | T, P |
| FRAT2 | Frequently rearranged in advanced T-cell lymphomas 2 | +3.23 | −1.70 | T |
| EVI1 | Ecotropic viral integration site 1 | +22.41 | −1.59 | T |
| ARID3B | AT-rich interactive domain 3B (BRIGHT-like) | +4.17 | −1.58 | T, P |
| CHD7 | Chromodomain helicase DNA-binding protein 7 | +2.35 | −1.58 | T, P |
| CLIP2 | CAP-GLY domain containing linker protein 2 | +2.64 | −1.48 | P |
| AGBL5 | ATP/GTP binding protein-like 5 | +2.09 | −1.44 | T, P |
| FBX046 | F-box protein 46 | +2.23 | −1.43 | T |
| ZCCHC14 | Zinc finger, CCHC domain containing 14 | +2.14 | −1.42 | T |
| PDSS1 | Prenyl (decaprenyl) diphosphate synthase, subunit 1 | +2.05 | −1.40 | T |
| FAM125B | Family with sequence similarity 125, member B | +2.55 | −1.37 | T |
| BIN1 | Bridging integrator 1 | +4.75 | −1.26 | P |
| CYTH3 | Cytohesin 3 | +2.12 | −1.26 | T, P |
| MTHFD2 | Methylenetetrahydrofolate dehydrogenase (NADP+ dependent) 2, methenyltetrahydrofolate cyclohydrolase | +4.34 | −1.25 | T, P |
| POGK | Pogo-transposable element with KRAB domain | +2.41 | −1.19 | T, P |
| CCDC47 | Coiled-coil domain containing 47 | +2.07 | −1.18 | T, P |
| MYST3 | MYST histone acetyltransferase (monocytic leukemia) 3 | +2.09 | −1.17 | T |
| ARRB1 | Arrestin, β 1 | +2.25 | −1.09 | T |
| RGS14 | Regulator of G protein signaling 14 | +2.09 | −1.09 | T |
| ACVR1B | Activin A receptor, type IB | +4.37 | −1.07 | T |
| ZNF618 | Zinc finger protein 618 | +2.59 | −1.06 | T |
| PPP1R9A | Protein phosphatase 1, regulatory (inhibitor) subunit 9A | +2.40 | −1.05 | T |
| MPHOSPH9 | M-phase phosphoprotein 9 | +2.35 | 1.00 | P |
| ANKRD57 | Ankyrin repeat domain 57 | +3.21 | +1.02 | P |
| ERBB3 | v-erb-b2 Erythroblastic leukemia viral oncogene homolog 3 (avian) | +13.27 | +1.08 | T, P |
| PLAGL2 | Pleiomorphic adenoma gene-like 2 | +3.82 | +1.11 | T, P |
| IGF2BP3 | IGF 2 mRNA-binding protein 3 | +8.48 | +1.19 | P |
Of 27 genes, 22 were down-regulated after mir-22 overexpression. Prediction algorithms: T, TargetScan; P, PicTar; M, miRanda.
Figure 3.

QPCR analysis of predicted target genes after miRNA overexpression. A, Relative quantity (RQ) of mir-100 predicted targets after mir-100 overexpression in OVSAYO cells. For each gene, groups not connected by the same letter are significantly different (P < 0.05). B, Levels of mir-22-predicted targets after mir-22 overexpression in ES-2 cells.
mir-100 inhibits mTOR signaling and enhances sensitivity to RAD001
Because of the quantitative nature of this work, our experiments focused on changes in mRNA expression after miRNA modulation. Studies from the Bartel and Rajewsky laboratories (41,42) have shown that, in parallel with mRNA destabilization, miRNAs regulate widespread repression of protein translation. To confirm mir-100 regulation of mTOR, we used a lentiviral system to overexpress mir-100 in OVSAYO cells and observed decreased mTOR protein levels as compared with cells transduced with a negative control vector or mock transduced cells (Fig. 4A). Furthermore, we observed decreased levels of the phosphorylated isoforms of 4EBP1 and p70 S6 kinase, two direct substrates of mTOR kinase activity that mediate mTOR signaling (Fig. 4A). Thus, mir-100 represses mTOR mRNA and protein levels and inhibits the mTOR pathway in clear cell ovarian cancer cells.
Figure 4.
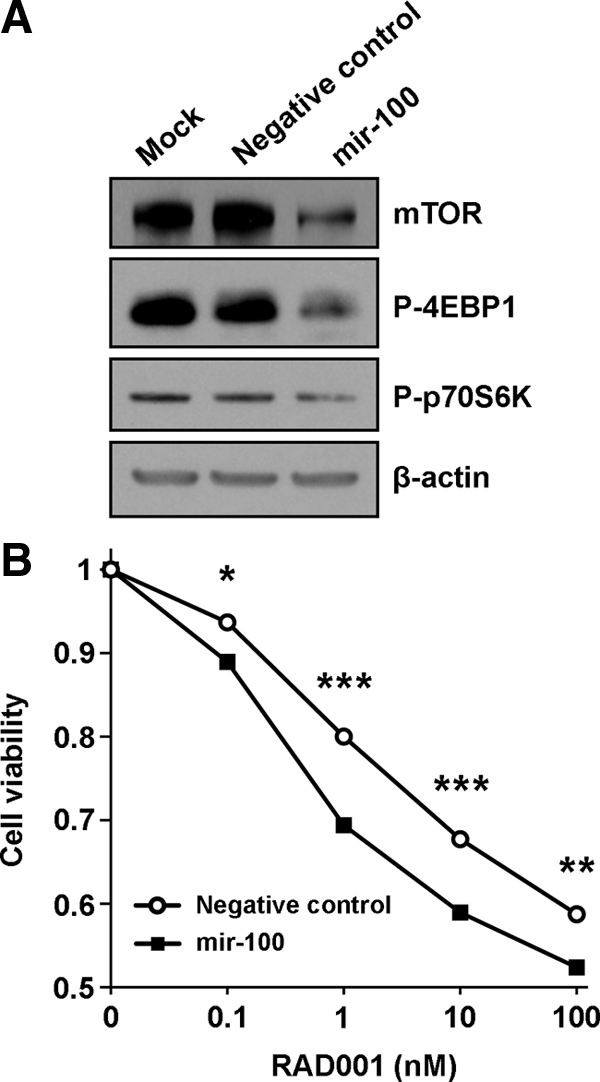
Effect of mir-100 on mTOR signaling and RAD001 sensitivity in clear cell ovarian cancer cells. A, Protein levels of mTOR and phosphorylated isoforms of 4EBP1 and p70 S6 kinase were examined by Western blot on OVSAYO cell lysates after transduction of a lentiviral vector expressing mir-100 or a nontargeting sequence (negative control). β-actin levels served as a loading control. B, Viability of OVSAYO cells treated with varying concentrations of RAD001 after stable transduction with mir-100 or a negative control vector. Student's t test: *, P < 0.001; **, P < 0.0001; ***, P < 0.00001.
To determine the physiological significance of these alterations, we examined the effect of mir-100 on ovarian cancer cell viability in vitro. Under normal steady-state culture conditions, there was no difference in viability between OVSAYO cells stably transduced with mir-100 or a negative control vector (data not shown). However, addition of the mTOR inhibitor RAD001 (everolimus) to the culture media revealed the potent biological effect of mir-100. RAD001 is a rapamycin analog that has recently been shown to decrease tumor burden in a xenograft model of clear cell ovarian cancer (21). OVSAYO cells expressing mir-100 were significantly more vulnerable to RAD001 across a wide range of concentrations (Fig. 4B). Hence, our experiments indicate that by repressing the mTOR pathway, mir-100 potentiates the chemotherapeutic effect of RAD001 on clear cell ovarian cancer cells.
Knockdown of mir-182 and mir-30a induces predicted gene targets
In a complementary fashion, we tested the hypothesis that higher expression of specific miRNAs contributes to the clear cell ovarian cancer gene signature. Of the miRNAs that were up-regulated in clear cell ovarian cancer compared with NOSE, we selected two candidates to knockdown in our clear cell lines: mir-182 (8.6-fold increase) and mir-30a (8.1-fold increase). Previous studies have identified higher levels of these miRNAs or their seed-matched family members in ovarian cancer compared with primary NOSE cultures (31) and immortalized OSE cultures (28). We used miRNA hairpin inhibitors to knock down the activity of mir-182 in ES-2 cells and mir-30a in OVSAYO cells and then compared their gene expression profiles to cells transfected with a negative control inhibitor. If up-regulation of these miRNAs was responsible for silencing genes in clear cell ovarian cancer, then knockdown of these miRNAs should derepress and induce expression of bona fide miRNA targets, including genes that were down-regulated in cancer compared with NOSE.
By GSEA, we found that mir-182 knockdown caused up-regulation of mir-182-predicted targets that were underexpressed in clear cell ovarian cancer, no matter whether the targets were defined using miRanda, PicTar, or TargetScan (Fig. 2D and Table 4). Similarly, mir-30a knockdown induced mir-30a presumptive targets that were down-regulated in cancer, although in this case TargetScan predictions showed the best enrichment (Fig. 2E and Table 5). Using Spearman's rank sum statistic to analyze the knockdown results, we again observed significant enrichment for mir-182 and mir-30a predicted targets that were underexpressed in clear cell ovarian cancer (Fig. 2F). Furthermore, we found that the entire sets of mir-182 and mir-30a presumptive target genes, regardless of their expression patterns in cancer compared with normal, were also enriched after knockdown of mir-182 and mir-30a, respectively (Fig. 2F).
Table 4.
Top 25 mir-182 predicted target genes that were underexpressed in clear cell ovarian cancer and up-regulated after mir-182 knockdown
| Gene | Description | Microarray fold change (clear cell vs. NOSE) | Microarray fold change (mir-182 knockdown) | Algorithm |
|---|---|---|---|---|
| CAMSAP1L1 | Calmodulin regulated spectrin-associated protein 1-like 1 | −2.19 | +1.15 | T, P, M |
| SNAP23 | Synaptosomal-associated protein, 23 kDa | −4.36 | +1.14 | T, P, M |
| SP3 | Sp3 transcription factor | −2.07 | +1.14 | T, P, M |
| CD164 | CD164 molecule, sialomucin | −3.03 | +1.13 | T |
| ATXN1 | Ataxin 1 | −4.98 | +1.12 | T, P, M |
| PLCG1 | Phospholipase C, γ 1 | −2.44 | +1.12 | T, P |
| NAMPT | Nicotinamide phosphoribosyltransferase | −5.11 | +1.11 | T, P, M |
| BNC2 | Basonuclin 2 | −3.22 | +1.11 | T, P, M |
| EIF5A2 | Eukaryotic translation initiation factor 5A2 | −2.84 | +1.11 | T, P, M |
| ZHX1 | Zinc fingers and homeoboxes 1 | −2.16 | +1.11 | T, P |
| EFNB2 | Ephrin-B2 | −4.16 | +1.10 | T, P, M |
| ACVR1 | Activin A receptor, type I | −2.32 | +1.10 | T, P, M |
| EVI5 | Ecotropic viral integration site 5 | −2.21 | +1.10 | T, P, M |
| PLOD2 | Procollagen-lysine, 2-oxoglutarate 5-dioxygenase 2 | −26.14 | +1.09 | T, P |
| MBNL2 | Muscleblind-like 2 (Drosophila) | −4.41 | +1.09 | T, P, M |
| SEPT7 | Septin 7 | −3.28 | +1.09 | T, P |
| DCUN1D4 | DCN1, defective in cullin neddylation 1, domain containing 4 (S. cerevisiae) | −2.94 | +1.09 | T, P, M |
| AHR | Aryl hydrocarbon receptor | −2.54 | +1.09 | T |
| SMAD7 | SMAD family member 7 | −2.34 | +1.09 | T, P |
| YWHAG | Tyrosine 3-monooxygenase/tryptophan 5-monooxygenase activation protein, γ polypeptide | −3.59 | +1.08 | T, P, M |
| SBDS | Shwachman-Bodian-Diamond syndrome | −3.20 | +1.08 | T |
| ABL2 | v-abl Abelson murine leukemia viral oncogene homolog 2 | −2.69 | +1.08 | T |
| ADAM10 | ADAM metallopeptidase domain 10 | −2.31 | +1.08 | T, P, M |
| PDGFRA | Platelet-derived growth factor receptor, α polypeptide | −13.38 | +1.07 | T, P, M |
| GPRASP2 | G protein-coupled receptor associated sorting protein 2 | −2.14 | +1.07 | T, P, M |
The table lists only those targets that were at least predicted by TargetScan. Prediction algorithms: T, TargetScan; P, PicTar; M, miRanda.
Table 5.
Top 25 mir-30a predicted target genes that were underexpressed in clear cell ovarian cancer and up-regulated after mir-30a knockdown
| Gene | Description | Microarray fold change (clear cell vs. NOSE) | Microarray fold change (mir-30a knockdown) | Algorithm |
|---|---|---|---|---|
| AVEN | Apoptosis, caspase activation inhibitor | −3.01 | +1.19 | T |
| DEXI | Dexamethasone-induced transcript | −2.26 | +1.18 | T, P |
| SCAMP1 | Secretory carrier membrane protein 1 | −2.45 | +1.17 | T, M |
| GALNT1 | UDP-N-acetyl-α-d-galactosamine:polypeptide N-acetylgalactosaminyltransferase 1 (GalNAc-T1) | −2.42 | +1.16 | T, P, M |
| GJA1 | Gap junction protein, α 1, 43 kDa | −7.59 | +1.15 | T, P, M |
| ACVR1 | Activin A receptor, type I | −2.32 | +1.15 | T, P, M |
| P4HA2 | Prolyl 4-hydroxylase, α polypeptide II | −5.34 | +1.14 | T, P, M |
| MARCKS | Myristoylated alanine-rich protein kinase C substrate | −7.93 | +1.13 | T, P |
| MBNL2 | Muscleblind-like 2 (Drosophila) | −4.41 | +1.13 | T, M |
| DACT1 | Dapper, antagonist of β-catenin, homolog 1 (Xenopus laevis) | −2.72 | +1.13 | T, M |
| EXTL2 | Exostoses (multiple)-like 2 | −2.48 | +1.12 | T, P, M |
| MXRA5 | Matrix-remodeling associated 5 | −18.47 | +1.11 | T |
| PDE5A | Phosphodiesterase 5A, cGMP-specific | −13.27 | +1.11 | T |
| ATXN1 | Ataxin 1 | −4.98 | +1.11 | T, P, M |
| FKBP3 | FK506 binding protein 3, 25 kDa | −2.47 | +1.11 | T, M |
| SSR3 | Signal sequence receptor, γ (translocon-associated protein γ) | −2.35 | +1.11 | T, M |
| DSTYK | Dual serine/threonine and tyrosine protein kinase | −2.31 | +1.11 | T, P |
| S100PBP | S100P-binding protein | −2.11 | +1.11 | T, M |
| C14orf129 | Chromosome 14 open reading frame 129 | −2.01 | +1.11 | T, M |
| NTNG1 | Netrin G1 | −6.37 | +1.10 | T, M |
| BNC1 | Basonuclin 1 | −3.91 | +1.10 | T, P, M |
| FRMD4A | FERM domain containing 4A | −2.47 | +1.10 | T |
| NT5E | 5′-Nucleotidase, ecto (CD73) | −2.39 | +1.10 | T |
| SEC23A | Sec23 homolog A (S. cerevisiae) | −2.03 | +1.10 | T, P, M |
| CALD1 | Caldesmon 1 | −6.46 | +1.09 | T, M |
The table lists only those targets that were at least predicted by TargetScan. Prediction algorithms: T, TargetScan; P, PicTar; M, miRanda.
mir-22 overexpression and mir-182 knockdown shift the global gene expression pattern of clear cell ovarian cancer toward a more normal state
Using enrichment analysis, we also investigated the global effects of specific miRNAs on the clear cell ovarian cancer gene signature. Surprisingly, the complete set of 1366 genes down-regulated in clear cell ovarian cancer compared with NOSE was significantly enriched and up-regulated after overexpressing mir-22 (Fig. 2C) or inhibiting the activity of either mir-182 or mir-30a (Fig. 2F), irrespective of whether these genes were predicted targets. Although mir-100 overexpression and mir-30a knockdown up-regulated the group of 1160 genes already overexpressed in cancer vs. normal, mir-22 overexpression and mir-182 knockdown caused significant antienrichment and down-regulation of this gene set. Thus, mir-22 overexpression and mir-182 knockdown attenuated the global gene signature of clear cell ovarian cancer, both through direct effects on predicted targets and widespread secondary effects on nontarget genes that are aberrantly expressed.
Discussion
In the present study, we identified putative oncogenic and tumor suppressor miRNAs in human clear cell ovarian cancer, the subtype with the worst advanced stage prognosis. We used next-generation sequencing technology to comprehensively profile miRNA expression in a broad spectrum of clear cell ovarian cancer cell lines. Although there is no perfect control group for ovarian cancer profiling studies (43), there are considerable drawbacks to using either whole ovary (e.g. contamination from other cell types) or immortalized OSE cultures (e.g. artifacts from immortalization). Selecting an appropriate baseline is further complicated by evidence of a strong association between endometriosis and ovarian carcinomas of the clear cell and endometrioid subtypes (13,14,15). In one meta-analysis, approximately 30% of clear cell ovarian cancers demonstrated concurrent endometriosis in the same ovary (13). The pathological basis for this correlation remains unknown, although several hypotheses have been proposed. In some cases, foci of endometriosis may directly develop into clear cell ovarian carcinoma; histological proof of this transition has been reported, albeit rarely, perhaps because it is difficult to capture (13,14,15). Another potential scenario is that the presence of ovarian endometriosis may create a microenvironment that fosters the malignant transformation of OSE cells (15). It is also conceivable that endometriosis and clear cell ovarian cancers develop as independent lesions that coexist because of shared risk factors or common mechanisms of pathogenesis (13,14,15). To account for the possibility that clear cell ovarian carcinomas may arise from OSE cells or from endometriosis, we compared clear cell ovarian cancer cell lines both to short-term primary cultures of human NOSE and to human endometrium.
Of the 54 miRNAs that were aberrantly expressed in clear cell ovarian cancer vs. NOSE, 39 miRNAs were misregulated in the same direction when we compared clear cell ovarian cancer to endometrium, demonstrating that these two control groups provided a similar baseline for comparison. Many of these miRNAs had predicted gene targets with anticorrelated expression patterns, including two potential tumor suppressors (mir-100, mir-22) that were down-regulated in cancer and two potential oncogenes (mir-182, mir-30a) that were up-regulated. Despite the characterization of several gene targets for these miRNAs in other model systems, and the broad evidence implicating these miRNAs in ovarian cancer, no strong candidate target genes in ovarian cancer had been identified until now. We found that overexpression of mir-100 and mir-22 caused antienrichment (down-regulation) of predicted targets that were overexpressed in clear cell ovarian cancer. On the other hand, knockdown of mir-182 and mir-30a caused enrichment (up-regulation) of predicted targets that were underexpressed in clear cell ovarian cancer.
The PI3K/AKT signaling pathway regulates survival, proliferation, and growth in multiple tissue types including the ovary and is frequently activated in clear cell ovarian carcinoma. Among the myriad downstream effectors of PI3K/AKT, FRAP1/mTOR is a serine/threonine kinase that regulates protein synthesis and cell growth (16). In concordance with previous work demonstrating that mTOR is a bona fide target of mir-100 (44), we found that up-regulating mir-100 activity inhibited mTOR signaling in clear cell ovarian cancer, as evidenced by lower mTOR mRNA and protein levels and reductions in the phosphorylated isoforms of the mTOR substrates 4EBP1 and p70 S6 kinase. The functional consequence of this repression was enhanced sensitivity of mir-100-expressing clear cell ovarian cancer cells to the rapamycin analog RAD001 (everolimus). RAD001 is an mTOR inhibitor that has recently been shown to decrease tumor growth in a xenograft model of clear cell ovarian cancer (21). In agreement with evidence suggesting that cisplatin resistance in clear cell ovarian cancer cells correlates with increased activation of AKT and mTOR, RAD001 efficacy was greater in cisplatin-resistant than cisplatin-sensitive disease (21). Whether the same pattern holds true for combined treatment with RAD001 and mir-100 remains to be determined. It is tempting to speculate that the loss of mir-100 in clear cell ovarian cancer may contribute to cisplatin resistance by relieving inhibition of mTOR signaling. Indeed, mir-100 was abundant in NOSE cultures and nearly absent in eight of 10 clear cell lines, making it the most differentially expressed miRNA with an overall 118-fold decrease.
In addition to mTOR regulation, mir-100 overexpression repressed FGFR3 levels. No roles for FGFR3 have previously been described in ovarian cancer, although FGFR3 activation has protumor activity in bladder carcinoma and multiple myeloma (45). Interestingly, FGFR signaling induces recruitment and activation of PI3K (46), suggesting that mir-100 may exert tumor suppressor activity through the coordinated repression of multiple components of the PI3K/AKT/mTOR signaling pathway.
The mir-22 primary transcript is located in the 5′- untranslated region of an open reading frame (C17orf91) on chromosome 17p13.3, and its expression is driven by the promoter for this gene (47). This locus has been defined as a minimal region of loss of heterozygosity in hepatocellular carcinoma (48), and reduced mir-22 expression secondary to loss of 17p has been reported in multiple myeloma (49). The MYC oncogene represses mir-22 expression in immortalized B cells, and overexpression of mir-22 decreased the growth of lymphoma cells in a xenograft mouse model (47). Despite these multiple lines of evidence identifying mir-22 as a candidate tumor suppressor, the only previously described mir-22 targets are ESR1 in breast cancer cells (50) and BMP7 and PPARA in chondrocytes (51).
We observed a 7-fold decrease in mir-22 expression in clear cell ovarian cancer, in part explained by the 4-fold decline in C17orf91 levels. Overexpression of mir-22 repressed multiple target oncogenes that were higher in clear cell vs. normal, including ARRB1, CLIP2, FRAT2, and EVI1. ARRB1 promotes invasion and metastasis of ovarian cancer cells by activating β-catenin signaling downstream of endothelin receptor type A (52). CLIP2 is a cytoplasmic linker protein that is amplified in colorectal carcinoma and glioblastoma (53,54), and FRAT2 is an activator of canonical WNT signaling that is up-regulated in gastric cancer (55).
The mir-22 target EVI1 is a zinc finger transcription factor involved in myeloid leukemia and myelodysplastic syndrome (56), consistent with the link between mir-22 and hematopoietic malignancies. Previous studies have detected amplification of the EVI1 locus (3q26.2) in ovarian cancers (57,58), and we observed 22.4-fold up-regulation of EVI1 in our clear cell lines, an expression level possibly exacerbated by loss of mir-22. High EVI1 expression correlates with poor prognosis in patients with advanced stage serous ovarian carcinoma (58). Accordingly, EVI1 overexpression enhanced the proliferation and motility of immortalized OSE cells, with similar effects in ovarian cancer cells (58). These effects may be due, in part, to loss of TGF-β responsiveness, as EVI1 represses TGF-β signaling by inhibiting SMAD family member 3 (59). Furthermore, EVI1 suppresses apoptosis by stimulating PI3K/AKT signaling (60). Thus, as illustrated in Fig. 5, both mir-100 and mir-22 are candidate tumor suppressor miRNAs in clear cell ovarian cancer that influence PI3K/AKT/mTOR signaling through direct and indirect effects at multiple points in the pathway.
Figure 5.

mir-100 and mir-22 target known oncogenes that influence the PI3K/AKT/mTOR pathway. PI3K is comprised of the p85 regulatory subunit (PIK3R1) and the p110 catalytic subunit (PIK3CA). PI3K activation leads to the synthesis of the second messenger PIP3, which recruits AKT to the cell membrane for subsequent phosphorylation and activation. AKT activation has multiple biological consequences including the regulation of cell growth, proliferation, and survival by activating a key downstream effector, the serine/threonine kinase mTOR. The PI3K/AKT/mTOR pathway is frequently activated in clear cell ovarian cancer, usually secondary to gain of function mutations in PIK3CA. We found that mTOR was up-regulated in clear cell ovarian cancer cell lines and repressed by mir-100 on the mRNA and protein levels. mir-100 overexpression also decreased levels of the phosphorylated isoforms of 4EBP1 and p70 S6 kinase, two direct substrates of mTOR kinase activity that mediate mTOR signaling. Two other target oncogenes that were overexpressed in clear cell ovarian cancer also impinge on this pathway. Signaling through FGFRs, such as the mir-100 target FGFR3, induces recruitment and activation of PI3K, and the mir-22 target EVI1 promotes cell survival by stimulating PI3K/AKT signaling. Thus, mir-100 and mir-22 exert tumor suppressor activity through the coordinated repression of multiple components of the PI3K/AKT/mTOR pathway.
Two effectors of miRNA-mediated silencing were also up-regulated in clear cell ovarian cancer, namely the mir-100 responsive target EIF2C2/AGO2 and the mir-22 responsive target EDC3. AGO2 is a core protein of the RNA-induced silencing complex that catalyzes mRNA cleavage and translational repression (61), and previous work has demonstrated amplification of the AGO2 locus in serous ovarian carcinoma (62). EDC3 functions as a scaffold for P-body assembly and enhancer of decapping that promotes mRNA decay (63,64). Except for a 2.1-fold decrease in DICER1 levels, we did not observe significant changes in other components of the miRNA machinery (e.g. RNASEN/DROSHA, DGCR8, TARBP2, and XPO5), making it challenging to predict the overall impact on miRNA function. One study found that low DICER1 expression was an independent predictor of shorter survival in patients with ovarian carcinoma (65). However, whether DICER1 is a robust prognostic factor remains uncertain because other groups have reported a lack of correlation with patient outcome (66).
The mir-182 locus is amplified in ovarian cancer, and overexpression of mir-182 in an ovarian cancer cell line reportedly enhanced tumor growth in vivo (66). Overexpression of mir-182 also promotes melanoma metastasis by directly repressing the transcription factors FOXO3 and MITF (67). Neither of these genes was down-regulated in clear cell ovarian cancer, highlighting the fact that functional miRNA-mRNA interactions are tissue-specific.
Although mir-30 family members are elevated in serous, endometrioid, and clear cell ovarian carcinomas compared with NOSE, it was reported that expression in the clear cell subtype is highest overall (31). Two noteworthy mir-30a-responsive target genes that emerged from our experiments are AVEN and GALNT1. Whereas AVEN is traditionally known as an apoptotic inhibitor, recent evidence indicates that AVEN also impedes cell cycle progression at the G2/M checkpoint by activating ataxia telangiectasia mutated (ATM) in response to DNA damage (68). These data suggest that AVEN has the dual potential to be an oncogene or tumor suppressor, the latter function consistent with its underexpression in clear cell ovarian cancer and up-regulation after mir-30a knockdown. GALNT1 is a glycosyltransferase that initiates O-linked glycosylation in the Golgi apparatus. Single-nucleotide polymorphisms in GALNT1 are associated with the risk of ovarian cancer (69), in agreement with data indicating altered glycosylation of proteins in ovarian cancer (70).
One of our most compelling findings was that reversing the expression of mir-22 (overexpression) or mir-182 (knockdown) in the clear cell cultures caused a global shift in the cancer gene signature such that genes overexpressed in clear cell ovarian cancer (OvCa up) were down-regulated, and genes underexpressed in clear cell ovarian cancer (OvCa down) were up-regulated, regardless of whether the genes were predicted to be direct targets of these miRNAs. Knockdown of mir-30a caused up-regulation of OvCa down genes, but also further up-regulated OvCa up genes, similar to the effects of mir-100 overexpression. Hence, the capacity to drive the gene signature of clear cell ovarian cancer toward a more normal state is not a universal phenomenon but instead a function restricted to specific miRNAs. So far we have tested a handful of the 54 miRNAs that were differentially expressed, and there may be other miRNAs with similar effects. In the future, it will be critical to determine whether combined modulation of mir-22 and mir-182, as well as other miRNAs altered in clear cell ovarian cancer, will be even more effective in reversing the gene signature and phenotype of cancer cells to a more normal state.
In conclusion, our experiments have revealed strong candidate oncogenic and tumor suppressor miRNAs and their target genes in human clear cell ovarian cancer. In particular, mir-22 and mir-182 are influential nodes with global control over the cancer gene signature. These miRNAs may be ideal targets for the development of novel therapies or as sensitizing agents for existing chemotherapy regimens and small molecule drugs. The latter notion is especially tangible considering that several miRNA-regulated genes uncovered in our study are linked to activation of PI3K/AKT/mTOR signaling, a pathway for which multiple small molecule inhibitors are currently available or in clinical trials (71). The novel finding that FGFR3 is overexpressed in clear cell ovarian cancer and is regulated by mir-100 likewise holds promise for combined therapy in light of recent work demonstrating that antibody-based targeting of FGFR3 has potent antitumor activity (45).
Materials and Methods
Primary culture of human NOSE cells
Permission to perform all experiments was obtained from the Institutional Review Board for Baylor College of Medicine and its affiliated institutions (H-15188, H-22124, H-22119). After obtaining informed consent from each study participant, primary cultures of NOSE were grown and expanded as previously described (72). Briefly, brushings of the ovarian surface were performed in pre- and postmenopausal women undergoing clinically indicated surgery. Women with evidence of endometriosis, cancer, or inflammatory conditions at the time of surgery were excluded from participation. Cells were cultured in 1:1 MCDB105/M199 (Sigma Chemical Co., St. Louis, MO) with 10% heat-inactivated fetal bovine serum, 1% penicillin-streptomycin solution (Invitrogen, Carlsbad, CA), and 5 ng/ml epidermal growth factor (Invitrogen). The epithelial origin of cultured cells was confirmed using immunohistochemistry to examine the expression of vimentin and cytokeratins. Only cultures containing more than 90% epithelial cells were used.
Clear cell ovarian cancer cell lines
ES-2a and TOV-21Gb were obtained from the American Type Culture Collection (Manassas, VA). RMG-Ic (73) and OVMANAd (74) were obtained from the Health Science Research Resources Bank. The other cell lines were kindly provided as follows: OVISEd (75), OVASd (76), OVTOKOd (75), and OVSAYOd (74) from Dr. Hiroshi Minaguchi (Yokohama City University, Yokohama, Japan); KKd (77,78) from Dr. Yoshihiro Kikuchi (National Defense Medical College, Tokorozawa, Japan); and SMOV-2d (79) from Dr. Tomohiro Iida (St. Marianna University, Kawasaki, Japan). Cells were cultured in aDMEM/F12 (Invitrogen), b1:1 MCDB105/M199 (Sigma), cHam's F-12 (Invitrogen), or dRPMI 1640 (Invitrogen) with 10% heat-inactivated fetal bovine serum and 1% penicillin-streptomycin solution (Invitrogen).
Gene expression profiling and small RNA sequencing
Total RNA was extracted from human NOSE cultures (n = 6) and clear cell ovarian cancer cell lines (n = 10) using the mirVana miRNA Isolation Kit (Applied Biosystems, Foster City, CA). RNA quality and the presence of small RNAs were inspected on a 2100 Bioanalyzer (Agilent Technologies, Palo Alto, CA). Gene expression profiles were generated on HumanWG-6 version 3.0 BeadChips (Illumina) at Texas Children's Cancer Center Genomics and Proteomics Core Laboratory. The array platform consists of 48,803 transcript probes representing 24,384 unique named genes. Expression data were quantile normalized by applying a monotone linear spline to each array that mapped quantiles 0.01 to 0.99 in increments of 0.01 exactly to the corresponding quantiles of the standard using software kindly provided by Kerby Shedden (University of Michigan). All array datasets described in this study have been deposited into the Gene Expression Omnibus (GEO accession number GSE16574).
Small RNA library construction was performed using the DGE-Small RNA Sample Prep Kit (Illumina) (n = 4 NOSE cultures; n =10 clear cell lines). Purified cDNA was quantified with the Quant-iT PicoGreen dsDNA Kit (Invitrogen) and diluted to 3 pm for sequencing on the Illumina 1G Genome Analyzer (University of Houston). The raw sequence data were passed through a series of quality-control filters to discard reads without a 3′-adapter, reads with copy number less than 4, reads that were less than 10 nucleotides, and reads with more than 10 consecutive identical nucleotides. The remaining usable sequence reads were aligned to human miRNA hairpin precursor sequences in miRBase (release 11.0; http://microrna.sanger.ac.uk/) (80), with up to three mismatches tolerated in an alignment. If a read aligned equally well to multiple precursors, its copy number was equally apportioned. For each mature miRNA sequence, we counted the number of reads that were exact matches, allowing a four-nucleotide extension into the precursor sequence on each side of the mature miRNA. Each miRNA profile was scale normalized using the total number of usable sequence reads after which 40 units were added to each miRNA expression value.
Differentially expressed genes and miRNAs were identified by t test on log-transformed data and fold change (ratio of averages of clear cell ovarian cancer compared with NOSE).
Prediction of miRNA-mRNA functional interactions
miRNAs predicted to target differentially expressed mRNAs were identified using TargetScanHuman (release 5.0; http://www.targetscan.org/) (81), PicTar (http://pictar.mdc-berlin.de/) (82), and miRanda (September 2008; http://www.microrna.org/) (83). For mRNAs that were up-regulated in clear cell ovarian cancer compared with NOSE, we searched for targeting miRNAs that were down-regulated, and vice versa. Retrieval of putative miRNA-mRNA pairs was facilitated by SigTerms software (http://sigterms.sourceforge.net/) (84).
miRNA knockdown and overexpression
Transfection conditions for each clear cell ovarian cancer cell line were optimized for maximum efficiency in preliminary experiments using Dy547-labeled miRIDIAN hairpin inhibitor and mimic transfection controls (Dharmacon, Lafayette, CO). Selection of individual cell lines for knockdown experiments was based on significant up-regulation of each miRNA in those cells compared with NOSE, whereas choice of cell lines for overexpression experiments was based on significant down-regulation of each miRNA. Because the specificity of miRNA silencing is determined by the seed sequence, we examined the selected cell lines for aberrant expression of seed-matched family members that might hamper knockdown or overexpression efficiency, and simultaneously targeted those miRNAs.
ES-2 cells were transfected in six-well plates (2.5 × 10⁵ cells per well) using 10 μl X-tremeGENE siRNA Transfection Reagent (Roche, Indianapolis, IN) and 2 μg hsa-mir-182 hairpin inhibitor (50 nm final concentration) or 2 μg hsa-mir-22 mimic (65 nm) (Dharmacon). OVSAYO cells were transfected in six-well plates (3.0 × 10⁵ cells per well) using 10 μl Lipofectamine 2000 (Invitrogen) and 2 μg hsa-mir-100 mimic (60 nm), or 3 μl Lipofectamine 2000 and 3 μg total hairpin inhibitor (66 nm). Knockdown of hsa-mir-30 family miRNAs in OVSAYO cells was achieved using a mix of 2 μg hsa-mir-30a inhibitor (44 nm) and 1 μg hsa-mir-30d inhibitor (22 nm). Control groups were cells treated with transfection reagent alone (mock transfection), and cells transfected with miRIDIAN hairpin inhibitor negative control no. 1 or mimic negative control no. 2, which are based on Caenorhabditis elegans miRNAs that have minimal sequence identity to human miRNAs (Dharmacon).
Cells were harvested 48 h after transfection, RNA was prepared using the RNeasy Mini Kit with on-column DNase treatment (QIAGEN, Chatsworth, CA), and RNA quality was inspected on a 2100 Bioanalyzer (Agilent). Gene expression profiling was performed as described above (n = 3 for each inhibitor or mimic; n = 3 for each negative control inhibitor or mimic), and the data were evaluated using Spearman's rank sum analysis and GSEA (39). GSEA was executed using public software from the Broad Institute (http://www.broad.mit.edu/gsea/) with the following settings: classic enrichment statistic; permutation by gene set with 1000 permutations; and ratio of classes used for ranking genes. For both Spearman's rank sum analysis and GSEA, the entire set of genes represented in the given functional array dataset were ranked by ratio of experimental/control. When more than one array probe corresponded to a given gene, the probe with the greatest variation between experimental and control groups was used to represent the gene.
QPCR
QPCR validation of microarray data was performed on samples independent of those used in microarray experiments (n = 5 for each transfection condition). Whereas our microarray experiments compared gene expression in cells treated with miRNA inhibitor or mimic relative to negative control, our QPCR experiments measured differences in these groups compared with mock transfected cells. This allowed us to examine for unexpected effects after treatment with negative control mimic, which has a seed sequence (UGUACUA) predicted to target 92 human genes (TargetScan).
Total RNA (500 ng) was reverse transcribed in a 50 μl reaction using 250 U Superscript III reverse transcriptase and random hexamers (Invitrogen). cDNA was diluted 50-fold and 5 μl was used for each QPCR reaction. Custom primers were designed using Primer Express software (Applied Biosystems) and primer sequences are listed in supplemental data (S6). QPCR was performed on an ABI Prism 7500 Sequence Detection System using SYBR Green PCR Master Mix (Applied Biosystems) in a 20 μl reaction and human β-actin (ACTB) as an endogenous control. Reaction conditions were 2 min at 50 C, 10 min at 95 C, 40 cycles of 15 sec at 95 C (denaturation), and 1 min at 60 C (annealing/extension). Each sample was analyzed in triplicate, and a nontemplate control (nuclease-free water) was included for each primer set. The relative quantity of transcript was calculated using the 2−ΔΔCT method with the average ΔCT of the mock transfection group as the calibrator (85). Data were plotted as mean ± sem, and statistical differences were tested using one-way ANOVA followed by Tukey's honestly significant difference test, with P < 0.05 considered statistically significant.
Lentivirus production, transduction, and immunoblot analysis
CMV-TurboRFP-mir100-IRES-puroR vector (Open Biosystems HMR4842–99855762) was packaged and transduced into OVSAYO cells. A similar vector with nontargeting sequence served as the negative control. Briefly, mir-100 or control vector, as well as helper virus DNA plasmids carrying gag, pol, VSVG and tat, were transfected into 293T cells using Lipofectamine 2000 (Invitrogen). Cell medium containing virus was syringe filtered (0.45 μm) 48 h after transfection and added to OVSAYO cells at an appropriate dilution in the presence of polybrene (8 μg/ml). The virus was replaced with fresh medium 6 h after infection. Transduction efficiency was measured by examining the cells under fluorescence microscope. Puromycin (1 μg/ml) was added to generate stable cells.
Ninety-six hours after infection, cells were washed once with cold PBS and collected. Total lysates were generated in sodium dodecyl sulfate lysis buffer (50 mm Tris-HCl, pH 6.8; 2% sodium dodecyl sulfate) by heating at 90–100 C for 5 min and then clearing by centrifugation. Protein (20 μg) was electrophoresed through a NuPage 3–8% Tris-acetate gel (Invitrogen) under reducing conditions, transferred to a polyvinylidene difluoride membrane, and incubated with antibodies against mTOR (no. 2972; Cell Signaling Technology, Danvers, MA), phospho-4EBP1 (Thr37/46; Cell Signaling 2855), phospho-p70S6K (Ser371; Cell Signaling 9208), or β-actin (Sigma A5441). Immune complexes were detected with horseradish peroxidase-conjugated secondary antibodies and the SuperSignal West Pico Chemiluminescent Substrate Kit (Pierce Biotechnology, Rockford, IL).
Cell viability assay
The CellTiter-Glo Luminescent Cell Viability Assay (Promega Corp., Madison, WI) was used to analyze the effect of the mTOR inhibitor and rapamycin analog RAD001 (everolimus; Sigma 07741) on cell viability according to the manufacturer's protocol. OVSAYO cells stably transduced with mir-100 or control vector were cultured overnight in 96-well plates (5 × 10³ cells per well). Cell viability was measured after the addition of RAD001 (in the presence of 4% fetal bovine serum) at the indicated concentrations for 72 h (n = 3 wells per concentration). The medium containing RAD001 was changed every 24 h. For each RAD001 concentration, cell viability was expressed as a fraction of the untreated mir-100 or control group. Data were plotted as mean ± sem and statistical differences were tested using Student's t test, with P < 0.05 considered statistically significant. Note that for all data points the sem was too small to be visible on the graph.
Supplementary Material
Acknowledgments
We thank the Cullen Foundation for their generous support of the University of Houston's Institute for Molecular Design, and Zhenkang Xu, Mark Rojas, Yuri Fofanov, Derek Han, and Mahjabeen Khan for sequencing. We also thank Dr. Naoki Iwamori for expertise in cell culture and transfection, and Lang Ma and Dror Berel for technical assistance.
Footnotes
This work was supported by a Program Project Development Grant from the Ovarian Cancer Research Fund; National Institutes of Health Grants R01CA60651 (to M.M.M.), T32GM008307 (to A.K.N.), P30CA125123 (to C.J.C.), and K12HD01426-02 (to M.L.A.); a Baylor Ovarian Cancer Research Program Grant (to M.L.A.); the Young Texans Against Cancer; the Dan L. Duncan Cancer Center; the Joseph and Matilda Melnick Endowed Fund (to A.K.N.); and Baylor Research Advocates for Student Scientists (to A.K.N.).
Disclosure Summary: The authors have nothing to disclose.
First Published Online January 15, 2010
Abbreviations: FGFR, Fibroblast growth factor receptor; GSEA, Gene Set Enrichment Analysis; miRNA, microRNA; NOSE, normal ovarian surface epithelium; OSE, ovarian surface epithelium; PI3K, phosphatidylinositol 3-kinase; PIP3, phosphatidylinositol (3,4,5)-triphosphate; PTEN, phosphatase and tensin homolog; QPCR, quantitative real-time PCR.
References
- Jemal A, Siegel R, Ward E, Hao Y, Xu J, Murray T, Thun MJ 2008 Cancer statistics, 2008. CA Cancer J Clin 58:71–96 [DOI] [PubMed] [Google Scholar]
- Auersperg N, Wong AS, Choi KC, Kang SK, Leung PC 2001 Ovarian surface epithelium: biology, endocrinology, and pathology. Endocr Rev 22:255–288 [DOI] [PubMed] [Google Scholar]
- Crum CP 1999 The female genital tract. In: Cotran RS, Kumar V, Collins T eds. Robbins pathologic basis of disease. 6th ed. Philadelphia: W.B. Saunders Co.; 1066–1079 [Google Scholar]
- Seidman JD, Horkayne-Szakaly I, Haiba M, Boice CR, Kurman RJ, Ronnett BM 2004 The histologic type and stage distribution of ovarian carcinomas of surface epithelial origin. Int J Gynecol Pathol 23:41–44 [DOI] [PubMed] [Google Scholar]
- Bell DA 2005 Origins and molecular pathology of ovarian cancer. Mod Pathol 18(Suppl 2):S19–S32 [DOI] [PubMed] [Google Scholar]
- Köbel M, Kalloger SE, Boyd N, McKinney S, Mehl E, Palmer C, Leung S, Bowen NJ, Ionescu DN, Rajput A, Prentice LM, Miller D, Santos J, Swenerton K, Gilks CB, Huntsman D 2008 Ovarian carcinoma subtypes are different diseases: implications for biomarker studies. PLoS Med 5:e232 [DOI] [PMC free article] [PubMed] [Google Scholar]
- Cho KR, Shih IeM 2009 Ovarian cancer. Annu Rev Pathol 4:287–313 [DOI] [PMC free article] [PubMed] [Google Scholar]
- Tan DS, Kaye S 2007 Ovarian clear cell adenocarcinoma: a continuing enigma. J Clin Pathol 60:355–360 [DOI] [PMC free article] [PubMed] [Google Scholar]
- Chan JK, Teoh D, Hu JM, Shin JY, Osann K, Kapp DS 2008 Do clear cell ovarian carcinomas have poorer prognosis compared to other epithelial cell types? A study of 1411 clear cell ovarian cancers. Gynecol Oncol 109:370–376 [DOI] [PubMed] [Google Scholar]
- Pectasides D, Pectasides E, Psyrri A, Economopoulos T 2006 Treatment issues in clear cell carcinoma of the ovary: a different entity? Oncologist 11:1089–1094 [DOI] [PubMed] [Google Scholar]
- Itamochi H, Kigawa J, Terakawa N 2008 Mechanisms of chemoresistance and poor prognosis in ovarian clear cell carcinoma. Cancer Sci 99:653–658 [DOI] [PMC free article] [PubMed] [Google Scholar]
- Matsuura Y, Robertson G, Marsden DE, Kim SN, Gebski V, Hacker NF 2007 Thromboembolic complications in patients with clear cell carcinoma of the ovary. Gynecol Oncol 104:406–410 [DOI] [PubMed] [Google Scholar]
- Van Gorp T, Amant F, Neven P, Vergote I, Moerman P 2004 Endometriosis and the development of malignant tumours of the pelvis. A review of literature. Best Pract Res Clin Obstet Gynaecol 18:349–371 [DOI] [PubMed] [Google Scholar]
- Somigliana E, Vigano' P, Parazzini F, Stoppelli S, Giambattista E, Vercellini P 2006 Association between endometriosis and cancer: a comprehensive review and a critical analysis of clinical and epidemiological evidence. Gynecol Oncol 101:331–341 [DOI] [PubMed] [Google Scholar]
- Nezhat F, Datta MS, Hanson V, Pejovic T, Nezhat C, Nezhat C 2008 The relationship of endometriosis and ovarian malignancy: a review. Fertil Steril 90:1559–1570 [DOI] [PubMed] [Google Scholar]
- Vivanco I, Sawyers CL 2002 The phosphatidylinositol 3-kinase AKT pathway in human cancer. Nat Rev Cancer 2:489–501 [DOI] [PubMed] [Google Scholar]
- Cully M, You H, Levine AJ, Mak TW 2006 Beyond PTEN mutations: the PI3K pathway as an integrator of multiple inputs during tumorigenesis. Nat Rev Cancer 6:184–192 [DOI] [PubMed] [Google Scholar]
- Kuo KT, Mao TL, Jones S, Veras E, Ayhan A, Wang TL, Glas R, Slamon D, Velculescu VE, Kurman RJ, Shih IM 2009 Frequent activating mutations of PIK3CA in ovarian clear cell carcinoma. Am J Pathol 174:1597–1601 [DOI] [PMC free article] [PubMed] [Google Scholar]
- Mabuchi S, Altomare DA, Connolly DC, Klein-Szanto A, Litwin S, Hoelzle MK, Hensley HH, Hamilton TC, Testa JR 2007 RAD001 (Everolimus) delays tumor onset and progression in a transgenic mouse model of ovarian cancer. Cancer Res 67:2408–2413 [DOI] [PubMed] [Google Scholar]
- Mabuchi S, Altomare DA, Cheung M, Zhang L, Poulikakos PI, Hensley HH, Schilder RJ, Ozols RF, Testa JR 2007 RAD001 inhibits human ovarian cancer cell proliferation, enhances cisplatin-induced apoptosis, and prolongs survival in an ovarian cancer model. Clin Cancer Res 13:4261–4270 [DOI] [PubMed] [Google Scholar]
- Mabuchi S, Kawase C, Altomare DA, Morishige K, Sawada K, Hayashi M, Tsujimoto M, Yamoto M, Klein-Szanto AJ, Schilder RJ, Ohmichi M, Testa JR, Kimura T 2009 mTOR is a promising therapeutic target both in cisplatin-sensitive and cisplatin-resistant clear cell carcinoma of the ovary. Clin Cancer Res 15:5404–5413 [DOI] [PMC free article] [PubMed] [Google Scholar]
- Wu L, Belasco JG 2008 Let me count the ways: mechanisms of gene regulation by miRNAs and siRNAs. Mol Cell 29:1–7 [DOI] [PubMed] [Google Scholar]
- Lu J, Getz G, Miska EA, Alvarez-Saavedra E, Lamb J, Peck D, Sweet-Cordero A, Ebert BL, Mak RH, Ferrando AA, Downing JR, Jacks T, Horvitz HR, Golub TR 2005 MicroRNA expression profiles classify human cancers. Nature 435:834–838 [DOI] [PubMed] [Google Scholar]
- Rosenfeld N, Aharonov R, Meiri E, Rosenwald S, Spector Y, Zepeniuk M, Benjamin H, Shabes N, Tabak S, Levy A, Lebanony D, Goren Y, Silberschein E, Targan N, Ben-Ari A, Gilad S, Sion-Vardy N, Tobar A, Feinmesser M, Kharenko O, Nativ O, Nass D, Perelman M, Yosepovich A, Shalmon B, et al. 2008 MicroRNAs accurately identify cancer tissue origin. Nat Biotechnol 26:462–469 [DOI] [PubMed] [Google Scholar]
- Iorio MV, Visone R, Di Leva G, Donati V, Petrocca F, Casalini P, Taccioli C, Volinia S, Liu CG, Alder H, Calin GA, Ménard S, Croce CM 2007 MicroRNA signatures in human ovarian cancer. Cancer Res 67:8699–8707 [DOI] [PubMed] [Google Scholar]
- Nam EJ, Yoon H, Kim SW, Kim H, Kim YT, Kim JH, Kim JW, Kim S 2008 MicroRNA expression profiles in serous ovarian carcinoma. Clin Cancer Res 14:2690–2695 [DOI] [PubMed] [Google Scholar]
- Yang H, Kong W, He L, Zhao JJ, O'Donnell JD, Wang J, Wenham RM, Coppola D, Kruk PA, Nicosia SV, Cheng JQ 2008 MicroRNA expression profiling in human ovarian cancer: miR-214 induces cell survival and cisplatin resistance by targeting PTEN. Cancer Res 68:425–433 [DOI] [PubMed] [Google Scholar]
- Dahiya N, Sherman-Baust CA, Wang TL, Davidson B, Shih IeM, Zhang Y, Wood III W, Becker KG, Morin PJ 2008 MicroRNA expression and identification of putative miRNA targets in ovarian cancer. PLoS ONE 3:e2436 [DOI] [PMC free article] [PubMed] [Google Scholar]
- Sorrentino A, Liu CG, Addario A, Peschle C, Scambia G, Ferlini C 2008 Role of microRNAs in drug-resistant ovarian cancer cells. Gynecol Oncol 111:478–486 [DOI] [PubMed] [Google Scholar]
- Yang N, Kaur S, Volinia S, Greshock J, Lassus H, Hasegawa K, Liang S, Leminen A, Deng S, Smith L, Johnstone CN, Chen XM, Liu CG, Huang Q, Katsaros D, Calin GA, Weber BL, Bützow R, Croce CM, Coukos G, Zhang L 2008 MicroRNA microarray identifies Let-7i as a novel biomarker and therapeutic target in human epithelial ovarian cancer. Cancer Res 68:10307–10314 [DOI] [PMC free article] [PubMed] [Google Scholar]
- Wyman SK, Parkin RK, Mitchell PS, Fritz BR, O'Briant K, Godwin AK, Urban N, Drescher CW, Knudsen BS, Tewari M 2009 Repertoire of microRNAs in epithelial ovarian cancer as determined by next generation sequencing of small RNA cDNA libraries. PLoS ONE 4:e5311 [DOI] [PMC free article] [PubMed] [Google Scholar]
- Edson MA, Nagaraja AK, Matzuk MM 2009 The mammalian ovary from genesis to revelation. Endocr Rev 30:624–712 [DOI] [PMC free article] [PubMed] [Google Scholar]
- Corney DC, Flesken-Nikitin A, Godwin AK, Wang W, Nikitin AY 2007 MicroRNA-34b and MicroRNA-34c are targets of p53 and cooperate in control of cell proliferation and adhesion-independent growth. Cancer Res 67:8433–8438 [DOI] [PubMed] [Google Scholar]
- Johnson SM, Grosshans H, Shingara J, Byrom M, Jarvis R, Cheng A, Labourier E, Reinert KL, Brown D, Slack FJ 2005 RAS is regulated by the let-7 microRNA family. Cell 120:635–647 [DOI] [PubMed] [Google Scholar]
- Sampson VB, Rong NH, Han J, Yang Q, Aris V, Soteropoulos P, Petrelli NJ, Dunn SP, Krueger LJ 2007 MicroRNA let-7a down-regulates MYC and reverts MYC-induced growth in Burkitt lymphoma cells. Cancer Res 67:9762–9770 [DOI] [PubMed] [Google Scholar]
- Mayr C, Hemann MT, Bartel DP 2007 Disrupting the pairing between let-7 and Hmga2 enhances oncogenic transformation. Science 315:1576–1579 [DOI] [PMC free article] [PubMed] [Google Scholar]
- Lee YS, Dutta A 2007 The tumor suppressor microRNA let-7 represses the HMGA2 oncogene. Genes Dev 21:1025–1030 [DOI] [PMC free article] [PubMed] [Google Scholar]
- Chen R, Alvero AB, Silasi DA, Kelly MG, Fest S, Visintin I, Leiser A, Schwartz PE, Rutherford T, Mor G 2008 Regulation of IKKβ by miR-199a affects NF-κB activity in ovarian cancer cells. Oncogene 27:4712–4723 [DOI] [PMC free article] [PubMed] [Google Scholar]
- Subramanian A, Tamayo P, Mootha VK, Mukherjee S, Ebert BL, Gillette MA, Paulovich A, Pomeroy SL, Golub TR, Lander ES, Mesirov JP 2005 Gene set enrichment analysis: a knowledge-based approach for interpreting genome-wide expression profiles. Proc Natl Acad Sci USA 102:15545–15550 [DOI] [PMC free article] [PubMed] [Google Scholar]
- Mootha VK, Lindgren CM, Eriksson KF, Subramanian A, Sihag S, Lehar J, Puigserver P, Carlsson E, Ridderstråle M, Laurila E, Houstis N, Daly MJ, Patterson N, Mesirov JP, Golub TR, Tamayo P, Spiegelman B, Lander ES, Hirschhorn JN, Altshuler D, Groop LC 2003 PGC-1α-responsive genes involved in oxidative phosphorylation are coordinately downregulated in human diabetes. Nat Genet 34:267–273 [DOI] [PubMed] [Google Scholar]
- Baek D, Villén J, Shin C, Camargo FD, Gygi SP, Bartel DP 2008 The impact of microRNAs on protein output. Nature 455:64–71 [DOI] [PMC free article] [PubMed] [Google Scholar]
- Selbach M, Schwanhäusser B, Thierfelder N, Fang Z, Khanin R, Rajewsky N 2008 Widespread changes in protein synthesis induced by microRNAs. Nature 455:58–63 [DOI] [PubMed] [Google Scholar]
- Zorn KK, Jazaeri AA, Awtrey CS, Gardner GJ, Mok SC, Boyd J, Birrer MJ 2003 Choice of normal ovarian control influences determination of differentially expressed genes in ovarian cancer expression profiling studies. Clin Cancer Res 9:4811–4818 [PubMed] [Google Scholar]
- Wang FZ, Weber F, Croce C, Liu CG, Liao X, Pellett PE 2008 Human cytomegalovirus infection alters the expression of cellular microRNA species that affect its replication. J Virol 82:9065–9074 [DOI] [PMC free article] [PubMed] [Google Scholar]
- Qing J, Du X, Chen Y, Chan P, Li H, Wu P, Marsters S, Stawicki S, Tien J, Totpal K, Ross S, Stinson S, Dornan D, French D, Wang QR, Stephan JP, Wu Y, Wiesmann C, Ashkenazi A 2009 Antibody-based targeting of FGFR3 in bladder carcinoma and t(4;14)-positive multiple myeloma in mice. J Clin Invest 119:1216–1229 [DOI] [PMC free article] [PubMed] [Google Scholar]
- Ong SH, Hadari YR, Gotoh N, Guy GR, Schlessinger J, Lax I 2001 Stimulation of phosphatidylinositol 3-kinase by fibroblast growth factor receptors is mediated by coordinated recruitment of multiple docking proteins. Proc Natl Acad Sci USA 98:6074–6079 [DOI] [PMC free article] [PubMed] [Google Scholar]
- Chang TC, Yu D, Lee YS, Wentzel EA, Arking DE, West KM, Dang CV, Thomas-Tikhonenko A, Mendell JT 2008 Widespread microRNA repression by Myc contributes to tumorigenesis. Nat Genet 40:43–50 [DOI] [PMC free article] [PubMed] [Google Scholar]
- Zhao X, He M, Wan D, Ye Y, He Y, Han L, Guo M, Huang Y, Qin W, Wang MW, Chong W, Chen J, Zhang L, Yang N, Xu B, Wu M, Zuo L, Gu J 2003 The minimum LOH region defined on chromosome 17p13.3 in human hepatocellular carcinoma with gene content analysis. Cancer Lett 190:221–232 [DOI] [PubMed] [Google Scholar]
- Lionetti M, Agnelli L, Mosca L, Fabris S, Andronache A, Todoerti K, Ronchetti D, Deliliers GL, Neri A 2009 Integrative high-resolution microarray analysis of human myeloma cell lines reveals deregulated miRNA expression associated with allelic imbalances and gene expression profiles. Genes Chromosomes Cancer 48:521–531 [DOI] [PubMed] [Google Scholar]
- Pandey DP, Picard D 2009 miR-22 inhibits estrogen signaling by directly targeting the estrogen receptor α mRNA. Mol Cell Biol 29:3783–3790 [DOI] [PMC free article] [PubMed] [Google Scholar]
- Iliopoulos D, Malizos KN, Oikonomou P, Tsezou A 2008 Integrative microRNA and proteomic approaches identify novel osteoarthritis genes and their collaborative metabolic and inflammatory networks. PLoS ONE 3:e3740 [DOI] [PMC free article] [PubMed] [Google Scholar]
- Rosanò L, Cianfrocca R, Masi S, Spinella F, Di Castro V, Biroccio A, Salvati E, Nicotra MR, Natali PG, Bagnato A 2009 β-Arrestin links endothelin A receptor to β-catenin signaling to induce ovarian cancer cell invasion and metastasis. Proc Natl Acad Sci USA 106:2806–2811 [DOI] [PMC free article] [PubMed] [Google Scholar]
- Lassmann S, Weis R, Makowiec F, Roth J, Danciu M, Hopt U, Werner M 2007 Array CGH identifies distinct DNA copy number profiles of oncogenes and tumor suppressor genes in chromosomal- and microsatellite-unstable sporadic colorectal carcinomas. J Mol Med 85:293–304 [DOI] [PubMed] [Google Scholar]
- Suzuki T, Maruno M, Wada K, Kagawa N, Fujimoto Y, Hashimoto N, Izumoto S, Yoshimine T 2004 Genetic analysis of human glioblastomas using a genomic microarray system. Brain Tumor Pathol 21:27–34 [DOI] [PubMed] [Google Scholar]
- Saitoh T, Katoh M 2001 FRAT1 and FRAT2, clustered in human chromosome 10q24.1 region, are up-regulated in gastric cancer. Int J Oncol 19:311–315 [DOI] [PubMed] [Google Scholar]
- Wieser R 2007 The oncogene and developmental regulator EVI1: expression, biochemical properties, and biological functions. Gene 396:346–357 [DOI] [PubMed] [Google Scholar]
- Sunde JS, Donninger H, Wu K, Johnson ME, Pestell RG, Rose GS, Mok SC, Brady J, Bonome T, Birrer MJ 2006 Expression profiling identifies altered expression of genes that contribute to the inhibition of transforming growth factor-β signaling in ovarian cancer. Cancer Res 66:8404–8412 [DOI] [PubMed] [Google Scholar]
- Nanjundan M, Nakayama Y, Cheng KW, Lahad J, Liu J, Lu K, Kuo WL, Smith-McCune K, Fishman D, Gray JW, Mills GB 2007 Amplification of MDS1/EVI1 and EVI1, located in the 3q26.2 amplicon, is associated with favorable patient prognosis in ovarian cancer. Cancer Res 67:3074–3084 [DOI] [PubMed] [Google Scholar]
- Kurokawa M, Mitani K, Irie K, Matsuyama T, Takahashi T, Chiba S, Yazaki Y, Matsumoto K, Hirai H 1998 The oncoprotein Evi-1 represses TGF-β signalling by inhibiting Smad3. Nature 394:92–96 [DOI] [PubMed] [Google Scholar]
- Liu Y, Chen L, Ko TC, Fields AP, Thompson EA 2006 Evi1 is a survival factor which conveys resistance to both TGFβ- and taxol-mediated cell death via PI3K/AKT. Oncogene 25:3565–3575 [DOI] [PubMed] [Google Scholar]
- Su H, Trombly MI, Chen J, Wang X 2009 Essential and overlapping functions for mammalian Argonautes in microRNA silencing. Genes Dev 23:304–317 [DOI] [PMC free article] [PubMed] [Google Scholar]
- Nowee ME, Snijders AM, Rockx DA, de Wit RM, Kosma VM, Hämäläinen K, Schouten JP, Verheijen RH, van Diest PJ, Albertson DG, Dorsman JC 2007 DNA profiling of primary serous ovarian and fallopian tube carcinomas with array comparative genomic hybridization and multiplex ligation-dependent probe amplification. J Pathol 213:46–55 [DOI] [PubMed] [Google Scholar]
- Eulalio A, Rehwinkel J, Stricker M, Huntzinger E, Yang SF, Doerks T, Dorner S, Bork P, Boutros M, Izaurralde E 2007 Target-specific requirements for enhancers of decapping in miRNA-mediated gene silencing. Genes Dev 21:2558–2570 [DOI] [PMC free article] [PubMed] [Google Scholar]
- Ling SH, Decker CJ, Walsh MA, She M, Parker R, Song H 2008 Crystal structure of human Edc3 and its functional implications. Mol Cell Biol 28:5965–5976 [DOI] [PMC free article] [PubMed] [Google Scholar]
- Merritt WM, Lin YG, Han LY, Kamat AA, Spannuth WA, Schmandt R, Urbauer D, Pennacchio LA, Cheng JF, Nick AM, Deavers MT, Mourad-Zeidan A, Wang H, Mueller P, Lenburg ME, Gray JW, Mok S, Birrer MJ, Lopez-Berestein G, Coleman RL, Bar-Eli M, Sood AK 2008 Dicer, Drosha, and outcomes in patients with ovarian cancer. N Engl J Med 359:2641–2650 [DOI] [PMC free article] [PubMed] [Google Scholar]
- Zhang L, Volinia S, Bonome T, Calin GA, Greshock J, Yang N, Liu CG, Giannakakis A, Alexiou P, Hasegawa K, Johnstone CN, Megraw MS, Adams S, Lassus H, Huang J, Kaur S, Liang S, Sethupathy P, Leminen A, Simossis VA, Sandaltzopoulos R, Naomoto Y, Katsaros D, Gimotty PA, DeMichele A, et al. 2008 Genomic and epigenetic alterations deregulate microRNA expression in human epithelial ovarian cancer. Proc Natl Acad Sci USA 105:7004–7009 [DOI] [PMC free article] [PubMed] [Google Scholar]
- Segura MF, Hanniford D, Menendez S, Reavie L, Zou X, Alvarez-Diaz S, Zakrzewski J, Blochin E, Rose A, Bogunovic D, Polsky D, Wei J, Lee P, Belitskaya-Levy I, Bhardwaj N, Osman I, Hernando E 2009 Aberrant miR-182 expression promotes melanoma metastasis by repressing FOXO3 and microphthalmia-associated transcription factor. Proc Natl Acad Sci USA 106:1814–1819 [DOI] [PMC free article] [PubMed] [Google Scholar]
- Guo JY, Yamada A, Kajino T, Wu JQ, Tang W, Freel CD, Feng J, Chau BN, Wang MZ, Margolis SS, Yoo HY, Wang XF, Dunphy WG, Irusta PM, Hardwick JM, Kornbluth S 2008 Aven-dependent activation of ATM following DNA damage. Curr Biol 18:933–942 [DOI] [PMC free article] [PubMed] [Google Scholar]
- Sellers TA, Huang Y, Cunningham J, Goode EL, Sutphen R, Vierkant RA, Kelemen LE, Fredericksen ZS, Liebow M, Pankratz VS, Hartmann LC, Myer J, Iversen Jr ES, Schildkraut JM, Phelan C 2008 Association of single nucleotide polymorphisms in glycosylation genes with risk of epithelial ovarian cancer. Cancer Epidemiol Biomarkers Prev 17:397–404 [DOI] [PMC free article] [PubMed] [Google Scholar]
- Li B, An HJ, Kirmiz C, Lebrilla CB, Lam KS, Miyamoto S 2008 Glycoproteomic analyses of ovarian cancer cell lines and sera from ovarian cancer patients show distinct glycosylation changes in individual proteins. J Proteome Res 7:3776–3788 [DOI] [PubMed] [Google Scholar]
- Yap TA, Carden CP, Kaye SB 2009 Beyond chemotherapy: targeted therapies in ovarian cancer. Nat Rev Cancer 9:167–181 [DOI] [PubMed] [Google Scholar]
- Kruk PA, Maines-Bandiera SL, Auersperg N 1990 A simplified method to culture human ovarian surface epithelium. Lab Invest 63:132–136 [PubMed] [Google Scholar]
- Nozawa S, Tsukazaki K, Sakayori M, Jeng CH, Iizuka R 1988 Establishment of a human ovarian clear cell carcinoma cell line (RMG-I) and its single cell cloning–with special reference to the stem cell of the tumor. Hum Cell 1:426–435 [PubMed] [Google Scholar]
- Yanagibashi T, Gorai I, Nakazawa T, Miyagi E, Hirahara F, Kitamura H, Minaguchi H 1997 Complexity of expression of the intermediate filaments of six new human ovarian carcinoma cell lines: new expression of cytokeratin 20. Br J Cancer 76: 829–835 [DOI] [PMC free article] [PubMed] [Google Scholar]
- Gorai I, Nakazawa T, Miyagi E, Hirahara F, Nagashima Y, Minaguchi H 1995 Establishment and characterization of two human ovarian clear cell adenocarcinoma lines from metastatic lesions with different properties. Gynecol Oncol 57:33–46 [DOI] [PubMed] [Google Scholar]
- Morisawa T, Kuramoto H, Shimoda T, Hamano M, Kato Y, Hata H 1988 Establishment and characterization of a CA-125 producing cell line (OVAS-21) from a clear cell adenocarcinoma of the ovary. Hum Cell 1:347 [PubMed] [Google Scholar]
- Sasa H, Ishii K, Hirata J, Kikuchi Y, Nagata I, Kawai T, Senoo A, Sugita M, Sugishita T, Tenjin Y 1993 [Establishment and characterization of a CA125-producing human ovarian clear cell carcinoma cell line]. Hum Cell 6:279–286 [PubMed] [Google Scholar]
- Kikuchi Y, Hirata J, Kita T, Imaizumi E, Tode T, Nagata I 1993 Enhancement of antiproliferative effect of cis-diamminedichloroplatinum(II) by clomiphene and tamoxifen in human ovarian cancer cells. Gynecol Oncol 49:365–372 [DOI] [PubMed] [Google Scholar]
- Yonamine K, Hayashi K, Iida T 1999 Establishment and characterization of human ovarian clear cell adenocarcinoma cell line (SMOV-2), and its cytotoxity by anticancer agents. Hum Cell 12:139–148 [PubMed] [Google Scholar]
- Griffiths-Jones S, Saini HK, van Dongen S, Enright AJ 2008 miRBase: tools for microRNA genomics. Nucleic Acids Res 36:D154–D158 [DOI] [PMC free article] [PubMed] [Google Scholar]
- Friedman RC, Farh KK, Burge CB, Bartel DP 2009 Most mammalian mRNAs are conserved targets of microRNAs. Genome Res 19:92–105 [DOI] [PMC free article] [PubMed] [Google Scholar]
- Krek A, Grün D, Poy MN, Wolf R, Rosenberg L, Epstein EJ, MacMenamin P, da Piedade I, Gunsalus KC, Stoffel M, Rajewsky N 2005 Combinatorial microRNA target predictions. Nat Genet 37:495–500 [DOI] [PubMed] [Google Scholar]
- Betel D, Wilson M, Gabow A, Marks DS, Sander C 2008 The microRNA.org resource: targets and expression. Nucleic Acids Res 36:D149–D153 [DOI] [PMC free article] [PubMed] [Google Scholar]
- Creighton CJ, Nagaraja AK, Hanash SM, Matzuk MM, Gunaratne PH 2008 A bioinformatics tool for linking gene expression profiling results with public databases of microRNA target predictions. RNA 14:2290–2296 [DOI] [PMC free article] [PubMed] [Google Scholar]
- Livak KJ, Schmittgen TD 2001 Analysis of relative gene expression data using real-time quantitative PCR and the 2(-Δ Δ C(T)) method. Methods 25:402–408 [DOI] [PubMed] [Google Scholar]
Associated Data
This section collects any data citations, data availability statements, or supplementary materials included in this article.