

Abstract
Many protein classification systems capture homologous relationships by grouping domains into families and superfamilies on the basis of sequence similarity. Superfamilies with similar 3D structures are further grouped into folds. In the absence of discernable sequence similarity, these structural similarities were long thought to have originated independently, by convergent evolution. However, the growth of databases and advances in sequence comparison methods have led to the discovery of many distant evolutionary relationships that transcend the boundaries of superfamilies and folds. To investigate the contributions of convergent versus divergent evolution in the origin of protein folds, we clustered representative domains of known structure by their sequence similarity, treating them as point masses in a virtual 2D space which attract or repel each other depending on their pairwise sequence similarities. As expected, families in the same superfamily form tight clusters. But often, superfamilies of the same fold are linked with each other, suggesting that the entire fold evolved from an ancient prototype. Strikingly, some links connect superfamilies with different folds. They arise from modular peptide fragments of between 20 and 40 residues that co-occur in the connected folds in disparate structural contexts. These may be descendants of an ancestral pool of peptide modules that evolved as cofactors in the RNA world and from which the first folded proteins arose by amplification and recombination. Our galaxy of folds summarizes, in a single image, most known and many yet undescribed homologous relationships between protein superfamilies, providing new insights into the evolution of protein domains.
Keywords: protein evolution, fold space, fold map, remote homology, ancient peptide modules
Introduction
Protein sequence space is essentially infinite. Even just considering the median protein chain length of about 300 residues,1 the number of possible sequences is 20300 (∼10390), which vastly exceeds the estimated number of particles in the known universe (1080). Life could not have explored more than a minuscule proportion of this astronomical space. Indeed, the total complement of the world's proteome is probably only about a trillion (∼108 species, each containing ∼104 protein-coding genes). As insignificant as this number may seem by comparison to the available sequence space, it is still a substantial overestimate of the actual protein diversity found in nature. In fact, most proteins resemble other proteins in sequence and structure because they are built by amplification, recombination, and divergence from a basic set of autonomously folding units, termed domains. Around 105 domain families have been recognized by sequence comparison,2,3 and this number is unlikely to grow very much. These families reflect the descent of modern proteins from a limited number of ancestral forms, most of which were already established at the time of the last common ancestor, 3.5 billion years ago.
Diversity is even more restricted at the structural level. Only ∼103 folds are populated in nature,4 and these frequently show recurrent local arrangements of secondary structures (supersecondary structures),5,6 such that the diversity at the subdomain level is even further reduced. However, although the sequence similarity of domains reflects homologous descent, structural similarity may often be analogous because only a limited number of folded conformations are available to the polypeptide chain, owing to biophysical constraints. Indeed, domain families unrelated in sequence may show considerable structural similarity.7 This duality between homologous and analogous contributions to the properties of modern proteins is captured by structural classification systems, such as SCOP (Structural Classification of Proteins)8 and CATH (Class-Architecture-Topology-Homology),9 by combining homologous criteria at lower hierarchical levels with analogous criteria at upper levels. This mode of classification differs from classification by natural descent, as used for organisms, because life is monophyletic, being descended from a common ancestor, whereas proteins are polyphyletic, having evolved from a set of distinct ancestral forms. Therefore, in the absence of detectable sequence similarity, the resemblance between two proteins is reasonably assumed to be analogous.
How extensive is this polyphyly of proteins? Did each of the 105 or so protein families arise independently, the structural similarities between them being convergent? It would not appear to be so. In recent years, the dramatic expansion of molecular databases and the development of a new generation of highly sensitive sequence comparison methods10–14 has revealed a growing number of distant evolutionary relationships, which transcend the previous boundaries between homology and analogy. For instance, most families of the TIM (βα)8-barrel fold are now thought to have arisen from a common ancestor.15–17 Occasionally, even the boundaries between folds have been broken either due to the discovery of homologous fold change18–21 or due to the detection of conserved supersecondary structures, which may represent remnants of an ancient peptide-RNA world.22–24 These findings suggest that proteins might not be as polyphyletic as hitherto assumed.
To evaluate the extent to which such distant relationships transcend current structural classification, we clustered a representative set of protein domains, encompassing all known folds, on the basis of sequence comparisons alone. The resulting map shows that many protein families from different superfamilies or even folds may have a homologous origin.
Results and Discussion
Hitherto, studies have mapped fold space by structural criteria, mainly with a focus on principles for automatically classifying proteins.25–27 Some studies also considered structure-based function inference28 and the fold usage of organisms.27 All these studies used structural similarity to connect different folds, a property that primarily reflects analogy. Because of these convergent local similarities, structural maps show proteins in a continuum,29–33 obscuring discrete evolutionary relationships.34,35 Indeed, recent results suggest that events such as circular permutations, strand invasions, or 3D domain swaps may have substantially altered the folds of homologous proteins,18–21 often leading to the variant form resembling an unrelated fold. In such cases, structural convergence can give the impression of continuity in an evolutionarily discontinuous landscape. We therefore decided to revisit the mapping of protein fold space using only homologous criteria, that is, sequence similarity.
To gather domains representative of known fold types, we chose the structural classification of proteins (SCOP) database.8 SCOP classifies proteins hierarchically by grouping related domains into families, related families into superfamilies, structurally similar superfamilies into folds, and folds into secondary structure classes. Thus, the first two levels of the classification capture homologous relationships, whereas the last two capture analogous ones. For the purpose of this study, we filtered SCOP to a maximum of 20% sequence identity. At this level, all superfamilies and nearly all families are still represented, but most relationships considered homologous by SCOP have been removed. We made pairwise comparisons of profile hidden Markov models (HMMs) for these domains and clustered them by a force-directed procedure, using the statistical significance of the pairwise comparisons to assign attractive and repulsive forces to each profile pair in a two-dimensional map (see methods). In the resulting cluster map, domains are represented by colored dots, while the brightness of the connecting lines indicates the degree of sequence similarity. The dots in the map were colored based on their SCOP classification to produce class (Fig. 1), fold (Fig. 2), and superfamily (Fig. 3) maps, respectively. Interactive versions of these maps can be navigated at http://toolkit.tuebingen.mpg.de/hhcluster.
Figure 1.
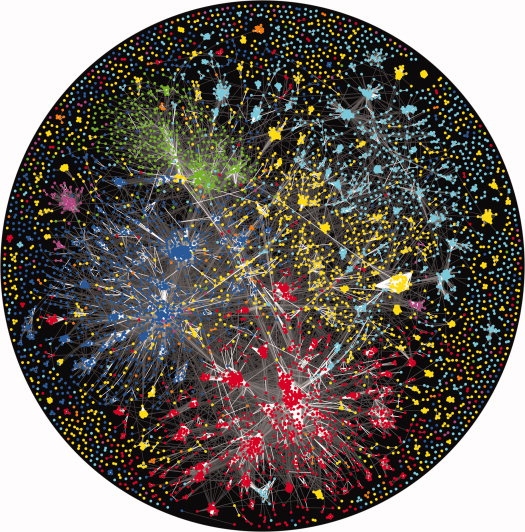
Galaxy of folds colored by classes. Domains from the same class come to lie in similar regions of the galaxy. Domains in SCOP20 were clustered in CLANS based on their all-against-all pairwise similarities as measured by HHsearch P-values. Dots represent domains. Line coloring reflects HHsearch P-values; the brighter a line, the lower the P-value. Domains are colored according to their SCOP class: all-α (blue), all-β (cyan), α/β (red), α+β (yellow), small proteins (green), multi-domain proteins (orange), and membrane proteins (magenta).
Figure 2.
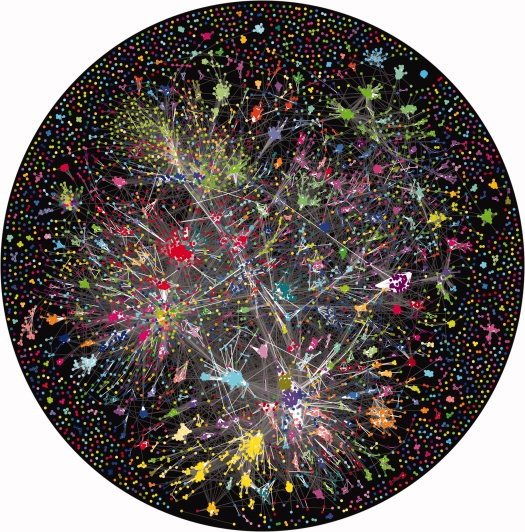
Galaxy of folds colored by folds. Some clusters connect domains of different fold, pointing to common, homologous fragments of similar sequence and structure. These might represent descendants of a set of ancient peptide modules, from which the first protein domains have been assembled.
Figure 3.
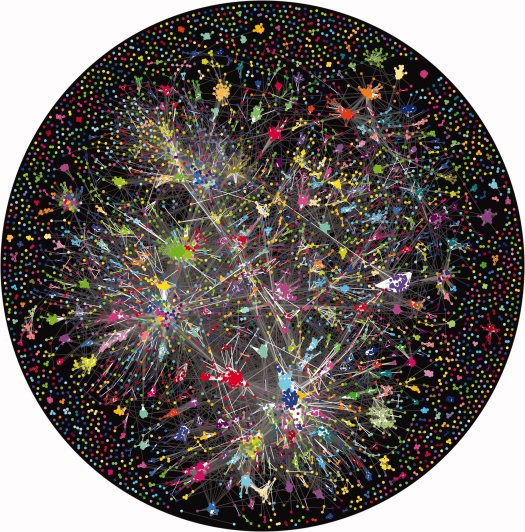
Galaxy of folds colored by superfamilies. Many tight clusters contain various superfamilies of the same fold, indicating that folds with multiple independent origins are rather the exception than the rule.
Although the clustering was done only based on sequence information, we observe that proteins of the same structural class generally converge to the same regions in the map. The structural classes recognized by SCOP are: folds consisting primarily of α-helices (all-α), folds formed mainly of β-strands (all-β), folds in which helices and strands alternate regularly (α/β), and folds with irregular mixtures of helices and strands (α+β). SCOP also recognizes a small proteins class, which comprises proteins rich in cysteine, a multidomain class, and a membrane protein class, but these do not constitute classes in an architectural sense. The class map (Fig. 1) shows five large regions corresponding to the four primary classes—all-α (blue), all-β (cyan), α/β (red), and α+β (yellow)—and to the small proteins class (green). We attribute their convergence to general similarities in amino acid composition, that is, to an analogous property. We find support for this notion in the fact that a map generated after correction for amino acid bias showed a considerably decreased grouping of the structural classes. This is consistent with previous observations that the amino acid composition reflects the structural class of a protein.36 Because of the force-directed clustering procedure, folds find their equilibrium position in the map not only by attraction to similar folds but also by repulsion of different ones. Clusters of similar folds can thus develop considerable repulsive forces, frequently clearing the areas around them and repelling dissimilar folds to distant parts of the map. For this reason, while the all-α and α/β classes are next to each other, the all-α and all-β classes occupy diagonally opposite locations. Of the primary classes, the α+β class shows the least convergence and overlaps most with the other classes, suggesting that it could be considered a catch-all class. This has already been pointed out by Orengo et al., who do not consider α+β a true structural class.26 Of the last two classes, membrane proteins cluster with the soluble proteins of the same secondary structure (helical membrane proteins with the all-α class and outer membrane proteins with the all-β class), and multidomain proteins are scattered all over the map, as their constituent domains belong to different classes.
Although unrelated domains from the same class are very loosely connected in general, the many tighter clusters are formed from groups of domains with statistically significant pairwise similarities that are indicative of homology. We chose 60 visually prominent clusters for further analysis. As expected, most of these contain domains of the same superfamily, but 18 contain domains from different superfamilies. Out of these, seven comprise superfamilies of the same fold and 11 superfamilies of different folds.
One large cluster contains the various superfamilies of the aforementioned TIM (βα)8-barrels (yellow cluster at the bottom in Fig. 2). In our map, all superfamilies of this fold (SCOP c.1.1-c.1.33), except for monomethylamine methyltransferase (c.1.25) and NAD(P)-linked oxidoreductase (c.1.7), cluster into three groups, which are tightly linked to each other, in agreement with their proposed homology.15–17 Other examples of such folds with tightly connected superfamilies include the α/α toroid fold (a.102, salmon cluster near the left edge in Fig. 2) and the β-trefoil fold (b.42). In both of these cases, a homologous origin for the superfamilies within the fold is likely.37,38
Although our results indicate that folds may not be as polyphyletic as assumed by SCOP, we do see instances of analogous folds. The most striking example is the ferredoxin-like fold (d.58), which has by far the largest number of superfamilies in SCOP. These superfamilies are distributed all over the map, indicating that they converged upon the same fold independently. Other examples are the ferritin-like folds (a.25) and the immunoglobulin-like β- sandwich folds (b.1). We also see instances of superfamilies of the same fold that show a mixture of homologous and analogous connections. Examples include the ribonuclease H-like motif fold (c.55), the double-stranded β-helix fold (b.82), and the SH3-like barrel fold (b.34).
Of the 11 clusters comprising domains belonging to different folds, connections in two clusters rely on global similarities between domains. One cluster contains β-propellers, which are toroidal folds with between four and 10 repeats of a four-stranded β-meander. In SCOP, they are classified into five different folds (b.66-b.70), each with multiple superfamilies. We recently proposed a common origin for all β-propellers,39 and we find that they indeed cluster together, except for apyrase (b.67.3) and sema domain (b.69.12), which contain large insertions. The second cluster comprises transmembrane β-barrels, which are classified into seven superfamilies within two folds (f.4 and d.24.1.4) in SCOP. Their homologous origin has been discussed recently.40,41
In the remaining nine clusters, the connections between domains clearly result from the presence of sequence- and structure-similar subdomain-sized fragments. For example, one large cluster contains a variety of topologically distinct DNA-binding domains with a common helix-turn-helix motif (large, mainly red cluster at the middle in Fig. 2), whose homologous origin has been discussed previously.42 In SCOP, these domains are classified into 16 superfamilies contained within 10 folds. Another large cluster contains the Rossmann folds (large cluster comprising dots with various colors at the bottom in Fig. 2), which possess a common dinucleotide-binding βαβ-element. Their evolutionary relationship has also been proposed previously.14,23 A further cluster comprises the eukaryotic (Type-I) and the prokaryotic (Type-II) KH-domains, which are topologically distinct but homologous.43 The similarity between these folds is limited to a βααβ motif. These clusters lend support to a theory on the origin of folded proteins, which proposes that these structure- and sequence-similar fragments seen in disparate molecular contexts represent remnants of an ancient peptide-RNA world, thus suggesting that today's domains have arisen by fusion, amplification, and divergence from a simpler set of peptide modules.22–24
We do not observe some clusters that we expected from reported instances of remote homology. One reason is that many of these involve domains with few homologs of known structure. For clustering, these would have to rely entirely on the strength of their pairwise connection rather than benefiting from the stronger attractive field generated by a compact group of homologous domain families. Another reason is that some domains that are clearly recognizable at the structural level do not appear as independent entries in SCOP. We had previously proposed that the histone fold (a.22) might have arisen from the C-domain of AAA+ ATPases (c.37.1.20) through a 3D domain swap.44 In the present map, although domains belonging to these twofolds show clear pairwise connections, they do not form a tight cluster. This is because C-domains are not characterized as a separate fold in SCOP but are classified with other P-loop NTPases based on the preceding ATPase domain; they therefore cluster tightly with these. We also anticipate that some instances of distant homology remain unrecognized in our map if they involve domains with few homologs in current databases, as it is not possible to build a reasonable profile HMM in these cases. With the progress of sequencing projects, this problem should wane. A few links with significant HHsearch P-values are false positives, which connect clearly unrelated domains, such as the link between many TIM barrel proteins and the guanine deaminase (d2ooda1, turquoise cluster at the bottom in Fig. 2). According to a systematic analysis of the highest-scoring false positives, the chief cause for these false links are corrupted alignments that are used to build the profile HMMs. In this case, sequences from TIM barrels have crept into the alignment of d2ooda1 during the iterative search.
Materials and Methods
We used the SCOP database,8 version 1.75, filtered to a maximum of 20% sequence identity (SCOP20). HHsearch13 was used for all-against-all comparison of the 7002 domains in SCOP20. HHsearch is a sensitive method for remote homology detection that is based on the pairwise comparison of profile hidden Markov models (HMMs). Profile HMMs can be viewed as sequence profiles containing position-specific gap penalties. They can be constructed from multiple sequence alignments of homologs. For this purpose, alignments are built for each of the SCOP20 domains using the buildali.pl script (with default parameters) from the HHsearch 1.6.0 package. This script uses CS-BLAST, a sequence context-specific extension of PSI-BLAST, for iterative sequence searching.45 It also contains heuristics to reduce the inclusion of nonhomologous sequence segments at the ends of PSI-BLAST sequence matches, the leading cause of high-scoring false positive matches in PSI-BLAST. Profile HMMs were calculated from the alignments using hhmake and compared with HHsearch, both from the HHsearch 1.6.0 package. We switched off secondary structure scoring and the compositional bias correction (options -ssm 0 -sc 0) and used default settings otherwise. We clustered the SCOP20 domains by their pairwise HHsearch P-values in CLANS,46 an implementation of the Fruchterman-Reingold clustering algorithm that scales negative log-P-values into attractive forces in a force field. Clustering was done to equilibrium in 2D at a P-value cutoff of 1.0e-01 using default settings. The obtained cluster map is available through a web-based tool (HHcluster). Users can select between maps colored by class, fold, superfamily, or family. HHcluster is integrated into the MPI Bioinformatics Toolkit47 (http://toolkit.tuebingen.mpg.de/hhcluster), allowing the interactive analysis of the map. Proteins can be identified in the map by a mouse-over function or through text searches, neighbors with significant connections and their corresponding HMM-HMM comparison results can be viewed by clicking on the query domain, and the structures of both query and matched protein domain can be viewed with the aligned substructures structurally superposed and highlighted.
Conclusions
We have produced a two-dimensional map of protein fold space using sequence criteria alone to evaluate the abundance of distant evolutionary relationships among protein domains currently classified into analogous categories. Our map offers a global view of evolutionary relationships in fold space and shows incidences of homologous connections that transcend both superfamily and fold levels. Many of the relationships observed in the map have been discussed individually before, confirming the validity of these findings. Our results suggest that proteins may not have had as many independent origins as hitherto assumed.
References
- 1.Brocchieri L, Karlin S. Protein length in eukaryotic and prokaryotic proteomes. Nucleic Acids Res. 2005;33:3390–3400. doi: 10.1093/nar/gki615. [DOI] [PMC free article] [PubMed] [Google Scholar]
- 2.Marsden RL, Lee D, Maibaum M, Yeats C, Orengo CA. Comprehensive genome analysis of 203 genomes provides structural genomics with new insights into protein family space. Nucleic Acids Res. 2006;34:1066–1080. doi: 10.1093/nar/gkj494. [DOI] [PMC free article] [PubMed] [Google Scholar]
- 3.Hunter S, Apweiler R, Attwood TK, Bairoch A, Bateman A, Binns D, Bork P, Das U, Daugherty L, Duquenne L, et al. InterPro: the integrative protein signature database. Nucleic Acids Res. 2009;37:D211–D215. doi: 10.1093/nar/gkn785. [DOI] [PMC free article] [PubMed] [Google Scholar]
- 4.Orengo CA, Thornton JM. Protein families and their evolution-a structural perspective. Annu Rev Biochem. 2005;74:867–900. doi: 10.1146/annurev.biochem.74.082803.133029. [DOI] [PubMed] [Google Scholar]
- 5.Rao ST, Rossmann MG. Comparison of super-secondary structures in proteins. J Mol Biol. 1973;76:241–256. doi: 10.1016/0022-2836(73)90388-4. [DOI] [PubMed] [Google Scholar]
- 6.Salem GM, Hutchinson EG, Orengo CA, Thornton JM. Correlation of observed fold frequency with the occurrence of local structural motifs. J Mol Biol. 1999;287:969–981. doi: 10.1006/jmbi.1999.2642. [DOI] [PubMed] [Google Scholar]
- 7.Cheng H, Kim BH, Grishin NV. MALISAM: a database of structurally analogous motifs in proteins. Nucleic Acids Res. 2008;36:D211–217. doi: 10.1093/nar/gkm698. [DOI] [PMC free article] [PubMed] [Google Scholar]
- 8.Murzin AG, Brenner SE, Hubbard T, Chothia C. SCOP: a structural classification of proteins database for the investigation of sequences and structures. J Mol Biol. 1995;247:536–540. doi: 10.1006/jmbi.1995.0159. [DOI] [PubMed] [Google Scholar]
- 9.Orengo CA, Michie AD, Jones S, Jones DT, Swindells MB, Thornton JM. CATH—a hierarchic classification of protein domain structures. Structure. 1997;5:1093–1108. doi: 10.1016/s0969-2126(97)00260-8. [DOI] [PubMed] [Google Scholar]
- 10.Altschul SF, Madden TL, Schaffer AA, Zhang J, Zhang Z, Miller W, Lipman DJ. Gapped BLAST and PSI-BLAST: a new generation of protein database search programs. Nucleic Acids Res. 1997;25:3389–3402. doi: 10.1093/nar/25.17.3389. [DOI] [PMC free article] [PubMed] [Google Scholar]
- 11.Eddy SR. Profile hidden Markov models. Bioinformatics. 1998;14:755–763. doi: 10.1093/bioinformatics/14.9.755. [DOI] [PubMed] [Google Scholar]
- 12.Sadreyev R, Grishin N. COMPASS: a tool for comparison of multiple protein alignments with assessment of statistical significance. J Mol Biol. 2003;326:317–336. doi: 10.1016/s0022-2836(02)01371-2. [DOI] [PubMed] [Google Scholar]
- 13.Soding J. Protein homology detection by HMM-HMM comparison. Bioinformatics. 2005;21:951–960. doi: 10.1093/bioinformatics/bti125. [DOI] [PubMed] [Google Scholar]
- 14.Xie L, Bourne PE. Detecting evolutionary relationships across existing fold space, using sequence order-independent profile-profile alignments. Proc Natl Acad Sci USA. 2008;105:5441–5446. doi: 10.1073/pnas.0704422105. [DOI] [PMC free article] [PubMed] [Google Scholar]
- 15.Copley RR, Bork P. Homology among (betaalpha)(8) barrels: implications for the evolution of metabolic pathways. J Mol Biol. 2000;303:627–641. doi: 10.1006/jmbi.2000.4152. [DOI] [PubMed] [Google Scholar]
- 16.Nagano N, Orengo CA, Thornton JM. One fold with many functions: the evolutionary relationships between TIM barrel families based on their sequences, structures and functions. J Mol Biol. 2002;321:741–765. doi: 10.1016/s0022-2836(02)00649-6. [DOI] [PubMed] [Google Scholar]
- 17.Soding J, Remmert M, Biegert A. HHrep: de novo protein repeat detection and the origin of TIM barrels. Nucleic Acids Res. 2006;34:W137–W142. doi: 10.1093/nar/gkl130. [DOI] [PMC free article] [PubMed] [Google Scholar]
- 18.Grishin NV. Fold change in evolution of protein structures. J Struct Biol. 2001;134:167–185. doi: 10.1006/jsbi.2001.4335. [DOI] [PubMed] [Google Scholar]
- 19.Andreeva A, Murzin AG. Evolution of protein fold in the presence of functional constraints. Curr Opin Struct Biol. 2006;16:399–408. doi: 10.1016/j.sbi.2006.04.003. [DOI] [PubMed] [Google Scholar]
- 20.Andreeva A, Prlic A, Hubbard TJ, Murzin AG. SISYPHUS—structural alignments for proteins with non-trivial relationships. Nucleic Acids Res. 2007;35:D253–D259. doi: 10.1093/nar/gkl746. [DOI] [PMC free article] [PubMed] [Google Scholar]
- 21.Alva V, Koretke KK, Coles M, Lupas AN. Cradle-loop barrels and the concept of metafolds in protein classification by natural descent. Curr Opin Struct Biol. 2008;18:358–365. doi: 10.1016/j.sbi.2008.02.006. [DOI] [PubMed] [Google Scholar]
- 22.Fetrow JS, Godzik A. Function driven protein evolution. A possible proto-protein for the RNA-binding proteins. Pac Symp Biocomput. 1998;3:485–496. [PubMed] [Google Scholar]
- 23.Lupas AN, Ponting CP, Russell RB. On the evolution of protein folds: are similar motifs in different protein folds the result of convergence, insertion, or relics of an ancient peptide world? J Struct Biol. 2001;134:191–203. doi: 10.1006/jsbi.2001.4393. [DOI] [PubMed] [Google Scholar]
- 24.Soding J, Lupas AN. More than the sum of their parts: on the evolution of proteins from peptides. Bioessays. 2003;25:837–846. doi: 10.1002/bies.10321. [DOI] [PubMed] [Google Scholar]
- 25.Holm L, Sander C. Protein structure comparison by alignment of distance matrices. J Mol Biol. 1993;233:123–138. doi: 10.1006/jmbi.1993.1489. [DOI] [PubMed] [Google Scholar]
- 26.Orengo CA, Flores TP, Taylor WR, Thornton JM. Identification and classification of protein fold families. Protein Eng. 1993;6:485–500. doi: 10.1093/protein/6.5.485. [DOI] [PubMed] [Google Scholar]
- 27.Hou J, Sims GE, Zhang C, Kim SH. A global representation of the protein fold space. Proc Natl Acad Sci USA. 2003;100:2386–2390. doi: 10.1073/pnas.2628030100. [DOI] [PMC free article] [PubMed] [Google Scholar]
- 28.Hou J, Jun SR, Zhang C, Kim SH. Global mapping of the protein structure space and application in structure-based inference of protein function. Proc Natl Acad Sci USA. 2005;102:3651–3656. doi: 10.1073/pnas.0409772102. [DOI] [PMC free article] [PubMed] [Google Scholar]
- 29.Friedberg I, Godzik A. Connecting the protein structure universe by using sparse recurring fragments. Structure. 2005;13:1213–1224. doi: 10.1016/j.str.2005.05.009. [DOI] [PubMed] [Google Scholar]
- 30.Kolodny R, Petrey D, Honig B. Protein structure comparison: implications for the nature of ‘fold space’, and structure and function prediction. Curr Opin Struct Biol. 2006;16:393–398. doi: 10.1016/j.sbi.2006.04.007. [DOI] [PubMed] [Google Scholar]
- 31.Taylor WR. Evolutionary transitions in protein fold space. Curr Opin Struct Biol. 2007;17:354–361. doi: 10.1016/j.sbi.2007.06.002. [DOI] [PubMed] [Google Scholar]
- 32.Cuff A, Redfern OC, Greene L, Sillitoe I, Lewis T, Dibley M, Reid A, Pearl F, Dallman T, Todd A, Garrat R, Thornton J, Orengo C. The CATH hierarchy revisited-structural divergence in domain superfamilies and the continuity of fold space. Structure. 2009;17:1051–1062. doi: 10.1016/j.str.2009.06.015. [DOI] [PMC free article] [PubMed] [Google Scholar]
- 33.Pascual-Garcia A, Abia D, Ortiz AR, Bastolla U. Cross-over between discrete and continuous protein structure space: insights into automatic classification and networks of protein structures. PLoS Comput Biol. 2009;5:e1000331. doi: 10.1371/journal.pcbi.1000331. [DOI] [PMC free article] [PubMed] [Google Scholar]
- 34.Lupas AN, Koretke KK. Evolution of protein folds. In: Peitsch MC, Schwede T, editors. Computational structural biology: methods and applications. Hackensack, N.J., London: World Scientific; 2008. pp. 131–152. [Google Scholar]
- 35.Sadreyev RI, Kim BH, Grishin NV. Discrete-continuous duality of protein structure space. Curr Opin Struct Biol. 2009;19:321–328. doi: 10.1016/j.sbi.2009.04.009. [DOI] [PMC free article] [PubMed] [Google Scholar]
- 36.Chou KC, Zhang CT. Prediction of protein structural classes. Crit Rev Biochem Mol Biol. 1995;30:275–349. doi: 10.3109/10409239509083488. [DOI] [PubMed] [Google Scholar]
- 37.Ponting CP, Russell RB. Identification of distant homologues of fibroblast growth factors suggests a common ancestor for all beta-trefoil proteins. J Mol Biol. 2000;302:1041–1047. doi: 10.1006/jmbi.2000.4087. [DOI] [PubMed] [Google Scholar]
- 38.Liang PH, Ko TP, Wang AH. Structure, mechanism and function of prenyltransferases. Eur J Biochem. 2002;269:3339–3354. doi: 10.1046/j.1432-1033.2002.03014.x. [DOI] [PubMed] [Google Scholar]
- 39.Chaudhuri I, Soding J, Lupas AN. Evolution of the beta-propeller fold. Proteins. 2008;71:795–803. doi: 10.1002/prot.21764. [DOI] [PubMed] [Google Scholar]
- 40.Arnold T, Poynor M, Nussberger S, Lupas AN, Linke D. Gene duplication of the eight-stranded beta-barrel OmpX produces a functional pore: a scenario for the evolution of transmembrane beta-barrels. J Mol Biol. 2007;366:1174–1184. doi: 10.1016/j.jmb.2006.12.029. [DOI] [PubMed] [Google Scholar]
- 41.Remmert M, Linke D, Lupas AN, Soding J. HHomp—prediction and classification of outer membrane proteins. Nucleic Acids Res. 2009;37:W446–W451. doi: 10.1093/nar/gkp325. [DOI] [PMC free article] [PubMed] [Google Scholar]
- 42.Brennan RG. The winged-helix DNA-binding motif: another helix-turn-helix takeoff. Cell. 1993;74:773–776. doi: 10.1016/0092-8674(93)90456-z. [DOI] [PubMed] [Google Scholar]
- 43.Grishin NV. KH domaone motif, two folds. Nucleic Acids Res. 2001;29:638–643. doi: 10.1093/nar/29.3.638. [DOI] [PMC free article] [PubMed] [Google Scholar]
- 44.Alva V, Ammelburg M, Soding J, Lupas AN. On the origin of the histone fold. BMC Struct Biol. 2007;7:17. doi: 10.1186/1472-6807-7-17. [DOI] [PMC free article] [PubMed] [Google Scholar]
- 45.Biegert A, Soding J. Sequence context-specific profiles for homology searching. Proc Natl Acad Sci USA. 2009;106:3770–3775. doi: 10.1073/pnas.0810767106. [DOI] [PMC free article] [PubMed] [Google Scholar]
- 46.Frickey T, Lupas A. CLANS: a Java application for visualizing protein families based on pairwise similarity. Bioinformatics. 2004;20:3702–3704. doi: 10.1093/bioinformatics/bth444. [DOI] [PubMed] [Google Scholar]
- 47.Biegert A, Mayer C, Remmert M, Soding J, Lupas AN. The MPI Bioinformatics Toolkit for protein sequence analysis. Nucleic Acids Res. 2006;34:W335–W339. doi: 10.1093/nar/gkl217. [DOI] [PMC free article] [PubMed] [Google Scholar]