

Abstract
The present studies were designed to determine whether mice heterozygous for deletion of β-ENaC exhibited defects in Na+/K+ transport and blood pressure regulation. In response to an acute KCl infusion, +/− mice developed higher serum [K+] and excreted only 40% of the K+ excreted by +/+ mice. After 6 days on a low (0.01%)-Na+ diet, the cumulative Na+ excretion from days 3-6 was greater for +/− mice. This low-Na+ diet caused higher serum [K+] and lower K+ excretion rates in +/− mice than in +/+ mice, but the rectal potential differences were not different. Analyses of mRNA from mice on this diet showed the expected ∼50% reduction of β-ENaC in kidney and colon of +/− mice. Unexpectedly, the level of γ-ENaC mRNA was similarly reduced. NHE3 mRNA was ∼30% higher in +/− mice whereas mRNA of the Na-K-2Cl cotransporter was not different. Also unexpectedly, the amount of β-ENaC proteins was similar in both groups of mice but there was a reduction of one form of γ-ENaC in +/− mice. These experiments demonstrate that mice heterozygous for β-ENaC have a small but detectable defect in their ability to conserve Na+ and a more readily apparent defect in the ability to secrete K+.
Keywords: sodium, homeostasis, heterozygote, low-Na+ diet
The epithelial Na+ channel (ENaC) constitutes the rate-limiting step for Na+ transport across tight epithelia and is the principle target of aldosterone. Composed of three subunits, ENaC is localized to the apical membrane where it allows Na+ to enter the cell. The activity of the Na+/K+ pump on the basolateral membrane, working in concert with ENaC, affects transepithelial Na+ transport. ENaC function has been extensively studied since its molecular nature was identified (4). Several reviews have been written on aspects of its structure, function, and regulation (1, 13, 25, 31) as well as many aspects of its dysfunction (27, 30, 32).
The critical importance of ENaC in water and salt homeostasis is illustrated by mutations affecting the channel subunits. Mutations in the cytoplasmic COOH terminus of the β- and γ-subunits cause constitutive activation of ENaC, leading to the autosomal dominant Liddle's syndrome (14, 29). This disorder is characterized by hypertension, increased renal Na+ absorption, and low rates of aldosterone secretion. Loss-of-function mutations in any of the subunits cause pseudohypoaldosteronism type 1 (PHA-1), with the primary features of renal salt wasting and hyperkalemic acidosis despite high aldosterone levels (5, 34).
Murine models of PHA-1 have been produced through gene targeting and transgenic approaches. Homozygous deletion of any one of the three subunits causes death within 48 h of birth (2, 17, 22). The cause of death in these mice is different, as α-ENaC −/− neonates die with respiratory distress secondary to an inability to clear liquid from the lungs, and β- and γ-ENaC −/− mice die from hyperkalemia. These results suggest that in the neonatal period, α-ENaC is a critical determinant of pulmonary function, whereas β- and γ-ENaC are required for appropriate renal function. The prevailing wisdom is that a fully functional ENaC requires all three subunits, and so the basis for the apparent phenotypic difference among these homozygous null mice remains unclear.
Because the early lethality prevents detailed physiological evaluation of defective ENaC function, other approaches have been attempted to investigate less severe phenotypes. Hummler et al. (18) attempted rescue of the α-ENaC −/− mouse by expressing α-ENaC via a transgene driven by the constitutive CMV promoter. The surviving mice had sufficient ENaC activity in lung to prevent neonatal lethality but developed a PHA-1 phenotype, suggesting that α-ENaC expression in the connecting tubule and/or collecting duct was important for normal acid-base and electrolyte homeostasis.
A mouse with defective β-ENaC function was generated in an attempt to produce a Liddle's mouse (24). It turned out that the targeted modification produced instability in the β-ENaC transcript, resulting in only 4% of normal expression. These mice also exhibited a PHA-1 phenotype but not the neonatal mortality observed in complete β-ENaC-deficient mice (22). These results make the point that only a small amount of one subunit (in the presence of normal amounts of the other two) is sufficient to prevent lethality, and on a normal-NaCl diet can sustain a nearly normal phenotype.
The purpose of the present studies was to test the hypothesis that mice heterozygous for the deletion of β-ENaC subunit have inadequate adaptational response to altered physiological or pathological conditions. Our predictions were that the phenotype would be subtle and only detectable under conditions of perturbations in homeostasis. We hypothesized that under normal conditions, the mice would be slightly volume contracted as evidenced by a high plasma [aldosterone], would not be able to conserve Na+ normally in response to a very low Na+ diet, and would have a defect in their ability to excrete K+. The results show that two of these predictions were correct.
Materials and Methods
Experimental mice
Mice heterozygous for the deletion of the mouse β-ENaC gene were constructed by deleting the first exon via gene targeting, as described previously (22). To ensure that the study mice were genetically equivalent, we bred male heterozygous 129 strain mice to C57BL/6 female mice. Only the first-generation hybrid (F1) mice were used in this study, as they all will have one set of chromosomes from 129/SvJ strain, with either normal or deleted β-ENaC gene, and another set of chromosomes from C57BL/6 strain with normal β-ENaC gene. Genotyping was performed as described (22).
The numbers of mice used in each experiment are shown on the figure and in the figure legend. All mice were fed standard mouse chow (LM-485, Harlan-Teklad Premier Laboratory Diets with 0.3% Na+, Madison, WI), except for mice on the low-Na+ diet, and water ad libitum. Mice on the low-Na+ diet (Custom Research Diet TD90228 with 0.01% Na+; Harlan-Teklad) experiment were housed in metabolic cages with free access to nano-pure water. The low-salt diet protocol included a 2-day equilibration period on a normal diet, then changing to the low-Na+ diet for 6 more days. Food and water consumption, body weight, and urine production were recorded daily. To facilitate urine collection, the collection funnel was coated with silicone and 50 μl of water-saturated mineral oil were placed in the collection tube. Care of the mice used in the experiments exceeded the standards set forth by National Institutes of Health in their guidelines for the care and use of experimental animals. All procedures were approved by the University Animal Care and Use Committee at the University of Iowa.
Surgery
For chronic catheterization, mice were anesthetized with Avertin (240 mg/kg body wt ip), shaved, and prepped with a 70% alcohol solution. Sterile carotid artery and jugular vein catheters, 0.040-mm outer diameter × 0.025-mm inner diameter and 0.033 outer diameter × 0.014 inner diameter, respectively (Microrenathane; Braintree Laboratories, Braintree, MA), were inserted with the aid of a dissecting microscope. Catheters were flushed with 50 μl of sterile diluted heparin solution in saline (10 U/ml), tunneled subcutaneously to the back of the neck, and fixed to skin with a plastic sleeve. A stainless steel bladder catheter (10 × 1-mm outer diameter) was placed suprapubically for urine collection for some experiments. The mice were placed on a warming pad (39°C) throughout the surgical procedure and postoperatively until fully awake. At least 24 h of recovery were allowed before any experimental manipulation.
Blood and urine collection
For Na+ and K+ analyses, 40 μl of blood were collected through the arterial catheter and placed in 1.5-ml microfuge tubes. The samples were incubated at room temperature for 60 min, centrifuged at 13,000 rpm for 5 min, and the serum-frozen at −80°C. For plasma aldosterone measurement, ∼0.1 ml of fresh blood were collected and placed in chilled tubes containing 1.0 μl of 0.25 M EDTA. The specimen was immediately spun in a prechilled centrifuge at 13,000 rpm for 5 min, and the plasma sample was immediately frozen at −80°C. Urine was collected via the catheter, the volume measured, and then frozen at −80°C until electrolyte (Na+ and K+) analyses.
For mice without cannulations, blood was collected via retro-orbital venous plexus using a microhematocrit blood tube, and urine was collected via metabolic cages or collected directly. Serum or plasma was separated as above.
Blood pressure monitoring
The mice were conscious and freely moving in their cage for the blood pressure assessments. Food and water were removed from the cage during the measurements. The catheters were flushed with a dilute heparin solution. Blood pressure was measured on a Grass model 7 polygraph using Cobe transducers.
The blood pressure response to ANG II (Scripps Laboratories, San Diego, CA) infusion was measured by infusing different concentrations in 30 μl of saline via the jugular vein over 20 to 30 s. Blood pressure was monitored for 30 min or until it returned to baseline and the peak blood pressure was recorded. There was a rest period of 60 min between each dosage. The blood pressure changes during saline infusion were measured continuously and we report the peak value as well as the time to reach this value.
NaCl and KCl infusion
Isotonic volume expansion (5% body wt) was conducted by infusing normal saline solution (0.9%) into the venous catheter for 30 min with an infusion pump (model PHD 2000, Harvard Apparatus, Holliston, MA). The infusion rate was determined by the total volume infused, divided by 30 min. Blood pressure, urine output, and the indicated blood samples were determined over the following 6 h. Infusion of a K+ load was conducted using a similar protocol except that 130 mM KCl was added to the infused saline solution.
Biochemical analyses
Serum and urine Na+ and K+ concentrations were determined using a flame photometer (IL943 Automatic flame photometer, Instrumentation Laboratory, Lexington, MA). Aldosterone radioimmunoassay was performed using the Coat-A-Count kit (Diagnostic Products, Los Angeles, CA).
Rectal potential difference
The rectal potential difference (PD) was measured using the method described by Wang et al. (37). Mice were anesthetized with an intraperitoneal injection of Avertin (240 mg/kg body wt) and placed on a 37°C surface. A saline-filled 20-gauge needle was placed into the back muscle. Polyethylene tubing (1.6-mm diameter) filled with saline was used to connect the needle to a calomel electrode. Saline-filled polyethylene tubing (∼1-mm diameter) was placed 3–5 mm into the rectum and connected to a second calomel electrode for measurement of the PD. A second polyethylene tube was placed 3–5 mm into the rectum to allow injection of saline or 100 μM amiloride in saline. After stabilization of the measured PD (0.5–1.5 min), injection of saline (∼0.2 ml) did not alter the PD value, but injection of amiloride rapidly reduced the PD values. Measurements were recorded by a computer at 2-s intervals using a CIO-AD16Jr analog-digital data-acquisition system.
RNase protection assay
Probes for mouse α-, β-, and γ-ENaC were prepared as previously described (23). These probes yielded protected fragments of 125, 265, and 191 nt, respectively. The probes for the mouse NHE3, NaCl cotransporter, and Na-K-2Cl cotransporter were constructed using PCR amplification of the appropriate segments and cloned into pCR-BluntII-TOPO (Invitrogen). Primers for NHE3 were 5′-CTT CAT GTT CCT GGG CAT CT-3′ and 5′-ATG GCT GAG AGG ATG TGG TC-3′. Primers for the Na-K-2Cl cotransporter were 5′-CGC AAT CAA AGA CAA CGA GT-3′ and 5′-AAC ATC GAT CGT GCC TTT TC-3′. These PCR-cloned constructs were linearized with SpeI and antisense riboprobes were synthesized using T7 polymerase yielding protected lengths of 423 and 204 nt, respectively. Primers for the NaCl cotransporter were 5′-ACC AAT GGC AAG GTC AAG TC-3′ and 5′-TTC AGA TGC TGG GAT CAG TG-3′. The PCR-cloned construct was linearized with XhoI and an antisense riboprobe was synthesized using SP6 polymerase yielding a protected length of 348 nt. The p-Tri-β-actin-mouse probe was purchased from Ambion and further digested with HinfI. An antisense riboprobe was synthesized with T3 polymerase, yielding a protected fragment of 99 nt.
Total RNA aliquots of 25 μg were extracted from mouse kidney and colon at the end of the low-Na+ diet experiment using described methods (6, 36). Antisense riboprobes for the ribonuclease protection assay (RPA) were synthesized from the appropriate constructs using the MAXIscript in vitro transcription kit (Ambion) with the nonisotopic incorporation of Biotin-14-CTP (GIBCO/BRL). The amount of biotin-labeled CTP was adjusted to give the highest possible specific activity for all the constructs. The hybridization reaction was conducted as previously described (19) using 1 ng of each of the riboprobes. The final reaction products were subjected to electrophoresis through a 5% denaturing polyacrylamide/8 M urea gel buffered with Tris borate for 2.5 h at 250 V and transferred to a nylon membrane (BrightStar Plus, Ambion) by using a semidry electroblotter (Fisher, Itasca, IL). The membrane was subsequently ultraviolet cross-linked (UV Stratalinker, Stratagene), and development of the protected RNA fragments was conducted by using the BrightStar Biodetect nonisotopic detection kit (Ambion). Bands were detected using Optichemi BioImaging System and were analyzed by densitometry using the Labworks software. The relative amount of each transcript was determined by normalizing its density with that of actin.
Western blot analysis
Kidneys were rapidly frozen and stored at −80°C until used. Tissue was homogenized in 250 mM sucrose and 10 mM triethanolamine, pH 7.6, with protease inhibitors. Homogenized samples were mixed 4:1 with Laemmli buffer containing 3.75 g SDS, 15 ml glycerol, 2.5 ml 1 M Tris (pH 6.8), 30 mg DTT, and bromophenol blue in 50 ml of water. Samples of 500 μg protein were separated by electrophoresis through 8% SDS-PAGE, transferred to a nitrocellulose membrane, rinsed with PBS, and blocked with 5% nonfat milk and 0.05% Tween in PBS for 30 min. Membranes were incubated overnight with the appropriate antibody at a dilution of 1:2,000 in Tween-PBS with 0.1% albumin and 0.01% NaN3, washed, and incubated with goat anti-rabbit (Pierce) at 1:50,000. The antibodies directed against the three ENaC subunits were obtained from Dr. M. Knepper and have been fully characterized (20). Images were developed with Super Signal Femto (Pierce) and quantitated using the Optichemi BioImaging System. Blots were also reprobed for the α1-subunit of Na-K-ATPase. Because this analysis demonstrated equal loading, we report only the relative values for the abundance of each ENaC subunit.
Statistics and data analysis
Data analysis between different groups of animals was performed by unpaired Student's t-test. ANOVA was used for analysis with repeated measurements (see Fig. 2). We considered P values <0.05 statistically significant. All values are expressed as means ± SE.
Fig. 2.
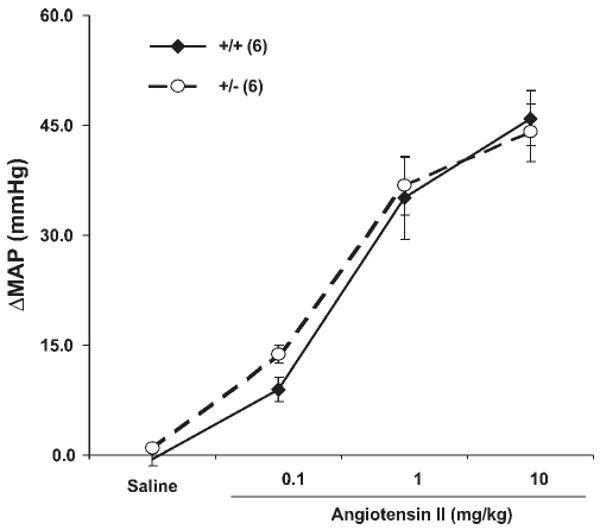
Blood pressure response to infusion of ANG II. Different amount of ANG II in 30 μl saline was injected in 20 to 30 s. Blood pressure was monitored for 30 min or until it returned to normal and the peak blood pressure was recorded. There was a rest period of 60 min between each dosage. Responsiveness to infused ANG II was similar between β-ENaC +/+ and +/− mice; n = 6 mice in each group.
Results
We reported previously that there was no obvious difference in phenotype between mice heterozygous for β-ENaC deletion and normal mice under standard chow diet (22). There were no differences in body weights and growth rate between the two groups of mice. Serum values for Na+ and K+ were not different between normal and heterozygous mice. Food and water consumption and Na+ and K+ excretion were not different between the two groups.
To evaluate their volume status, we measured plasma aldosterone levels in wild-type and their heterozygous littermates. As shown in Fig. 1A, there was no difference in these levels in either the neonatal period or after weaning. We also measured blood pressure in 3-mo-old mice and detected no difference (Fig. 1B). These data suggest that if the heterozygous mice were volume contracted, it must be to only a modest degree.
Fig. 1.
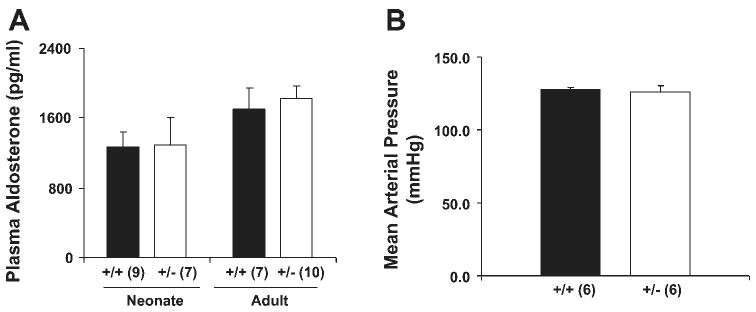
Mice heterozygous for the deletion of β-ENaC gene have normal serum aldosterone levels and normal blood pressure. Serum aldosterone (A) and mean arterial pressure (B) of β-ENaC +/+ and +/− mice. Serum samples were taken from 12- to 18-h-old pups (neonate) and 3-mo-old mice (adult) and were analyzed for aldosterone using RIA. Number of samples in each group is shown in parentheses. There is no difference between β-ENaC +/+ and +/− mice.
Blood pressure response to stimulation
We tested the blood pressure sensitivity to ANG II infusion in conscious mice, reasoning that if the heterozygotes were volume contracted, they might display a resistance to ANG II, much like patients with Bartter syndrome (3). Figure 2 shows that the responsiveness to infused ANG II over a wide dose range was similar in wild-type and heterozygous mice. The heterozygous mice showed no tendency to being resistant to infused ANG II. In fact, at the lowest dose of infusion, the heterozygous mice tended to have a larger blood pressure response, although the difference was not significant.
As another test for the possibility that +/− mice might be volume contracted, we measured the blood pressure changes in response to an infusion of isotonic saline solution (5% of body wt – ∼225 μmol) over 30 min. We reasoned that if the +/− mice were volume depleted, the magnitude of the increase in blood pressure might be lower than +/+ mice. The blood pressure response to an infusion of isotonic saline solution is shown in Fig. 3; both wild-type and heterozygous mice had similar increases in mean arterial pressure (MAP) as well as systolic and diastolic pressures (Fig. 3A, and data not shown). However, the time it took to reach the peak blood pressure change was significantly different between these two groups (20.38 ± 2.36 vs. 47.42 ± 3.23 min for wild-type mice and heterozygotes, respectively, with a P < 0.0002; Fig. 3B). Thus it took more than twice as long for heterozygotes to reach their peak blood pressure changes. Moreover, for wild-type mice, the maximum response was reached before the end of infusion, while for heterozygotes the maximum response was reached well after the end of saline infusion.
Fig. 3.
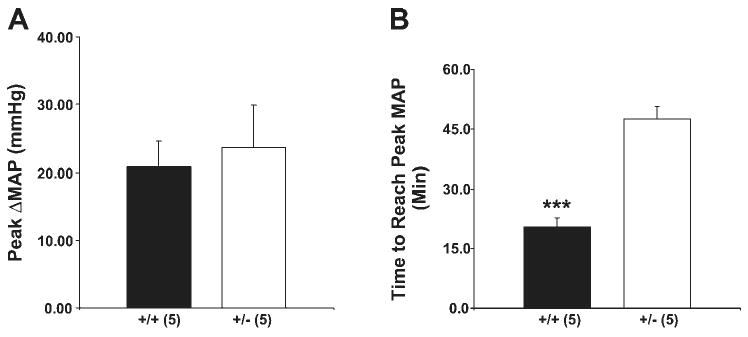
Blood pressure changes during volume expansion. A: infusion of isotonic saline (5% body wt) over 30 min produced the same increase in mean arterial pressure (MAP) in β-ENaC +/− and +/+ mice. B: time to reach the maximum blood pressure change was different between these two groups and it took more than twice as long for β-ENaC +/− to reach their peak MAP changes; n = 5 mice in each group. ***P < 0.0002.
Response to infusion of K+
We tested the response to K+ infusion by adding 130 mM/l KCl to the isotonic NaCl infusion (for an average infusion of 195 μmol KCl). This protocol was used to ensure that there was adequate Na delivery to the distal nephron so K+ secretion would be maximal. In addition, the data in Fig. 3 showed that the mice tolerated the isotonic saline infusion well. As shown in Fig. 4, the Na+ excretion rates were not different between the two groups. Serum [Na+] was not different between the two groups and did not change with the infusion (data not shown).
Fig. 4.
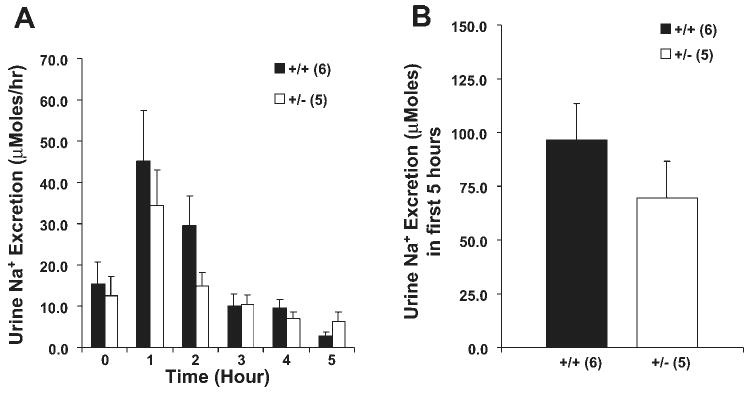
Sodium response following K+ infusion. KCl (130 mM) in a volume of saline determined to be 5% of body weight was infused in 30 min. Hourly urine Na+ excretion (A) and cumulative urine Na+ excretion (B) in the first 5 h. Time 0 was before the start of infusion. Urine Na+ excretion was not different between the β-ENaC +/+ and +/− mice; n = 6 +/+ and 5 +/− mice.
In contrast to the lack of difference in serum [Na+] and Na+ excretion, there were significant differences in K+ metabolism. As shown in Fig. 5, serum [K+] was higher in +/− mice 2 and 3 h after infusion. Whereas +/+ mice excreted more than 50% (103/195 μmol) of the infused K+ in 5 h, +/− mice excreted less than 20% (33/195 μmol) of the infused K+ despite the fact that +/− mice had higher serum [K+].
Fig. 5.
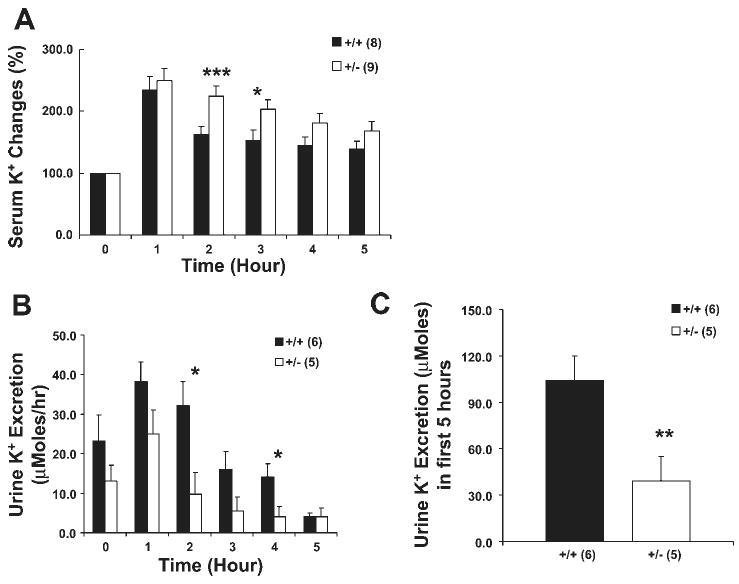
Potassium response following K+ infusion. A: serum [K+] was higher in +/− mice compared with +/+ mice. Hourly urine K+ excretion (B) and cumulative urine K+ excretion (C) in the first 5 h. Time 0 was before the start of infusion. Urine K+ excretion was lower in +/− mice compared with +/+ mice. Number of mice in each group is shown in parentheses. Mice are the same as reported in Fig. 4. *P < 0.04; **P < 0.02; ***P < 0.01 compared with +/+ controls.
Response to dietary Na+ restriction
The above results demonstrate that heterozygous mice have a decreased ability to excrete an acute K+ load, but do not demonstrate a significant difference in excreting an acute Na+ load. Because the response to an acute Na+ load may be governed by several competing regulatory functions, we tested the ability of these mice to conserve Na+ in response to dietary Na+ restriction. When the diet was abruptly changed from one containing 0.3% Na+ to one containing 0.01% Na+, there was no difference in food consumption, water intake, body weight, or serum [Na+] or urine osmolality (data not shown). While both groups of mice demonstrated good ability to conserve Na+ under these conditions, +/− mice showed a modest, but significant, impairment in their ability to maximally conserve Na+ (P < 0.04; Fig. 6).
Fig. 6.
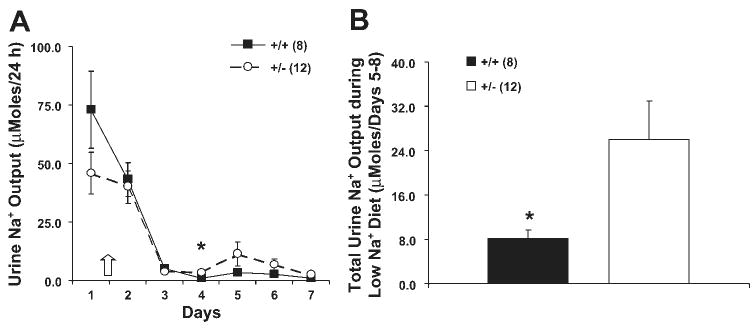
Na+ conservation in response to a very low-Na+ diet. Mice were placed in metabolic cages and acclimated to a normal diet for 2 days; then the diet was changed to a very low-NaCl diet. A: urine Na+ fell following the reduction in dietary Na+. B: total amount of Na+ excreted in the last 4 days during low-Na+ diet. The β-ENaC +/− mice excreted greater than 3 times more Na+ than +/+ mice. *P < 0.04. Number of samples in each group is shown in parentheses. Arrow indicates initiation of low-Na+ diet. Filled bars and squares indicate β-ENaC +/+ mice; open bars and circles indicate β-ENaC +/− mice.
Figure 7 displays the effects of Na+ restriction on K+ metabolism. The +/− mice had a significantly higher serum [K+] in response to the low-Na+ diet, whereas the +/+ mice showed no change. Despite the increase in serum [K+], and no difference in food or water intake, +/− mice showed a modest reduction in K+ excretion. This difference was evident in the latter stages of adaptation to the low-Na+ diet, days 5-8.
Fig. 7.

Effects of a low-Na+ diet on K+ metabolism. Mice are the same as reported in Fig. 6. A: serum K+ rose to a greater extent in β-ENaC +/− mice than in +/+ mice during low-Na+ diet. The change in serum K+ in +/+ mice was not significant. B: K+ excretion was lower in β-ENaC +/− mice after 5 days of low-Na+ diet. C: total amount of K+ excreted in the last 4 days during low-Na+ diet treatment was lower in β-ENaC +/− mice. Arrow indicates initiation of low-Na+ diet. *P < 0.04.
We further assessed the response to the low-Na+ diet by measuring plasma [aldosterone]. As expected, Na+ restriction produced a marked increase (Fig. 8A), but there was no difference between the two groups of mice. As another functional assessment of ENaC activity, we measured rectal PD in mice following 7–8 days of Na+ restriction. Both wild-type and heterozygous mice fed normal chow had very small or no detectable amiloride-sensitive PD (data not shown). Figure 8B shows that mice on dietary Na+ restriction had a large amiloride-sensitive PD, but there was no difference between groups.
Fig. 8.
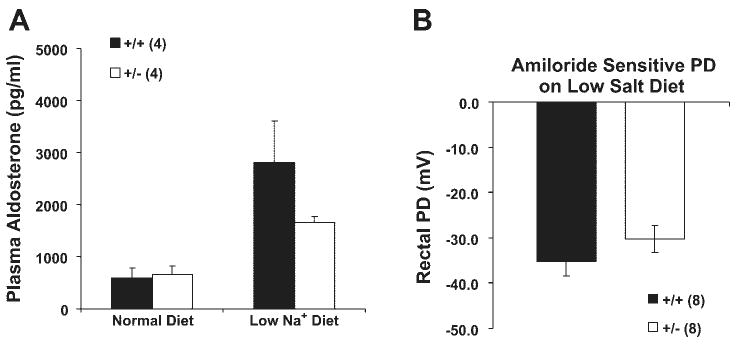
Plasma aldosterone and rectal potential difference (PD) in wild-type and β-ENaC +/− mice after a low-Na+ diet. A: plasma aldosterone levels before and after a low-Na+ diet. B: amiloride-sensitive rectal PD after a week of the low-Na+ diet. There were no differences between β-ENaC +/+ and +/− mice in either measurement.
To assess whether we could detect compensatory changes in Na+ transporters in response to the β-ENaC heterozygous state, we conducted RPA analysis of the mRNA for each ENaC subunit and the three major Na+ transporters in kidneys from mice on low-sodium diet. As expected (Fig. 9), the β-ENaC mRNA level in heterozygous mice was 50% of that in control mice. Unexpectedly, the mRNA levels of α- and γ-ENaC were also reduced in heterozygotes. Also unexpected was a small but significant decrease of the level of mRNA for the Na/Cl cotransporter (TSC). The level of mRNA for the Na-K-2Cl cotransporter (BSC1/NKCC2) was not different between these two groups. There was a significant increase of the level of NHE3 in heterozygous mice, demonstrating the only compensation in Na+ transporters at the mRNA level. We also measured ENaC mRNA in colon (Fig. 9D). As expected, β-ENaC mRNA was about half the control value. However, similar to the results in kidney, both α- and γ-ENaC mRNA abundance was decreased. This result suggests that partial reduction in β-ENaC mRNA abundance produces secondary effects on the other subunits resulting in lower overall ENaC mRNA abundance.
Fig. 9.
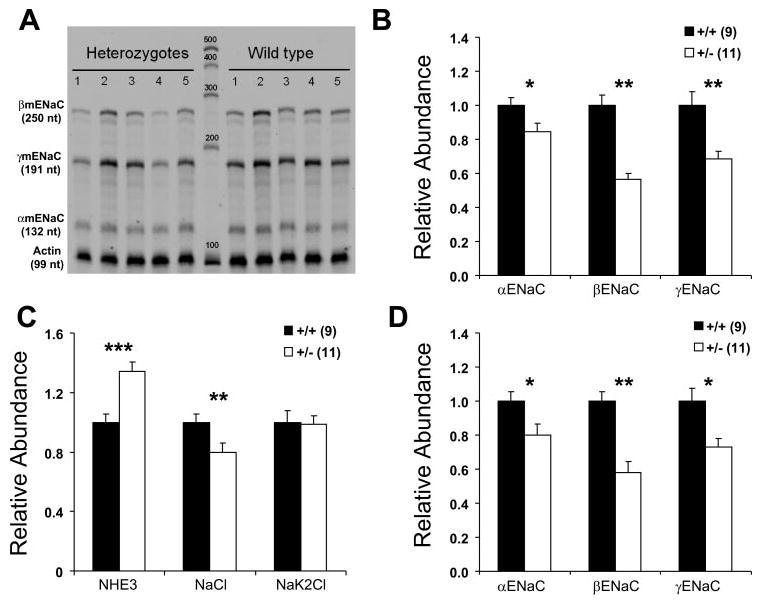
mRNA levels of ENaC subunits and other Na+ transporters during low-Na+ diet. Quantitative analysis of RNase protection assay used to determine mRNA levels. A: representative RPA autoradiograph of ENaC subunits in kidney. Left: size of protected fragments (in nucleotides). B: ENaC subunit abundance from whole kidney. C: NHE3, NaCl cotransporter, and Na-K-2Cl cotransporter abundance from whole kidney. D: ENaC subunit abundance from colon. β-ENaC +/− mice have lower mRNA levels (in both kidney and colon) of all 3 ENaC subunits (B and D). In addition, β-ENaC +/− mice have higher NHE3 mRNA levels and lower NaCl cotransporter mRNA levels than wild-type mice (in kidney). Values for each transporter were normalized to actin. Numbers in parentheses are numbers of mice used for each determination. *P < 0.05; **P < 0.01; ***P < 0.002 compared with β-ENaC +/+ controls.
We assessed the ENaC protein levels in kidneys from mice fed a low-NaCl diet for 7 days to maximize our ability to detect differences. As shown in Fig. 10A, α-ENaC levels (both lower and higher molecular length bands) were similar in abundance. Surprisingly, there was no difference in the abundance of β-ENaC protein. Analysis of the γ-ENaC subunit showed a band at ∼100 kDa and another at ∼85 kDa. To determine whether these bands corresponded to the two γ-ENaC bands that appear in kidneys of rats fed a low-NaCl diet, we fed C57B/6 mice a high-, a normal-, or a low-NaCl diet for 7 days and analyzed the γ-ENaC proteins from the kidneys. As shown in Fig. 10B, the 85-kDa band varied directly with dietary NaCl, whereas the 100-kDa band was unchanged. Thus it appears that the 100-kDa band is not specific for γ-ENaC, whereas the 85-kDa band corresponds to that found in rat, as the changes in the density of this band in response to dietary NaCl are similar. Interestingly, we detected only a marginally faint band at ∼70 kDa in mouse kidney on a low-NaCl diet. These results are different from those found in rats (Ref. 20, and data not shown). The reasons for these species differences are not clear.
Fig. 10.
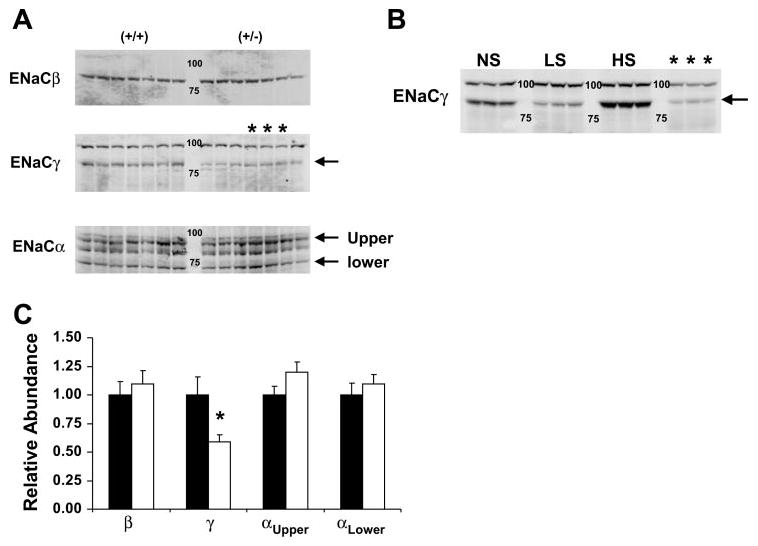
Protein levels of ENaC subunits in kidney. A: immunoblot of whole kidney tissue from 14 mice (7 +/+ and 7 +/−) fed a low-NaCl diet for 7 days. Arrows in the α-ENaC panel show the 2 bands corresponding to α-ENaC detected in M1 cells. The third band is nonspecific found in kidney. The arrow in the γ-ENaC panel is the 85-kDa band previously shown to be influenced by dietary NaCl in rats (20). B: immunoblot of γ-ENaC protein from kidneys harvested from C57B/6 mice fed a normal (NS), low (LS), or high (HS) NaCl diet for 7 days. Lanes marked with * contain samples from the corresponding lanes in A. Arrow indicates the 85-kDa band reported in rat kidney. C: quantitative assessment of the amount of α-, β-, and γ-ENaC protein in +/+ and +/− mice fed a low-NaCl diet (A). All ENaC bands are expressed relative to control +/+ values. *P < 0.01 compared with +/+. Filled bars, +/+ mice; open bars, +/− mice.
The quantitative assessment of the ENaC proteins in the +/+ and +/− mice is shown in Fig. 10C. In contrast to our expectations, the β-ENaC protein was the same in the two groups of mice while the γ-ENaC protein was lower in the +/− mice. The abundance of the γ-ENaC protein followed the abundance of the γ-ENaC mRNA, while the abundance of the β-ENaC protein did not.
Discussion
Mice heterozygous for the deletion of several channels and transporters involved in water and salt transport in the kidney, such as α-ENaC (17), γ-ENaC (2), NHE3 (28), AQP1 (7), AQP2 (39), and CLCNK-1 (21), have been reported to have no detectable phenotype. However, concluding that the heterozygous state has no phenotype in the absence of a physiological stress may be premature. Such an examination of mice heterozygous for the kidney-specific Na-K-2Cl cotransporter (BSC1 or NKCC2) has been undertaken (35). In this case, functions predicted to be partially defective, such as maximum concentrating ability, response to furosemide, and ability to respond to an acid load, were not different from wild-type mice. The lack of a phenotype in this heterozygous model was presumably due to the unexpected (posttranscriptional) compensation that ultimately produced no difference in protein expression of the Na-K-2Cl cotransporter. Thus a careful analysis of the heterozygous state can provide potentially important clues regarding how the kidney can (or cannot) compensate for partially defective transporter biosynthesis.
Based on the extensive literature examining the physiological role of ENaC, we predicted that a partial defect in its function would produce modest reduction in extracellular volume and blood pressure on a normal diet, a modest reduction in the ability to excrete K+, and a blunted ability to conserve Na+ in response to a very low-Na+ diet. The results of the present results support the latter two predictions but do not generally support the first.
The lack of phenotype in the β-ENaC heterozygous mice on a normal diet is perhaps not surprising given the modest role ENaC seems to play in absorbing Na+ in rodents on a Na+-replete diet (8, 10). It is well established that the renal capacity to compensate for reduced function of a specific Na+ transporter is substantial. The kidney's ability to achieve a new steady state within a few days of initiating diuretic therapy is an example of this compensatory phenomenon. The lack of a difference in blood pressure or plasma [aldosterone] (Fig. 1) and sensitivity to ANG II infusion (Fig. 2) between wild-type and heterozygous mice support the lack of difference in extracellular fluid volume on a normal diet.
Evidence that the heterozygous mice might be different in their ability to handle Na+ was suggested by the delay in the time to peak blood pressure following NaCl infusion (Fig. 3) and the subtle difference in the ability of the heterozygous mice to conserve the last few millimoles of Na+ after a week on the low-Na+ diet (Fig. 6). These differences in function did not become manifest by an index of ENaC activity, the rectal PD (Fig. 8). We speculate that if the very low Na+ diet had been extended for months, the compensatory differences might have been more readily detectable. We note that these results contrast with those reported by Rubera et al. (26) where complete elimination of the α-ENaC subunit in the collecting duct did not cause any impairment in the ability to conserve Na+. The reason for this difference is not clear at the present time.
The difference in the blood pressure response to infusion of normal saline (Fig. 3) raises some interesting questions. Whereas the maximum increase in blood pressure was the same in both groups, the time it took to reach that peak response was longer in the +/− mice. We propose two possible explanations. First, it is possible that the extracellular fluid volume of +/− mice is actually less than +/+ mice, despite the fact that other estimates of volume did not reveal a difference. Such a subtle difference might produce a difference in the blood pressure response to saline infusion, although we are not aware of specific precedents for this phenomenon. A second possibility is that modest disruption of β-ENaC may have effects on more systems than the kidney and colon. Both β- and γ-ENaC subunits are expressed in aortic baroreceptors (9) and in vascular smooth muscle cells (19). Disruption of β-ENaC might induce changes in the mechanosensitive response to volume expansion thus producing the delay in the peak blood pressure response.
In contrast to the very mild phenotype in Na+ metabolism, the effect on K+ metabolism was less subtle. Disposition of an acute infusion of KCl was impaired in the heterozygous mice (Fig. 5), and a low-Na+ diet produced increases in serum [K+] while decreasing K+ excretion (Fig. 7). These data support the notion that K+ secretion (and thus excretion) is critically dependent on the activity of ENaC. The interdependency of ENaC activity and K+ secretion occurs in the principal cells of the cortical collecting duct (33) and connecting tubule (11, 12). Thus our ability to detect changes in K+ metabolism with subtle reduction in function of ENaC probably rests largely on the fact that ENaC plays a relatively larger role in K+ excretion than it does in Na+ absorption.
The results of these studies can be compared with another genetic manipulation that causes a moderate defect in Na+ absorption and K+ secretion: inactivation of Sgk1. As shown by Wulff et al. (38), the Sgk1 null mouse displays higher [aldosterone], a greater impairment in Na+ retention in response to a low-Na+ diet, a more negative PD of perfused collecting ducts from null mice on a low-Na+ diet, and an impaired K+ secretary response (15). These results, together with ours, are consistent with the role of ENaC in the distal nephron in regulating Na+ homeostasis and K+ secretion.
Two unexpected results emerged from our analysis of ENaC expression. While we expected to see a 50% reduction in β-ENaC mRNA, we did not predict a reduction in γ-ENaC mRNA (Fig. 9). We found similar effects on all three ENaC subunit mRNA levels in both kidney and colon, supporting the idea that there is an interdependence of the β- and γ-ENaC subunits in mRNA expression. We are not certain how this interaction might be manifest, but we note that these two subunits reside next to each other on chromosome 7 of the mouse. In fact, these two subunits have similar positions in the genomes of all mammals so far examined. We hypothesize that by deleting the region of the first exon of the β-ENaC gene, we may have disrupted regulatory elements important for expression of γ-ENaC as well, and thus produced a hypomorphic γ-ENaC allele.
The second unexpected result emerged from the analysis of the ENaC subunit protein levels in kidney. In contrast to the expected effect of the heterozygous state on β-ENaC mRNA, there was no difference in the amount of β-ENaC protein (Fig. 10). In addition, we did not expect to detect a reduced amount of the γ-ENaC protein. The reduction of this protein might be a consequence of the reduction of γ-ENaC mRNA level. This explanation, however, may be too simplistic. The γ-ENaC kidney protein from rats fed a low-NaCl diet exhibits a diminished 85-kDa band and an appearance of a 70-kDa band (compared with rats fed a high-NaCl diet). While the changes in the 85-kDa band from mouse kidney appear to change with dietary NaCl in a similar fashion, we found no clear 70-kDa band in mouse kidney. The appearance of a ∼70-kDa γ-ENaC protein is believed to be owing to proteolytic cleavage of the full-length γ-ENaC protein by an endogenous protease (16). However, the appearance of this band is not evident in the mouse kidney from animals fed a low-NaCl diet. The explanation for these apparent differences is not obvious.
The present study thus confirms the importance of an intact ENaC for normal Na+ and K+ homeostasis. Even subtle defects in ENaC expression, when examined under stressful conditions, can reveal defects in Na+ homeostasis and K+ excretion.
Acknowledgments
The authors thank E. Sweezer, T. Kinney, K. Volk, and J. van der Veer for technical assistance. Dr. M. Knepper generously provided the antisera used for the ENaC immunoblot experiments.
Grants: This work was supported in part by the O'Brien Kidney Research Center at the University of Iowa (DK-52617) and by a grant from the Department of Veterans Affairs.
References
- 1.Alvarez de la Rosa D, Canessa CM, Fyfe GK, Zhang P. Structure and regulation of amiloride-sensitive sodium channels. Annu Rev Physiol. 2000;62:573–594. doi: 10.1146/annurev.physiol.62.1.573. [DOI] [PubMed] [Google Scholar]
- 2.Barker PM, Nguyen MS, Gatzy JT, Grubb B, Norman H, Hummler E, Rossier B, Boucher RC, Koller B. Role of γENaC subunit in lung liquid clearance and electrolyte balance in newborn mice. Insights into perinatal adaptation and pseudohypoaldosteronism. J Clin Invest. 1998;102:1634–1640. doi: 10.1172/JCI3971. [DOI] [PMC free article] [PubMed] [Google Scholar]
- 3.Bartter FC, Pronove P, Gill JR, Jr, Maccardle RC. Hyperplasia of the juxtaglomerular complex with hyperaldosteronism and hypokalemic alkalosis. A new syndrome. Am J Med. 1962;33:811–828. doi: 10.1016/0002-9343(62)90214-0. [DOI] [PubMed] [Google Scholar]
- 4.Canessa CM, Schild L, Buell G, Thorens B, Gautschi I, Horisberger JD, Rossier BC. Amiloride-sensitive epithelial Na+ channel is made of three homologous subunits. Nature. 1994;367:463–467. doi: 10.1038/367463a0. [DOI] [PubMed] [Google Scholar]
- 5.Chang SS, Grunder S, Hanukoglu A, Rosler A, Mathew PM, Hanukoglu I, Schild L, Lu Y, Shimkets RA, Nelson-Williams C, Rossier BC, Lifton RP. Mutations in subunits of the epithelial sodium channel cause salt wasting with hyperkalaemic acidosis, pseudohypoaldosteronism type 1. Nat Genet. 1996;12:248–253. doi: 10.1038/ng0396-248. [DOI] [PubMed] [Google Scholar]
- 6.Chomczynski P, Sacchi N. Single-step method of RNA isolation by acid guanidinium thiocyanate-phenol-chloroform extraction. Anal Biochem. 1987;162:156–159. doi: 10.1006/abio.1987.9999. [DOI] [PubMed] [Google Scholar]
- 7.Chou CL, Knepper MA, Hoek AN, Brown D, Yang B, Ma T, Verkman AS. Reduced water permeability and altered ultrastructure in thin descending limb of Henle in aquaporin-1 null mice. J Clin Invest. 1999;103:491–496. doi: 10.1172/JCI5704. [DOI] [PMC free article] [PubMed] [Google Scholar]
- 8.Dahlmann A, Pradervand S, Hummler E, Rossier BC, Frindt G, Palmer LG. Mineralocorticoid regulation of epithelial Na+ channels is maintained in a mouse model of Liddle's syndrome. Am J Physiol Renal Physiol. 2003;285:F310–F318. doi: 10.1152/ajprenal.00016.2003. [DOI] [PubMed] [Google Scholar]
- 9.Drummond HA, Price MP, Welsh MJ, Abboud FM. A molecular component of the arterial baroreceptor mechanotransducer. Neuron. 1998;21:1435–1441. doi: 10.1016/s0896-6273(00)80661-3. [DOI] [PubMed] [Google Scholar]
- 10.Frindt G, Masilamani S, Knepper MA, Palmer LG. Activation of epithelial Na channels during short-term Na deprivation. Am J Physiol Renal Physiol. 2001;280:F112–F118. doi: 10.1152/ajprenal.2001.280.1.F112. [DOI] [PubMed] [Google Scholar]
- 11.Frindt G, Palmer LG. Apical potassium channels in the rat connecting tubule. Am J Physiol Renal Physiol. 2004;287:F1030–F1037. doi: 10.1152/ajprenal.00169.2004. [DOI] [PubMed] [Google Scholar]
- 12.Frindt G, Palmer LG. Na channels in the rat connecting tubule. Am J Physiol Renal Physiol. 2004;286:F669–F674. doi: 10.1152/ajprenal.00381.2003. [DOI] [PubMed] [Google Scholar]
- 13.Garty H, Palmer LG. Epithelial sodium channels: function, structure, and regulation. Physiol Rev. 1997;77:359–396. doi: 10.1152/physrev.1997.77.2.359. [DOI] [PubMed] [Google Scholar]
- 14.Hansson JH, Schild L, Lu Y, Wilson TA, Gautschi I, Shimkets R, Nelson-Williams C, Rossier BC, Lifton RP. A de novo missense mutation of the β subunit of the epithelial sodium channel causes hypertension and Liddle syndrome, identifying a proline-rich segment critical for regulation of channel activity. Proc Natl Acad Sci USA. 1995;92:11495–11499. doi: 10.1073/pnas.92.25.11495. [DOI] [PMC free article] [PubMed] [Google Scholar]
- 15.Huang DY, Wulff P, Volkl H, Loffing J, Richter K, Kuhl D, Lang F, Vallon V. Impaired regulation of renal K+ elimination in the sgk1-knockout mouse. J Am Soc Nephrol. 2004;15:885–891. doi: 10.1097/01.asn.0000120368.59693.a8. [DOI] [PubMed] [Google Scholar]
- 16.Hughey RP, Mueller GM, Bruns JB, Kinlough CL, Poland PA, Harkleroad KL, Carattino MD, Kleyman TR. Maturation of the epithelial Na+ channel involves proteolytic processing of the α- and γ-subunits. J Biol Chem. 2003;278:37073–37082. doi: 10.1074/jbc.M307003200. [DOI] [PubMed] [Google Scholar]
- 17.Hummler E, Barker P, Gatzy J, Beermann F, Verdumo C, Schmidt A, Boucher R, Rossier BC. Early death due to defective neonatal lung liquid clearance in α-ENaC-deficient mice. Nat Genet. 1996;12:325–328. doi: 10.1038/ng0396-325. [DOI] [PubMed] [Google Scholar]
- 18.Hummler E, Barker P, Talbot C, Wang Q, Verdumo C, Grubb B, Gatzy J, Burnier M, Horisberger JD, Beermann F, Boucher R, Rossier BC. A mouse model for the renal salt-wasting syndrome pseudohypoaldosteronism. Proc Natl Acad Sci USA. 1997;94:11710–11715. doi: 10.1073/pnas.94.21.11710. [DOI] [PMC free article] [PubMed] [Google Scholar]
- 19.Jernigan NL, Drummond HA. Vascular ENaC proteins are required for renal myogenic constriction. Am J Physiol Renal Physiol. 2005;289:F891–F901. doi: 10.1152/ajprenal.00019.2005. [DOI] [PubMed] [Google Scholar]
- 20.Masilamani S, Kim GH, Mitchell C, Wade JB, Knepper MA. Aldosterone-mediated regulation of ENaC α, β, and γ subunit proteins in rat kidney. J Clin Invest. 1999;104:R19–R23. doi: 10.1172/JCI7840. [DOI] [PMC free article] [PubMed] [Google Scholar]
- 21.Matsumura Y, Uchida S, Kondo Y, Miyazaki H, Ko SB, Hayama A, Morimoto T, Liu W, Arisawa M, Sasaki S, Marumo F. Overt nephrogenic diabetes insipidus in mice lacking the CLC-K1 chloride channel. Nat Genet. 1999;21:95–98. doi: 10.1038/5036. [DOI] [PubMed] [Google Scholar]
- 22.McDonald FJ, Yang B, Hrstka RF, Drummond HA, Tarr DE, McCray PB, Stokes JB, Welsh MJ, Williamson RA. Disruption of the β subunit of the epithelial Na+ channel in mice: hyperkalemia and neonatal death associated with a pseudohypoaldosteronism phenotype. Proc Natl Acad Sci USA. 1999;96:1727–1731. doi: 10.1073/pnas.96.4.1727. [DOI] [PMC free article] [PubMed] [Google Scholar]
- 23.Nakamura K, Stokes JB, McCray PB., Jr Endogenous and exogenous glucocorticoid regulation of ENaC mRNA expression in developing kidney and lung. Am J Physiol Cell Physiol. 2002;283:C762–C772. doi: 10.1152/ajpcell.00029.2002. [DOI] [PubMed] [Google Scholar]
- 24.Pradervand S, Wang Q, Burnier M, Beermann F, Horisberger JD, Hummler E, Rossier BC. A mouse model for Liddle's syndrome. J Am Soc Nephrol. 1999;10:2527–2533. doi: 10.1681/ASN.V10122527. [DOI] [PubMed] [Google Scholar]
- 25.Rossier BC, Pradervand S, Schild L, Hummler E. Epithelial sodium channel and the control of sodium balance: interaction between genetic and environmental factors. Annu Rev Physiol. 2002;64:877–897. doi: 10.1146/annurev.physiol.64.082101.143243. [DOI] [PubMed] [Google Scholar]
- 26.Rubera I, Loffing J, Palmer LG, Frindt G, Fowler-Jaeger N, Sauter D, Carroll T, McMahon A, Hummler E, Rossier BC. Collecting duct-specific gene inactivation of αENaC in the mouse kidney does not impair sodium and potassium balance. J Clin Invest. 2003;112:554–565. doi: 10.1172/JCI16956. [DOI] [PMC free article] [PubMed] [Google Scholar]
- 27.Schafer JA. Abnormal regulation of ENaC: syndromes of salt retention and salt wasting by the collecting duct. Am J Physiol Renal Physiol. 2002;283:F221–F235. doi: 10.1152/ajprenal.00068.2002. [DOI] [PubMed] [Google Scholar]
- 28.Schultheis PJ, Clarke LL, Meneton P, Miller ML, Soleimani M, Gawenis LR, Riddle TM, Duffy JJ, Doetschman T, Wang T, Giebisch G, Aronson PS, Lorenz JN, Shull GE. Renal and intestinal absorptive defects in mice lacking the NHE3 Na+/H+ exchanger. Nat Genet. 1998;19:282–285. doi: 10.1038/969. [DOI] [PubMed] [Google Scholar]
- 29.Shimkets RA, Warnock DG, Bositis CM, Nelson-Williams C, Hansson JH, Schambelan M, Gill JR, Jr, Ulick S, Milora RV, Findling JW. Liddle's syndrome: heritable human hypertension caused by mutations in the β subunit of the epithelial sodium channel. Cell. 1994;79:407–414. doi: 10.1016/0092-8674(94)90250-x. [DOI] [PubMed] [Google Scholar]
- 30.Snyder PM. The epithelial Na+ channel: cell surface insertion and retrieval in Na+ homeostasis and hypertension. Endocr Rev. 2002;23:258–275. doi: 10.1210/edrv.23.2.0458. [DOI] [PubMed] [Google Scholar]
- 31.Stockand JD. New ideas about aldosterone signaling in epithelia. Am J Physiol Renal Physiol. 2002;282:F559–F576. doi: 10.1152/ajprenal.00320.2001. [DOI] [PubMed] [Google Scholar]
- 32.Stokes JB. Disorders of the epithelial sodium channel: insights into the regulation of extracellular volume and blood pressure. Kidney Int. 1999;56:2318–2333. doi: 10.1046/j.1523-1755.1999.00803.x. [DOI] [PubMed] [Google Scholar]
- 33.Stokes JB. Ion transport by the collecting duct. Semin Nephrol. 1993;13:202–212. [PubMed] [Google Scholar]
- 34.Strautnieks SS, Thompson RJ, Hanukoglu A, Dillon MJ, Hanukoglu I, Kuhnle U, Seckl J, Gardiner RM, Chung E. Localization of pseudohypoaldosteronism genes to chromosome 16p12.2–1311 and 12p131-pter by homozygosity mapping. Hum Mol Genet. 1996;5:293–299. doi: 10.1093/hmg/5.2.293. [DOI] [PubMed] [Google Scholar]
- 35.Takahashi N, Brooks HL, Wade JB, Liu W, Kondo Y, Ito S, Knepper MA, Smithies O. Posttranscriptional compensation for heterozygous disruption of the kidney-specific Na-K-2Cl cotransporter gene. J Am Soc Nephrol. 2002;13:604–610. doi: 10.1681/ASN.V133604. [DOI] [PubMed] [Google Scholar]
- 36.Volk KA, Sigmund RD, Snyder PM, McDonald FJ, Welsh MJ, Stokes JB. rENaC is the predominant Na+ channel in the apical membrane of the rat renal inner medullary collecting duct. J Clin Invest. 1995;96:2748–2757. doi: 10.1172/JCI118344. [DOI] [PMC free article] [PubMed] [Google Scholar]
- 37.Wang Q, Horisberger JD, Maillard M, Brunner HR, Rossier BC, Burnier M. Salt- and angiotensin II-dependent variations in amiloride-sensitive rectal potential difference in mice. Clin Exp Pharmacol Physiol. 2000;27:60–66. doi: 10.1046/j.1440-1681.2000.03204.x. [DOI] [PubMed] [Google Scholar]
- 38.Wulff P, Vallon V, Huang DY, Volkl H, Yu F, Richter K, Jansen M, Schlunz M, Klingel K, Loffing J, Kauselmann G, Bosl MR, Lang F, Kuhl D. Impaired renal Na+ retention in the sgk1-knockout mouse. J Clin Invest. 2002;110:1263–1268. doi: 10.1172/JCI15696. [DOI] [PMC free article] [PubMed] [Google Scholar]
- 39.Yang B, Gillespie A, Carlson EJ, Epstein CJ, Verkman AS. Neonatal mortality in an aquaporin-2 knock-in mouse model of recessive nephrogenic diabetes insipidus. J Biol Chem. 2001;276:2775–2779. doi: 10.1074/jbc.M008216200. [DOI] [PubMed] [Google Scholar]