

Abstract
Diverse developmental neurotoxicants can often produce similar functional and behavioral outcomes. We examined an organophosphate pesticide (diazinon), an organochlorine pesticide (dieldrin) and a metal (Ni2+) for effects on the expression of neurotrophic factors and their receptors and modulators in differentiating PC12 cells, an in vitro model of neuronal development. Each agent was introduced at 30 μM for 24 or 72 hr, treatments devoid of cytotoxicity. Using microarrays, we examined the mRNAs encoding members of the fibroblast growth factor (fgf) family, the neurotrophins (ntfs), brain-derived neurotrophic factor (bdnf), nerve growth factor (ngf), the wnt and fzd gene families, and the receptors and modulators for each class. All three agents evoked highly concordant patterns of effects on genes encoding the fgf family, whereas the correlations were poor for the group comprising bdnf, ngf and their respective receptors. For wnt, fzd and their receptors/modulators, the relationships between diazinon and dieldrin were highly concordant, whereas the effect of Ni2+ was less similar, albeit still significantly correlated with the others. Our results show that otherwise disparate developmental neurotoxicants converge on common sets of neurotrophic pathways known to control neuronal differentiation, likely contributing to similarities in functional outcomes. Further, cell culture models can provide a useful initial screen to identify members of a given class of compounds that may be greater or lesser risks for developmental neurotoxicity, or to provide an indication of agents in different classes that might produce similar effects.
Keywords: Brain-derived neurotrophic factor, Diazinon, Dieldrin, Fibroblast growth factor, fzd gene family, Metal neurotoxicity, Microarrays, Nerve growth factor, Neuronal development, Neurotoxicity, Neurotrophic factors, Nickel, Organochlorine insecticides, Organophosphate insecticides, PC12 cells, Tyrosine kinase receptors, wnt gene family
INTRODUCTION
A wide variety of environmental contaminants and neuroactive drugs are capable of perturbing brain development, leading to lasting neurobehavioral deficits [8,20]. Although considerable attention has focused on identification of mechanisms that could define the actions of specific agents or classes of developmental neurotoxicants, there are common threads among apparently unrelated agents, so that diverse chemicals often converge on the same target pathways and regions [4,16,20,30,41,55,59-61]. In that manner, compounds of different classes may share the neurobehavioral outcomes, such as learning disabilities, attentional disorders, conduct disorders, and cognitive dysfunction. The conundrum is to establish the cellular events that unite the initially disparate insults to result in similar functional deficits. In a number of recent studies, we showed that developmental exposure to agents as varied as heroin, phenobarbital, terbutaline, nicotine and an organophosphate pesticide, chlorpyrifos, all eventually compromise cell signaling cascades that mediate the actions of numerous neurotransmitters and hormones that themselves act as trophic factors that control brain development [1,28,29,40,44,60,61]. Further, we showed that administering counteragents that ameliorate the effects on cell signaling can reverse or prevent many of the adverse neurodevelopmental effects [48].
We and other research groups have recently started to establish how neurotrophic signals even further downstream from neurotransmitter inputs participate in the convergent actions of different neurobehavioral teratogens [5,6,51,52]. Our main focus has been on neurotrophins and their receptors known to play vital roles in brain assembly and for which disruption of expression or function clearly lead to developmental abnormalities [9,14,15,22,36]. In studies where neonatal rats were exposed to organophosphate pesticides, chlorpyrifos or diazinon, we found disruption of transcriptional profiles for key neurotrophins, their receptors and signaling pathways, including those for nerve growth factor (NGF), brain-derived neurotrophic factor (BDNF) and the fibroblast growth factor (FGF) superfamily [51,52]. Each agent discoordinated neurotrophic factor expression at exposures below the threshold for any overt signs of exposure or even for significant cholinesterase inhibition, thus indicating a particularly high sensitivity of these pathways over and above systemic effects of the organophosphates. With chlorpyrifos, we then confirmed that the targeting of neurotrophic factors was a direct effect by comparing the results of in vivo exposure with those in neuronotypic PC12 cells, a standard in vitro model for neuronal cell replication and differentiation [10,49,52,56].
In the current study, we used the PC12 cell model to compare the effects of otherwise unrelated developmental neurotoxicants on the expression of neurotrophic factors, their receptors and signaling modulators. We evaluated an organophosphate pesticide, diazinon, an organochlorine pesticide, dieldrin, and a metal, Ni2+, three agents that nevertheless produce similar outcomes for neurodifferentiation [24,33,49]. Because the neurotrophic factors can have overlapping functions, we used a microarray approach to evaluate multiple members of a series of neurotrophin classes, established in our earlier work as likely candidates for common downstream targets [51,52]. These include the fgf family and its four receptors (fgfr1-4), ngf, bdnf, members of the neurotrophic factor (ntf) family, along with the corresponding receptors and receptor modulators, the neurotrophic tyrosine receptor kinases (ntrk family), the low-affinity NGF receptor (ngfr) and its adaptor protein (ngfrap1). In addition, we assessed the expression of the Wingless (wnt) gene family, which interacts with receptors encoded by the Frizzled (fzd) genes [26,54], whose signals are transduced by the Disheveled (dvl) factors and negatively modulated by the Dickkopf (dkk) group [19]; all these genes are mammalian homologs of genes originally identified and named in Drosophila melanogaster. The fgf and wnt families are coexpressed both temporally and spatially in the developing brain and converge on common events in forebrain assembly [7,21,37-39,62]. In our earlier work with chlorpyrifos and diazinon in vivo, and with chlorpyrifos in PC12 cells in vitro, we demonstrated highly-correlated disruption of the fgf and wnt/fzd/dkk/dvl families [52]. Here, we found that, like their effects on neuronal cell differentiation [49], diazinon, dieldrin and Ni2+ all share many of the same targets for expression of neurotrophic factors and their receptors in PC12 cells undergoing differentiation into neuronal phenotypes [23,49,56].
MATERIALS AND METHODS
Cell cultures
Because of the clonal instability of the PC12 cell line [18], the experiments were performed on cells that had undergone fewer than five passages. As described previously [35,53], PC12 cells (American Type Culture Collection, 1721-CRL, obtained from the Duke Comprehensive Cancer Center, Durham, NC) were seeded onto poly-D-lysine-coated plates in RPMI-1640 medium (Invitrogen, Carlsbad, CA) supplemented with 10% inactivated horse serum (Sigma Chemical Co., St. Louis, MO), 5% inactivated fetal bovine serum (Sigma), and 50 μg/ml penicillin streptomycin (Invitrogen). Incubations were carried out with 7.5% CO2 at 37°C, standard conditions for PC12 cells. To initiate neurodifferentiation [23,49,56] twenty-four hours after seeding, the medium was changed to include 50 ng/ml of 2.5 S murine NGF (Invitrogen). Along with the NGF, we added 30 μM of each of the test agents: diazinon (Chem Service, West Chester, PA), dieldrin (Chem Service) or NiCl2 (Sigma). The concentration was chosen from earlier studies that demonstrated adverse effects on differentiation of PC12 cells without outright cytotoxicity [24,33,49,52]. Because of the limited water solubility of diazinon and dieldrin, these agents were dissolved in dimethylsulfoxide (final concentration 0.1%), which was also added to the control cultures and to cultures containing NiCl2; this concentration of dimethylsulfoxide has no effect on PC12 cell differentiation [33,35,53]. Cultures were examined 24 and 72 hr after commencing exposure, with eight independent cultures evaluated for each treatment at each time point. We used two time points so as to be able to evaluate changes in gene expression regardless of whether the mRNA for a given gene has a rapid turnover (and hence can rise rapidly) or a slower turnover that would require a longer period to show corresponding increases or decreases.
Microarray determinations
Our earlier studies detailed the techniques for mRNA isolation, preparation of cDNA, conversion to cRNA incorporating cyanine-3 (reference RNA) or cyanine-5 (sample RNA), verification of RNA purity and quality, hybridization to the microarrays, washing and scanning [50-52]. These all involve commercial kits and procedures, and since the current studies were done identically, the techniques will not be described here. The mRNA used for the reference standard was created by pooling aliquots from each of the samples in the study. Similarly, array normalizations and error detection were carried out by procedures described previously [50-52]. We then used Agilent G4131F Whole Rat Genome Arrays (Agilent Technologies, Palo Alto, CA) to assess mRNA levels. For many of the genes, the arrays contain multiple probes for the same gene and/or replicates of the same probe in different locations on the chip, and these were used to verify the reliability of values and the validity of the measures on the chip. To avoid artificially inflating the number of positive findings, we limited each gene to a single set of values, selecting those obtained for the probe showing the smallest intragroup variance. The other values for that gene were used only to corroborate direction and magnitude of change. We also validated the readings on the arrays through the use of duplicate arrays for selected samples [50,51]. We ran 8 independent samples, each on a separate chip, for each of the test conditions: 4 treatments (control, diazinon, dieldrin, Ni2+) × 2 time points × n=8, for a total of 68 chips.
Statistical procedures
Because of the requirement to normalize the data across arrays and within each gene, the absolute values for a given gene are meaningless, so only the relative differences between treatments can be compared. Accordingly, results are presented as means and standard errors of the percentage change from control values to allow for visual comparison of the effects across families of genes; therefore, control values are not shown but were quite similar to those reported previously [52]. However, statistical comparisons were based on the actual ratios (log-transformed, since the data are in the form of ratios) rather than the percent change.
Our design involved multiple planned comparisons of four treatments at two time points, so it was important to consider the false positive rate and to protect against the increased probability of type 1 errors engendered by repeated testing of the same data base. Accordingly, before looking at effects on individual genes, we performed a global ANOVA incorporating all the variables in a single comparison: treatment, time, and all genes. Lower-order ANOVAs on subdivisions of the data set were then carried out as permitted by the interactions of treatment with the other variables. Finally, differences for individual treatments for a specified gene at a single time point were evaluated with Fisher’s Protected Least Significant Difference. However, for a given gene where there was no treatment × time interaction, only the main treatment effect was reported without subtesting of effects at a single time point. Treatment effects were considered significant at p < 0.05 (two-tailed, since we were interested in both increases and decreases in gene expression). In addition to these parametric tests of the direction and magnitude of changes in gene expression, we evaluated the incidence of significant differences as compared to the predicted false positive rate, using Fisher’s Exact Test, applying a one-tailed criterion of p < 0.05, since only an increase above the false positive rate would be predicted; at the criterion of p < 0.05, one gene out of every 20 tested can be expected to show a difference at random. Finding a significant decrease in the incidence of detected differences relative to the false positive rate would be biologically implausible and statistically meaningless. Finally, concordance of patterns of effects between different agents was evaluated by linear regression analysis.
RESULTS
For all of the gene families studied here, 58 genes passed the quality control filters, encoding 20 of the factors and receptors in the fgf family, 11 genes among the neurotrophins and their receptors, 14 members of the wnt family, and 13 of the receptors and modulators of wnt function (fzd, dkk, dvl). Of all these genes, 47 showed statistically significant treatment effects, as opposed to a false positive fate of only 3 genes (p < 10-17). Global ANOVA, incorporating all treatments and time points in a single test, similarly confirmed the presence of highly-significant treatment differences that showed selectivity toward specific genes and time points: p < 0.0001 for the main treatment effect, p < 0.0001 for treatment × time, p < 0.0001 for treatment × gene, p < 0.0001 for treatment × gene × time. These relationships were maintained for each of the agents individually: diazinon, p < 0.0002 for treatment, p < 0.0001 for treatment × time, p < 0.0001 for treatment × gene, p < 0.0001 for treatment × gene × time; dieldrin, p < 0.004, p < 0.007, p < 0.0001 and p < 0.0001, respectively; Ni2+, p < 0.0001 for all treatments and interactions.
FGF family
Within the fgf family and its receptors, 20 genes passed the quality control filters, encoding 16 of the factors and all four receptor subtypes. Of these, 14 showed significant differences vs. predicted false positive rate of one gene (p < 0.00002). ANOVA across all treatments and time points indicated a significant main effect (p < 0.04) and interactions of treatment × time (p < 0.01), treatment × gene (p < 0.004) and treatment × gene × time (p < 0.04) and accordingly, data were separated by treatment and gene, and then reexamined for main treatment effects and treatment × time interactions.
Diazinon evoked significant decrements in the expression of 6 members of the fgf family, fgf1, fgf2, fgf12, fgf17, fgf21 and fgf23 (Figure 1A). There were robust but transient increases in fgf9, fgf15, fgf16, fgf20 and fgfr4, all of which showed significant elevations after 24 hr of exposure that disappeared by 72 hr; only one gene (fgfr1) showed a small, but significant increase at 72 hr. The effects of dieldrin bore a striking similarity to those of diazinon, with significant decrements in fgf1, fgf2, fgf12, fgf17 and fgf21 (Figure 1B). Dieldrin reduced fgf23 expression just as did diazinon, but the effect was smaller and thus did not achieve statistical significance compared to control; however, the nonsignificant effect of dieldrin was not itself statistically distinguishable from the significant decrement caused by diazinon. Genes that showed increased expression in response to dieldrin also were quite similar to those affected by diazinon: fgf9, fgf15, fgfr1 and fgfr4. Exposure to Ni2+ also elicited significant decreases in the expression of the same set of genes, fgf1, fgf2, fgf17, fgf21 and fgf23, but there were two additional genes showing reductions (fgf18, fgf22). Two of the genes that showed the most robust increases with diazinon and dieldrin, fgf15 and fgfr4, also were enhanced by Ni2+ exposure, with the same temporal profile of higher values at 24 hr and regression to normal by 72 hr.
Figure 1.
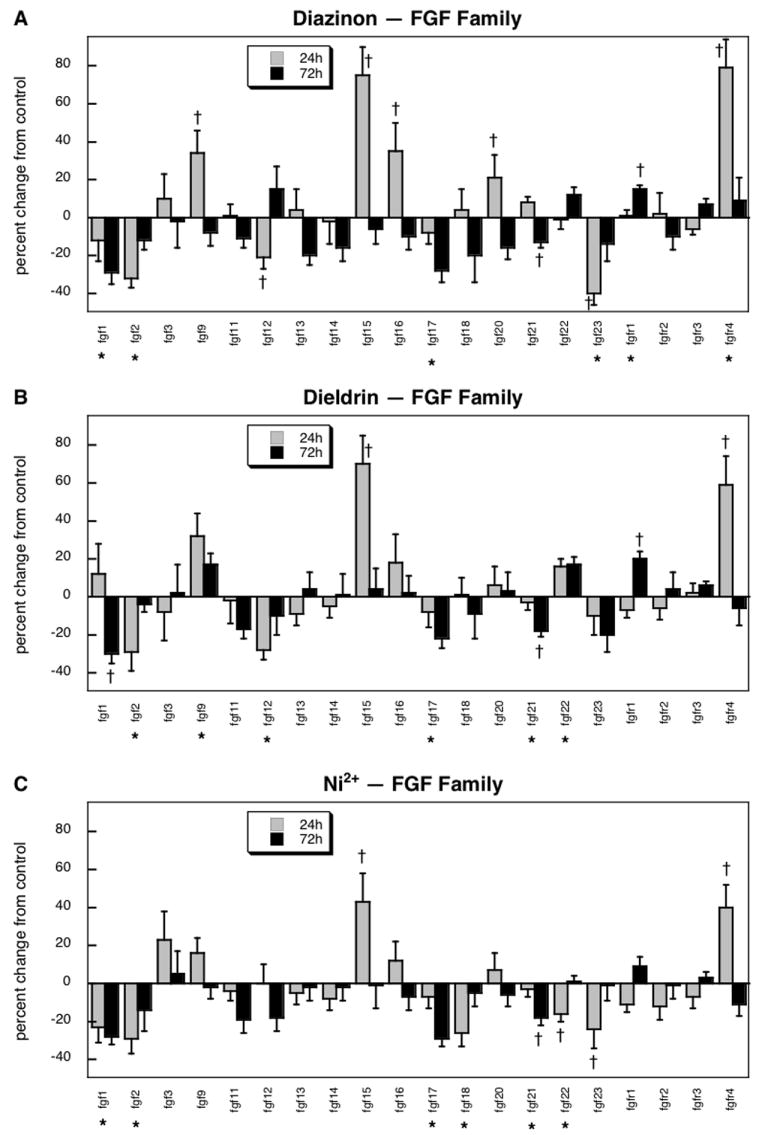
Effects of 30 μM diazinon (A), dieldrin (B) or Ni2+ (C) exposure on expression of genes comprising the fgf family and related receptors. Asterisks shown below each gene denote a significant main treatment effect. Daggers denote genes for which a treatment × time interaction was detected and show the individual times for which treatment effects were present. Multivariate ANOVA (all treatments, time) indicates a significant main effect of treatment (p < 0.04) and interactions of treatment × time (p < 0.01), treatment × gene (p < 0.004) and treatment × gene × time (p < 0.04).
Neurotrophins and related receptors
For the family of neurotrophins and related receptors, 11 genes passed the quality control filters, encoding brain-derived neurotrophic factor (bdnf), two of the NGF subunits (ngfb, ngfg), the low-affinity NGF receptor (ngfr), the NGF receptor associated protein 1 (ngfrap1), three of the neurotrophins (ntf2, ntf3, ntf5), and all three of the neurotrophic tyrosine kinase receptors (ntrk1, ntrk2, ntrk3). Of these genes, 7 showed significant treatment-related changes, as opposed to a predicted false positive rate of <1 gene (p < 0.02). For this gene grouping, ANOVA across all treatments and time points indicated a significant main effect (p < 0.007) and interactions of treatment × time (p < 0.04), treatment × gene (p < 0.0001) and treatment × gene × time (p < 0.008) and accordingly, data were again separated along the same lines as for the fgf family.
Diazinon evoked significant decreases in the expression of ngfb, ntrk2 and ntrk3, while causing significant but decidedly smaller increases in ngfrap1, ntf5 and ntrk1 (Figure 2A). For this set of genes, some of the effects of dieldrin were distinct, with a minor but significant decrease in ngfrap1 as well as a small increase in ntrk2 (Figure 2B), changes in the opposite direction from those seen with diazinon. Nevertheless, three of the genes showed effects that were similar for the two agents: increases in ntf5 and ntrk1, and a decrease in ntrk3. Exposure to Ni2+ evoked transcriptional changes that were substantially different from the other two agents (Figure 2C). Expression of ngfb showed a large but transient increase and ngfg displayed a significant decrease in response to Ni2+, effects that were not seen with either diazinon or dieldrin. Additionally, Ni2+ evoked a stronger reduction in ngfrap1 than that seen with dieldrin, and reduced ntf5 expression whereas the other two agents produced increases. Again, though, there were some genes showing similar changes for all three agents, an increase in ntrk1 and decrease in ntrk3, and Ni2+ likewise produced the same decrease in ntrk2 as had been seen with diazinon.
Figure 2.
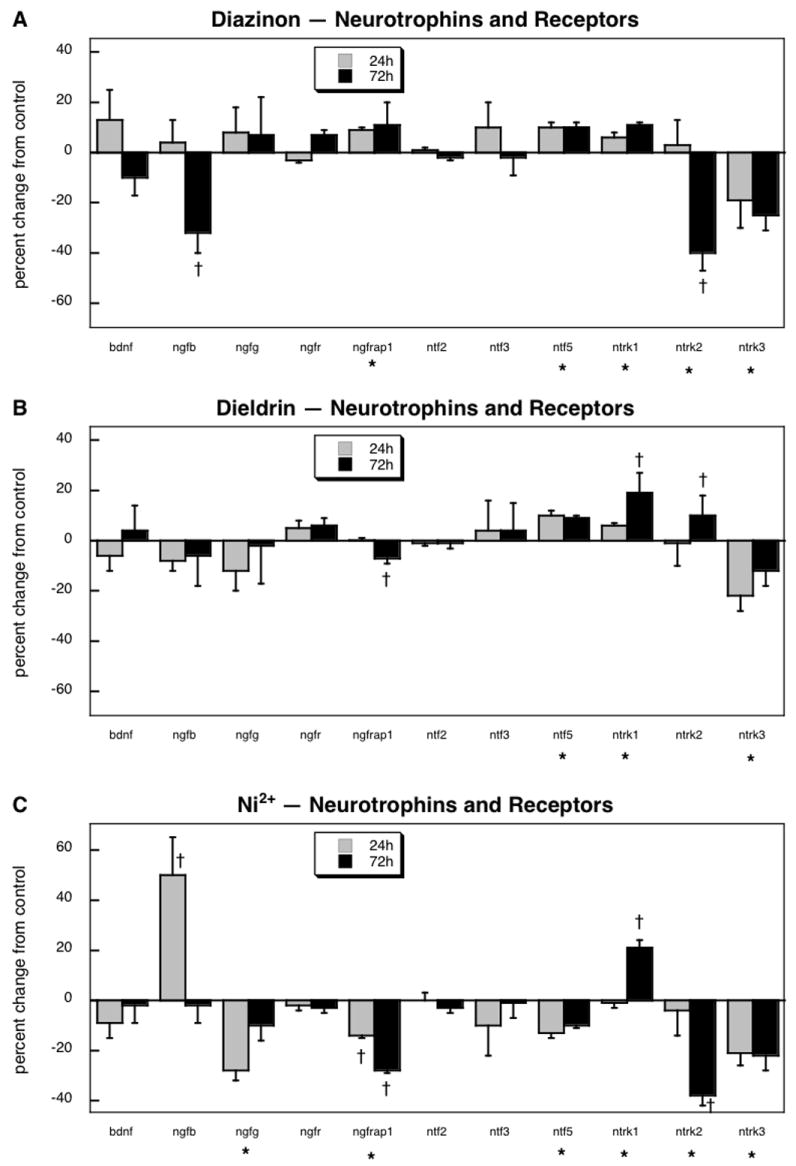
Effects of 30 μM diazinon (A), dieldrin (B) or Ni2+ (C) exposure on expression of genes comprising the neurotrophins and their receptors. Asterisks shown below each gene denote a significant main treatment effect. Daggers denote genes for which a treatment × time interaction was detected and show the individual times for which treatment effects were present. Multivariate ANOVA (all treatments, time) indicates a significant main effect of treatment (p < 0.007) and interactions of treatment × time (p < 0.04), treatment × gene (p < 0.0001) and treatment × gene × time (p < 0.008).
WNT family and its receptors and modulators
For the wnt family, we were able to assess expression of 14 genes, all of which showed significant treatment-related changes, as opposed to a predicted false positive rate of <1 gene (p < 10-6). ANOVA indicated a significant main effect (p < 0.007) and interactions of treatment × time (p < 0.0001), treatment × gene (p < 0.0002) and treatment × gene × time (p < 0.004).
Diazinon exposure elicited significant decrements in expression of the majority of the wnt genes: wnt2b, wnt3a, wnt4, wnt5a, wnt7b, wnt8a, wnt9a and wnt9b (Figure 3A). Of the four genes showing significant increases, wnt4, wnt6, wnt9b and wnt10a, three showed only a transient rise (wnt4, wnt9b, wnt10a) and for two of those (wnt4, wnt9b), the longer-term effect was a decrease. Dieldrin evoked significant decreases for wnt2, wnt2b, wnt3a, wnt5a, wnt6, wnt7a and wnt9a (Figure 3B), with transient increases for wnt5, wnt9a and wnt9b, and a small but more persistent rise for wnt6. In general, these patterns were quite similar to those seen for diazinon, differing only to the extent that some of the genes that changed in the same direction were nonsignificant for one agent and significant for the other vs. control; however, as before, the nonsignificant effects for one agent were not themselves distinguishable from the significant differences seen with the other agent.
Figure 3.
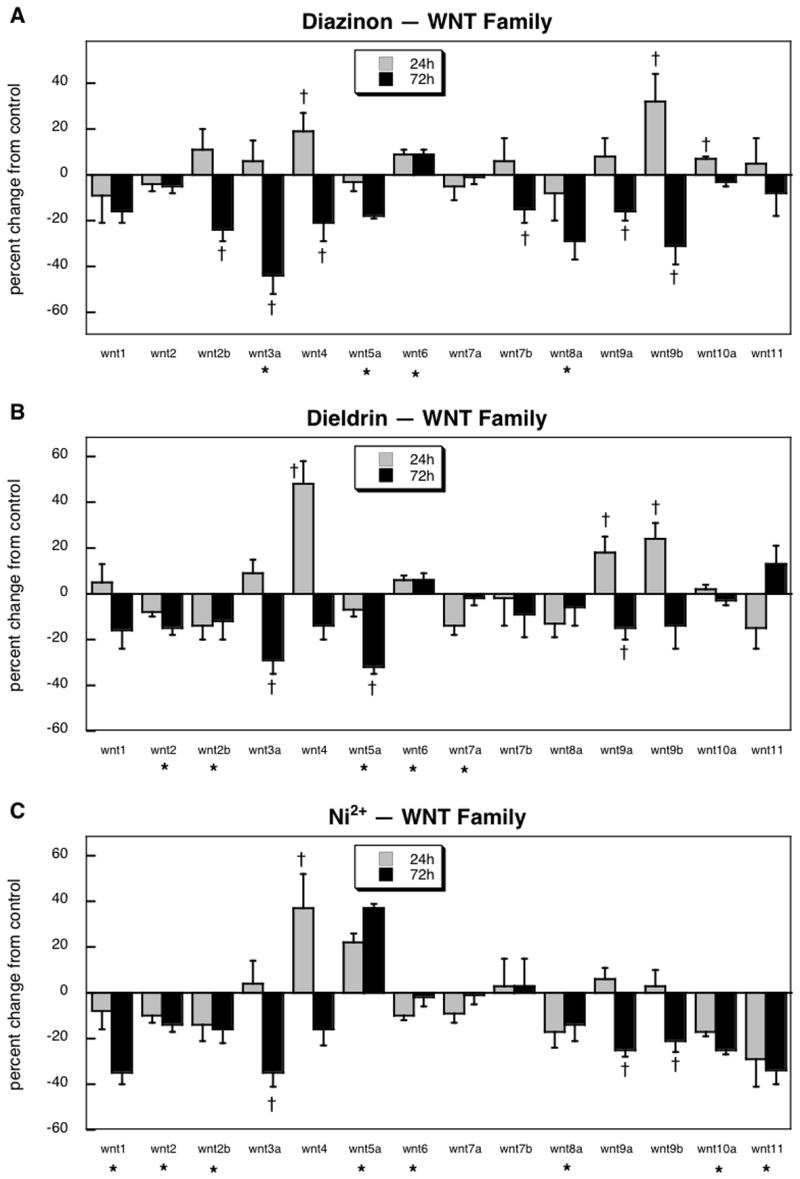
Effects of 30 μM diazinon (A), dieldrin (B) or Ni2+ (C) exposure on expression of genes comprising the wnt family. Asterisks shown below each gene denote a significant main treatment effect. Daggers denote genes for which a treatment × time interaction was detected and show the individual times for which treatment effects were present. Multivariate ANOVA (all treatments, time) indicates a significant main effect of treatment (p < 0.007) and interactions of treatment × time (p < 0.0001), treatment × gene (p < 0.0002) and treatment gene × time (p < 0.004).
Exposure to Ni2+ produced effects on wnt expression that bore some similarities to diazinon and dieldrin, but also showed significant differences (Figure 3C). Ni2+ evoked a larger decrease in wnt1 than was seen with the other two agents, reaching statistical significance whereas the effects had been nonsignificant for diazinon or dieldrin. Likewise, wnt2 was reduced by Ni2+ just as for dieldrin, and the metal also evoked decreases in wnt2b, wnt3a, wnt8a, wnt9a and wnt9b, as had been seen with one or both of the pesticides; Ni2+ also caused the same transient increase in wnt4 expression as did the other two agents. The notable differences were for wnt5a (increased by Ni2+, decreased by diazinon or dieldrin), and for wnt6, wnt10a and wnt11 (all decreased by Ni2+, increased or unaffected by diazinon or dieldrin).
Turning to the genes comprising the receptors and modulators of wnt function, the microarrays detected 8 members of the fzd family, as well as 3 dvl and 2 dkk subtypes. Of these 13 genes, 12 showed significant treatment differences, as compared to a false positive rate of <1 gene (p < 0.00002). ANOVA identified a main treatment effect (p < 0.0001) and interactions of treatment × gene (p < 0.0001) and treatment × gene × time (p < 0.0001). Diazinon exposure elicited significant decrements in the expression of fzd5, fzd6, fzd7 and fzd9, while evoking increases for fzd1, fzd3 fzd4, dvl1, dvl3 and dkk3 (Figure 4A). Some of these genes were very tightly controlled, exhibiting very small coefficients of variation, so that even small changes in expression achieved statistical significance (e.g. fzd1, dvl1, dkk3). Dieldrin shared many of these gene changes, namely the decreases in fzd5, fzd6, fzd7 and fzd9, and the increases in fzd3, fzd4 and dvl1 (Figure 4B). For dvl3 and dkk3, dieldrin did not produce statistically significant effects, but the changes were in the same direction as those for diazinon and were not themselves statistically distinguishable from the significant increments caused by the organophosphate. Dieldrin did evoke two transcriptional responses that were different from those of diazinon (decreases in fzd1 and fzd2).
Figure 4.
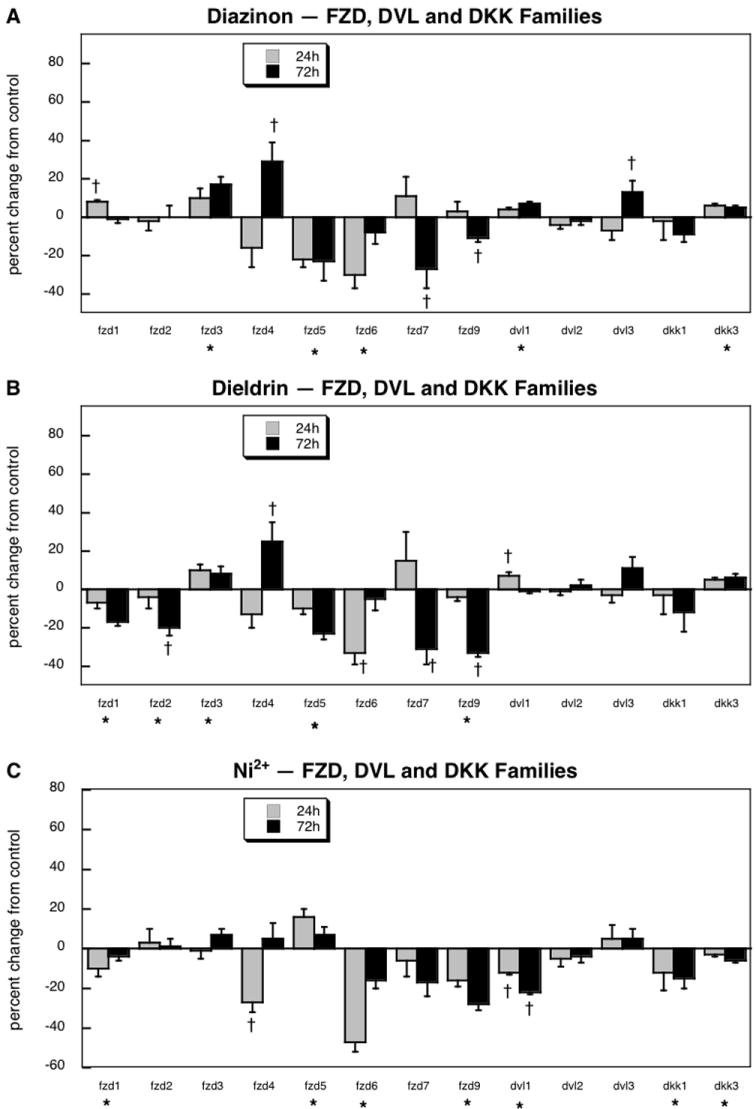
Effects of 30 μM diazinon (A), dieldrin (B) or Ni2+ (C) exposure on expression of genes encoding the receptors and modulators of the wnt family: fzd, dvl and dkk. Asterisks shown below each gene denote a significant main treatment effect. Daggers denote genes for which a treatment × time interaction was detected and show the individual times for which treatment effects were present. Multivariate ANOVA (all treatments, time) indicates a significant main effect of treatment (p < 0.0001) and interactions of treatment × gene (p < 0.0001) and treatment gene × time (p < 0.0001).
Again, treatment with Ni2+ elicited transcriptional changes shared by one or both of the insecticides, namely decreases in fzd1, fzd6 and fzd9 (Figure 4C). Like diazinon, but unlike dieldrin, Ni2+ did not affect fzd2 expression. For fzd3, fzd4, fzd7, dvl3 and dkk1, the effects of Ni2+ resembled those of the other agents, sometimes with one or another treatment achieving statistical significance compared to control yet also indistinguishable from the significant effects of the other two agents (fzd3, fzd7, dvl3, dkk1) or with the same temporal pattern (fzd4). Notable differences were seen for fzd5, dvl1 and dkk3, where Ni2+ elicited transcriptional changes opposite to those of the two insecticides.
DISCUSSION
In our prior work with the PC12 cell model, we found that diazinon, dieldrin and Ni2+ all produced a similar set of outcomes, characterized by impairment of cell replication, reductions in cell number but not cell growth, and diversion of differentiation away from the acetylcholine phenotype and towards the dopamine phenotype [49]. In turn, these phenotypic changes are likely contributors to the deficits in cholinergic synaptic function and related behaviors noted with in vivo exposures to organophosphates [25,41,42,45-47,57]. Underlying these effects, the current results show that these agents also share common patterns of effects on neurotrophins and neurotrophic factors, and on their signaling pathways and modulators. Although there are also some notable differences among the three toxicants, the number of genes affected in each pathway, as well as the direction and magnitude of change, were strikingly similar, well beyond any possibility of statistical chance.
An approach using planned comparisons differs in design, purpose and meaning from surveys of the entire genome [50-52]. Here, our objective was to examine a specific set of interrelated pathways because in vivo evaluations already pointed us toward these sets of genes as targets for organophosphates and potentially for other developmental neurotoxicants [50-52]. By restricting our examination to planned comparisons of only 58 genes, we found alterations in over 80% of the genes, as compared to 3 false positives at most. Further, our findings did not rely on changes restricted to one or another gene, but rather reflected multiple changes each pathway, as well as the repetition of the same effects across different treatments. There were also multiple sequences and spots for each gene on the array (see Methods), to ensure that the changes were not random events. Accordingly, there was no chance that most of the gene changes are false positives. Thus, although we did not perform RT-PCR corroboration of the microarray results, this is really required only for array studies of the entire genome, where only a few changes are identified out of thousands of genes, so that the effects need to be distinguished from the large number of false positives. Another major point for planned comparisons is the reliance on statistical significance as the criterion for assigning changes in gene expression: significant differences were compiled regardless of whether they represented an increase or a decrease in expression, and without using a preassigned criterion for magnitude of effect. A decrease in gene expression, for example, could represent a direct effect of toxicant exposure or alternatively could be a rebound response to a prior period of activation (or vice versa). This clearly occurred for a number of genes, as demonstrated by increases at 24 hr followed by suppression at 72 hr. Similarly, it is not appropriate to assign an a priori criterion for magnitude of effect (as distinct from the criterion of statistical significance). A tightly-controlled gene, or one with slow mRNA turnover, will perforce show much smaller changes than a gene that is poorly controlled and therefore has extreme volatility; for a tightly-controlled gene, a small difference may be of equal or greater biological significance than for one that changes greatly in either direction over a short period of time [50].
To compare the degree to which the various agents produce similar outcomes for effects on neurotrophic factor gene expression, we took our primary data and reexamined them for the concordance of effects across pairs of agents using linear regression analysis. Because diazinon’s effects on these pathways in the developing brain in vivo have already been validated [51,52], we used diazinon as the primary reference compound for concordance with the other agents. The relationship was high for the fgf family: r=0.83 (p < 0.0001) for diazinon vs. dieldrin (Figure 5A), r=0.80 (p < 0.0001) for diazinon vs. Ni2+ (Figure 5B); similarly, dieldrin and Ni2+ showed high concordance (r=0.76, p < 0.0003, data not shown). In contrast to the strong correlations across compounds for the fgf family, the relationships for the neurotrophin group (bdnf and all the subtypes for ngf, ntf and ntrk) were relatively poor: r=0.23 (not significant) for diazinon vs. dieldrin (Figure 5C), r=0.29 (not significant) for diazinon vs. Ni2+ (Figure 5D), and r=0.19 (not significant) for dieldrin vs. Ni2+(data not shown). Although the concordance of effects of the three test compounds was not as strong for the wnt family as for the fgf group, the relationships were still significant, much more so for diazinon and dieldrin (r=0.69, p < 0.0001, Figure 5E) than for diazinon and Ni2+ (r=0.40, p < 0.04, Figure 5F) or dieldrin vs. Ni2+ (r=0.39, p < 0.04, data not shown). The same was true for the family of genes comprising the receptors and modulators of wnt action, fzd, dvl, and dkk, namely a high correlation between diazinon and dieldrin (r = 0.85, p < 0.0001, Figure 5G) and a significant, but lower correlation for diazinon and Ni2+ (r = 0.39, p < 0.05, Figure 5H) or dieldrin and Ni2+ (r=0.49, p < 0.01, data not shown). Accordingly, these results indicate that diazinon and dieldrin are more likely to produce similar types of neurodevelopmental defects than is Ni2+. As a further prediction, those developmental events governed by the fgf family of neurotrophic factors are the ones that we predict will show similar effects of all three agents, whereas those connected to ngf and bdnf actions may differ substantially. For the wnt family and its receptors modulators, outcomes should be in between these two extremes: closer for diazinon and dieldrin than for diazinon and Ni2+, but still with some points of convergence for all three agents. Obviously, in vivo studies will be required to verify these predictions, but the main point is that the in vitro findings provide guidance as to what types of events are the likely targets for each agent, to the potential underlying mechanisms, and accordingly, to the types of neurotrophic interventions that might ameliorate or offset neurodevelopmental damage. In our earlier work with microarray studies of neurotrophic factor expression in vivo and in vitro, we detailed how the effects on each gene could contribute to specific neurodevelopmental defects noted for the organophosphates [50-52], so we will not repeat that discussion here.
Figure 5.

Correlations between the effects of diazinon vs. dieldrin (A, C, E, G) and diazinon vs. Ni2+ (B, D, F, H), evaluated for the FGF family (A, B), neurotrophins and their receptors (C, D), the WNT family (E, F), and the FZD, DVL and DKK families (G,H). Data were taken from the values shown in figures 1-4.
Since our results were obtained in cell cultures, they share the corresponding limitations of all in vitro systems, namely difficulty in modeling neuronal-glial or other cell-to-cell interactions, a lack of correspondence to more global, architectural aspects of brain development, and problems of correspondence to in vivo properties of dose, pharmacokinetics or bioavailability of the test agents [10,43]. PC12 cells are transformed cells, so they are less sensitive to toxicant injury than are developing neurons in vivo; further, the cell culture treatments involve much shorter exposures than are experienced with environmental exposures extending throughout brain development. Both of these factors operate in the selection of the 30 μM test concentrations studied here. In the case of the organophosphates, this is approximately an order of magnitude higher than the levels in newborn babies after nonsymptomatic environmental exposures in agricultural communities [32] but it should be noted that the cultures contain high concentrations of serum proteins; accordingly, less than 10% of the nominal concentration is actually available to diffuse into the cells [33]. Nevertheless, to offset some of these problems, two different organophosphates, chlorpyrifos and diazinon, have been thoroughly evaluated and found to elicit parallel outcomes in the PC12 model and in developing rat brain [2,3,11-13,17,23,24,27,31,33,34,48,49,52,53,58].
Despite these limitations, the relationship of our findings to in vivo results for organophosphates is striking [50-52]. Further, our results clearly demonstrate a convergence of otherwise disparate developmental neurotoxicants on a common set of neurotrophic pathways known to control neuronal differentiation and brain assembly, thus providing a mechanistic link for the outcomes of exposure to disparate neurotoxicants. Indeed, the fact that the effects can be identified in an in vitro confirms that known and suspected developmental neurotoxicants can exert direct effects on the expression of neurotrophins, their receptors and signaling modulators. Finally, our results point out how cell cultures can provide a useful initial screen to identify members of a given class of compounds that may be greater or lesser risks for developmental neurotoxicity, or to provide an indication of agents in different classes that might produce similar outcomes for brain development.
Acknowledgments
Research was supported by NIH ES10356. The authors state that they have no competing financial interests. Theodore Slotkin and Frederic Seidler have provided expert witness testimony on behalf of government agencies, corporations and/or individuals.
Abbreviations
- ANOVA
analysis of variance
- BDNF
brain-derived neurotrophic factor
- FGF
fibroblast growth factor
- NGF
nerve growth factor
- NTF
neurotrophic factor (neurotrophin)
- trk
tyrosine kinase receptor
Footnotes
Publisher's Disclaimer: This is a PDF file of an unedited manuscript that has been accepted for publication. As a service to our customers we are providing this early version of the manuscript. The manuscript will undergo copyediting, typesetting, and review of the resulting proof before it is published in its final citable form. Please note that during the production process errors may be discovered which could affect the content, and all legal disclaimers that apply to the journal pertain.
References
- 1.Aldridge JE, Meyer A, Seidler FJ, Slotkin TA. Developmental exposure to terbutaline and chlorpyrifos: pharmacotherapy of preterm labor and an environmental neurotoxicant converge on serotonergic systems in neonatal rat brain regions. Toxicology and Applied Pharmacology. 2005;203:134–144. doi: 10.1016/j.taap.2004.08.002. [DOI] [PubMed] [Google Scholar]
- 2.Bagchi D, Bagchi M, Hassoun EA, Stohs SJ. In vitro and in vivo generation of reactive oxygen species, DNA damage and lactate dehydrogenase leakage by selected pesticides. Toxicology. 1995;104:129–140. doi: 10.1016/0300-483x(95)03156-a. [DOI] [PubMed] [Google Scholar]
- 3.Bagchi D, Bhattacharya G, Stohs SJ. In vitro and in vivo induction of heat shock (stress) protein (Hsp) gene expression by selected pesticides. Toxicology. 1996;112:57–68. doi: 10.1016/0300-483x(96)03350-1. [DOI] [PubMed] [Google Scholar]
- 4.Barone S, Das KP, Lassiter TL, White LD. Vulnerable processes of nervous system development: a review of markers and methods. Neurotoxicology. 2000;21:15–36. [PubMed] [Google Scholar]
- 5.Betancourt AM, Burgess SC, Carr RL. Effect of developmental exposure to chlorpyrifos on the expression of neurotrophin growth factors and cell-specific markers in neonatal rat brain. Toxicological Sciences. 2006;92:500–506. doi: 10.1093/toxsci/kfl004. [DOI] [PubMed] [Google Scholar]
- 6.Betancourt AM, Filipov NM, Carr RL. Alteration of neurotrophins in the hippocampus and cerebral cortex of young rats exposed to chlorpyrifos and methyl parathion. Toxicological Sciences. 2007;100:445–455. doi: 10.1093/toxsci/kfm248. [DOI] [PubMed] [Google Scholar]
- 7.Blak AA, Naserke T, Weisenhorn DMV, Prakash N, Partanen J, Wurst W. Expression of Fgf receptors 1, 2, and 3 in the developing mid- and hindbrain of the mouse. Dev Dynamics. 2005;233:1023–1030. doi: 10.1002/dvdy.20386. [DOI] [PubMed] [Google Scholar]
- 8.Boyes WK. Neurotoxicology and behavior. In: Bingham E, Cohrseen B, Powell CH, editors. Patty’s Toxicology. Fifth Edition. John Wiley & Sons; New York: 2001. pp. 55–121. [Google Scholar]
- 9.Conner JM, Varon S. Developmental profile of NGF immunoreactivity in the rat brain: a possible role of NGF in the establishment of cholinergic terminal fields in the hippocampus and cortex. Developmental Brain Research. 1997;101:67–79. doi: 10.1016/s0165-3806(97)00051-5. [DOI] [PubMed] [Google Scholar]
- 10.Costa LG. Neurotoxicity testing: a discussion of in vitro alternatives. Environmental Health Perspectives. 1998;106(Suppl 2):505–510. doi: 10.1289/ehp.98106505. [DOI] [PMC free article] [PubMed] [Google Scholar]
- 11.Crumpton TL, Seidler FJ, Slotkin TA. Developmental neurotoxicity of chlorpyrifos in vivo and in vitro: effects on nuclear transcription factor involved in cell replication and differentiation. Brain Res. 2000;857:87–98. doi: 10.1016/s0006-8993(99)02357-4. [DOI] [PubMed] [Google Scholar]
- 12.Crumpton TL, Seidler FJ, Slotkin TA. Is oxidative stress involved in the developmental neurotoxicity of chlorpyrifos? Developmental Brain Research. 2000;121:189–195. doi: 10.1016/s0165-3806(00)00045-6. [DOI] [PubMed] [Google Scholar]
- 13.Das KP, Barone S. Neuronal differentiation in PC12 cells is inhibited by chlorpyrifos and its metabolites: is acetylcholinesterase inhibition the site of action? Toxicology and Applied Pharmacology. 1999;160:217–230. doi: 10.1006/taap.1999.8767. [DOI] [PubMed] [Google Scholar]
- 14.Dono R. Fibroblast growth factors as regulators of central nervous system development and function. American Journal of Physiology - Heart & Circulatory Physiology. 2003;284:R867–R881. doi: 10.1152/ajpregu.00533.2002. [DOI] [PubMed] [Google Scholar]
- 15.Dreyfus CF. Neurotransmitters and neurotrophins collaborate to influence brain development. Perspect Dev Neurobiol. 1998;5:389–399. [PubMed] [Google Scholar]
- 16.Eriksson P. Developmental neurotoxicity of environmental agents in the neonate. Neurotoxicology. 1997;18:719–726. [PubMed] [Google Scholar]
- 17.Flaskos J, McLean WG, Hargreaves AJ. The toxicity of organophosphate compounds towards cultured PC12 cells. Toxicology Letters. 1994;70:71–76. doi: 10.1016/0378-4274(94)90146-5. [DOI] [PubMed] [Google Scholar]
- 18.Fujita K, Lazarovici P, Guroff G. Regulation of the differentiation of PC12 pheochromocytoma cells. Environmental Health Perspectives. 1989;80:127–142. doi: 10.1289/ehp.8980127. [DOI] [PMC free article] [PubMed] [Google Scholar]
- 19.Glinka A, Wu W, Delius H, Monaghan AP, Blumenstock C, Niehrs C. Dickkopf-1 is a member of a new family of secreted proteins and functions in head induction. Nature. 1998;391:357–362. doi: 10.1038/34848. [DOI] [PubMed] [Google Scholar]
- 20.Grandjean P, Landrigan PJ. Developmental neurotoxicity of industrial chemicals. Lancet. 2006;368:2167–2178. doi: 10.1016/S0140-6736(06)69665-7. [DOI] [PubMed] [Google Scholar]
- 21.Gunhaga L, Marklund M, Sjodal M, Hsieh JC, Jessell TM, Edlund T. Specification of dorsal telencephalic character by sequential Wnt and FGF signaling. Nature Neuroscience. 2003;6:701–707. doi: 10.1038/nn1068. [DOI] [PubMed] [Google Scholar]
- 22.Henderson CE. Role of neurotrophic factors in neuronal development. Curr Opinion Neurobiol. 1996;6:64–70. doi: 10.1016/s0959-4388(96)80010-9. [DOI] [PubMed] [Google Scholar]
- 23.Jameson RR, Seidler FJ, Qiao D, Slotkin TA. Chlorpyrifos affects phenotypic outcomes in a model of mammalian neurodevelopment: critical stages targeting differentiation in PC12 cells. Environmental Health Perspectives. 2006;114:667–672. doi: 10.1289/ehp.8750. [DOI] [PMC free article] [PubMed] [Google Scholar]
- 24.Jameson RR, Seidler FJ, Slotkin TA. Nonenzymatic functions of acetylcholinesterase splice variants in the developmental neurotoxicity of organophosphates: chlorpyrifos, chlorpyrifos oxon and diazinon. Environmental Health Perspectives. 2007;115:65–70. doi: 10.1289/ehp.9487. [DOI] [PMC free article] [PubMed] [Google Scholar]
- 25.Levin ED, Addy N, Christopher NC, Seidler FJ, Slotkin TA. Persistent behavioral consequences of neonatal chlorpyrifos exposure in rats. Developmental Brain Research. 2001;130:83–89. doi: 10.1016/s0165-3806(01)00215-2. [DOI] [PubMed] [Google Scholar]
- 26.Li F, Chong ZZ, Maiese K. Vital elements of the Wnt-Frizzled signaling pathway in the nervous system. Curr Neurovasc Res. 2005;2:331–340. doi: 10.2174/156720205774322557. [DOI] [PMC free article] [PubMed] [Google Scholar]
- 27.Li WW, Casida JE. Organophosphorus neuropathy target esterase inhibitors selectively block outgrowth of neurite-like and cell processes in cultured cells. Toxicology Letters. 1998;98:139–146. doi: 10.1016/s0378-4274(98)00116-7. [DOI] [PubMed] [Google Scholar]
- 28.Meyer A, Seidler FJ, Aldridge JE, Slotkin TA. Developmental exposure to terbutaline alters cell signaling in mature rat brain regions and augments the effects of subsequent neonatal exposure to the organophosphorus insecticide, chlorpyrifos. Toxicology and Applied Pharmacology. 2005;203:154–166. doi: 10.1016/j.taap.2004.08.005. [DOI] [PubMed] [Google Scholar]
- 29.Meyer A, Seidler FJ, Aldridge JE, Tate CA, Cousins MM, Slotkin TA. Critical periods for chlorpyrifos-induced developmental neurotoxicity: alterations in adenylyl cyclase signaling in adult rat brain regions after gestational or neonatal exposure. Environmental Health Perspectives. 2004;112:295–301. doi: 10.1289/ehp.6755. [DOI] [PMC free article] [PubMed] [Google Scholar]
- 30.Monnet-Tschudi F, Zurich MG, Honegger P. Neurotoxicant-induced inflammatory response in three-dimensional brain cell cultures. Human and Experimental Toxicology. 2007;26:339–346. doi: 10.1177/0960327107074589. [DOI] [PubMed] [Google Scholar]
- 31.Nagata K, Huang CS, Song JH, Narahashi T. Direct actions of anticholinesterases on the neuronal nicotinic acetylcholine receptor channels. Brain Res. 1997;769:211–218. doi: 10.1016/s0006-8993(97)00707-5. [DOI] [PubMed] [Google Scholar]
- 32.Ostrea EM, Morales V, Ngoumgna E, Prescilla R, Tan E, Hernandez E, Ramirez GB, Cifra HL, Manlapaz ML. Prevalence of fetal exposure to environmental toxins as determined by meconium analysis. Neurotoxicology. 2002;23:329–339. doi: 10.1016/s0161-813x(02)00077-3. [DOI] [PubMed] [Google Scholar]
- 33.Qiao D, Seidler FJ, Slotkin TA. Developmental neurotoxicity of chlorpyrifos modeled in vitro: comparative effects of metabolites and other cholinesterase inhibitors on DNA synthesis in PC12 and C6 cells. Environmental Health Perspectives. 2001;109:909–913. doi: 10.1289/ehp.01109909. [DOI] [PMC free article] [PubMed] [Google Scholar]
- 34.Qiao D, Seidler FJ, Slotkin TA. Oxidative mechanisms contributing to the developmental neurotoxicity of nicotine and chlorpyrifos. Toxicology and Applied Pharmacology. 2005;206:17–26. doi: 10.1016/j.taap.2004.11.003. [DOI] [PubMed] [Google Scholar]
- 35.Qiao D, Seidler FJ, Violin JD, Slotkin TA. Nicotine is a developmental neurotoxicant and neuroprotectant: stage-selective inhibition of DNA synthesis coincident with shielding from effects of chlorpyrifos. Developmental Brain Research. 2003;147:183–190. doi: 10.1016/s0165-3806(03)00222-0. [DOI] [PubMed] [Google Scholar]
- 36.Reichardt LF. Neurotrophin-regulated signalling pathways. Phil Trans Royal Soc London B. 2006;361:1545–1564. doi: 10.1098/rstb.2006.1894. [DOI] [PMC free article] [PubMed] [Google Scholar]
- 37.Saarimaki-Vire J, Peltopuro P, Lahti L, Naserke T, Blak AA, Vogt Weisenhorn DM, Yu K, Ornitz DM, Wurst W, Partanen J. Fibroblast growth factor receptors cooperate to regulate neural progenitor properties in the developing midbrain and hindbrain. Journal of Neuroscience. 2007;27:8581–8592. doi: 10.1523/JNEUROSCI.0192-07.2007. [DOI] [PMC free article] [PubMed] [Google Scholar]
- 38.Shimogori T, Banuchi V, Ng HY, Strauss JB, Grove EA. Embryonic signaling centers expressing BMP, WNT and FGF proteins interact to pattern the cerebral cortex. Development. 2004;131:5639–5647. doi: 10.1242/dev.01428. [DOI] [PubMed] [Google Scholar]
- 39.Shimogori T, VanSant J, Paik E, Grove EA. Members of the Wnt, Fz, and Frp gene families expressed in postnatal mouse cerebral cortex. J Comp Neurol. 2004;473:496–510. doi: 10.1002/cne.20135. [DOI] [PubMed] [Google Scholar]
- 40.Slikker W, Xu ZA, Levin ED, Slotkin TA. Mode of action: disruption of brain cell replication, second messenger, and neurotransmitter systems during development leading to cognitive dysfunction — developmental neurotoxicity of nicotine. Critical Reviews in Toxicology. 2005;35:703–711. doi: 10.1080/10408440591007421. [DOI] [PubMed] [Google Scholar]
- 41.Slotkin TA. Cholinergic systems in brain development and disruption by neurotoxicants: nicotine, environmental tobacco smoke, organophosphates. Toxicology and Applied Pharmacology. 2004;198:132–151. doi: 10.1016/j.taap.2003.06.001. [DOI] [PubMed] [Google Scholar]
- 42.Slotkin TA. Developmental neurotoxicity of organophosphates: a case study of chlorpyrifos. In: Gupta RC, editor. Toxicity of Organophosphate and Carbamate Pesticides. Elsevier Academic Press; San Diego: 2005. pp. 293–314. [Google Scholar]
- 43.Slotkin TA. Guidelines for developmental neurotoxicity and their impact on organophosphate pesticides: a personal view from an academic perspective. Neurotoxicology. 2004;25:631–640. doi: 10.1016/S0161-813X(03)00050-0. [DOI] [PubMed] [Google Scholar]
- 44.Slotkin TA, Auman JT, Seidler FJ. Ontogenesis of β-adrenoceptor signaling: implications for perinatal physiology and for fetal effects of tocolytic drugs. Journal of Pharmacology and Experimental Therapeutics. 2003;306:1–7. doi: 10.1124/jpet.102.048421. [DOI] [PubMed] [Google Scholar]
- 45.Slotkin TA, Bodwell BE, Levin ED, Seidler FJ. Neonatal exposure to low doses of diazinon: long-term effects on neural cell development and acetylcholine systems. Environmental Health Perspectives. 2008;116:340–348. doi: 10.1289/ehp.11005. [DOI] [PMC free article] [PubMed] [Google Scholar]
- 46.Slotkin TA, Cousins MM, Tate CA, Seidler FJ. Persistent cholinergic presynaptic deficits after neonatal chlorpyrifos exposure. Brain Res. 2001;902:229–243. doi: 10.1016/s0006-8993(01)02387-3. [DOI] [PubMed] [Google Scholar]
- 47.Slotkin TA, Levin ED, Seidler FJ. Comparative developmental neurotoxicity of organophosphate insecticides: effects on brain development are separable from systemic toxicity. Environmental Health Perspectives. 2006;114:746–751. doi: 10.1289/ehp.8828. [DOI] [PMC free article] [PubMed] [Google Scholar]
- 48.Slotkin TA, MacKillop EA, Ryde IT, Seidler FJ. Ameliorating the developmental neurotoxicity of chlorpyrifos: a mechanisms-based approach in PC12 cells. Environmental Health Perspectives. 2007;115:1306–1313. doi: 10.1289/ehp.10194. [DOI] [PMC free article] [PubMed] [Google Scholar]
- 49.Slotkin TA, MacKillop EA, Ryde IT, Tate CA, Seidler FJ. Screening for developmental neurotoxicity using PC12 cells: comparisons of organophosphates with a carbamate, an organochlorine and divalent nickel. Environmental Health Perspectives. 2007;115:93–101. doi: 10.1289/ehp.9527. [DOI] [PMC free article] [PubMed] [Google Scholar]
- 50.Slotkin TA, Seidler FJ. Comparative developmental neurotoxicity of organophosphates in vivo: transcriptional responses of pathways for brain cell development, cell signaling, cytotoxicity and neurotransmitter systems. Brain Research Bulletin. 2007;72:232–274. doi: 10.1016/j.brainresbull.2007.01.005. [DOI] [PMC free article] [PubMed] [Google Scholar]
- 51.Slotkin TA, Seidler FJ, Fumagalli F. Exposure to organophosphates reduces the expression of neurotrophic factors in neonatal rat brain regions: similarities and differences in the effects of chlorpyrifos and diazinon on the fibroblast growth factor superfamily. Environmental Health Perspectives. 2007;115:909–916. doi: 10.1289/ehp.9901. [DOI] [PMC free article] [PubMed] [Google Scholar]
- 52.Slotkin TA, Seidler FJ, Fumagalli F. Targeting of neurotrophic factors, their receptors, and signaling pathways in the developmental neurotoxicity of organophosphates in vivo and in vitro. Brain Research Bulletin. 2008;76:424–438. doi: 10.1016/j.brainresbull.2008.01.001. [DOI] [PMC free article] [PubMed] [Google Scholar]
- 53.Song X, Violin JD, Seidler FJ, Slotkin TA. Modeling the developmental neurotoxicity of chlorpyrifos in vitro: macromolecule synthesis in PC12 cells. Toxicology and Applied Pharmacology. 1998;151:182–191. doi: 10.1006/taap.1998.8424. [DOI] [PubMed] [Google Scholar]
- 54.Sutton LP, Honardoust D, Mouyal J, Rajakumar N, Rushlow WJ. Activation of the canonical Wnt pathway by the antipsychotics haloperidol and clozapine involves dishevelled-3. Journal of Neurochemistry. 2007;102:153–169. doi: 10.1111/j.1471-4159.2007.04527.x. [DOI] [PubMed] [Google Scholar]
- 55.Szpir M. Tracing the origins of autism: a spectrum of new studies. Environmental Health Perspectives. 2006;114:A412–A417. doi: 10.1289/ehp.114-a412. [DOI] [PMC free article] [PubMed] [Google Scholar]
- 56.Teng KK, Greene LA. Cultured PC12 cells: a model for neuronal function and differentiation. In: Celis JE, editor. Cell Biology: A Laboratory Handbook. Academic Press; San Diego: 1994. pp. 218–224. [Google Scholar]
- 57.Timofeeva OA, Roegge CS, Seidler FJ, Slotkin TA, Levin ED. Persistent cognitive alterations in rats after early postnatal exposure to low doses of the organophosphate pesticide, diazinon. Neurotoxicology and Teratology. 2008;30:38–45. doi: 10.1016/j.ntt.2007.10.002. [DOI] [PMC free article] [PubMed] [Google Scholar]
- 58.Tuler SM, Hazen AA, Bowen JM. Release and metabolism of dopamine in a clonal line of pheochromocytoma (PC12) cells exposed to fenthion. Fund Appl Toxicol. 1989;13:484–492. doi: 10.1016/0272-0590(89)90284-4. [DOI] [PubMed] [Google Scholar]
- 59.Weiss B, Amler S, Amler RW. Pesticides. Pediatrics. 2004;113:1030–1036. [PubMed] [Google Scholar]
- 60.Yanai J, Beer A, Huleihel R, Izrael M, Katz S, Levi Y, Rozenboim I, Yaniv SP, Slotkin TA. Convergent effects on cell signaling mechanisms mediate the actions of different neurobehavioral teratogens: alterations in cholinergic regulation of PKC in chick and avian models. Annals of the New York Academy of Sciences. 2004;1025:595–601. doi: 10.1196/annals.1316.074. [DOI] [PubMed] [Google Scholar]
- 61.Yanai J, Vatury O, Slotkin TA. Cell signaling as a target and underlying mechanism for neurobehavioral teratogenesis. Annals of the New York Academy of Sciences. 2002;965:473–478. doi: 10.1111/j.1749-6632.2002.tb04188.x. [DOI] [PubMed] [Google Scholar]
- 62.Zhou CJ, Borello U, Rubenstein JL, Pleasure SJ. Neuronal production and precursor proliferation defects in the neocortex of mice with loss of function in the canonical Wnt signaling pathway. Neuroscience. 2006;142:1119–1131. doi: 10.1016/j.neuroscience.2006.07.007. [DOI] [PubMed] [Google Scholar]