

Abstract
In the studies of force-induced conformational transitions of biomolecules, the large timescale difference from experiments presents the challenge of obtaining convergent sampling for molecular dynamics simulations. To circumvent this fundamental problem, an approach combining the replica-exchange method and umbrella sampling (REM-US) was developed to simulate mechanical stretching of biomolecules under equilibrium conditions. Equilibrium properties of conformational transitions can be obtained directly from simulations without further assumptions. To test the performance, we carried out REM-US simulations of atomic force microscope (AFM) stretching and relaxing measurements on the polysaccharide pustulan, a (1→6)-β-D-glucan, which undergoes well-characterized rotameric transitions in the backbone bonds. With significantly enhanced sampling convergence and efficiency, the REM-US approach closely reproduced the equilibrium force-extension curves measured in AFM experiments. Consistent with the reversibility in the AFM measurements, the new approach generated identical force-extension curves in both stretching and relaxing simulations—an outcome not reported in previous studies, proving that equilibrium conditions were achieved in the simulations. REM-US may provide a robust approach to modeling of mechanical stretching on polysaccharides and even nucleic acids.
Introduction
Knowledge of the conformational dynamics of biomolecules is essential to study their functions. Even biomolecules that maintain relatively stable structures in their normal states may be subject to conformational transitions, or even significant structural changes, during biochemical reactions or physiological processes. However, investigating the conformational space of biomolecules is challenging, because some of the conformational transitions are too rare to be observed in computational simulations. To observe the rare transitions, an efficient method is to add energy to the system to help overcome energy barriers; e.g., heating proteins accelerates the unfolding.
On the experimental side, the development of micromanipulators, such as atomic force microscopes (AFMs) (1), optical tweezers (2,3), and magnetic tweezers (4), has enabled direct measurement and manipulation of single molecules. AFMs or laser/magnetic tweezers can stretch a single chain of protein, nucleic acid, or polysaccharide, and induce conformational transitions (3–20). The mechanical tensions exerted on the molecules can reach as high as a few thousand piconewtons, efficiently leading the molecules to high-energy conformational regions. From the measured force-extension curves, one can derive the dynamic details of possible conformational transitions and even kinetic and thermodynamic properties (21–27). To facilitate the recovery of conformational transitions from force-extension curves, computer simulations are usually performed as important supplements. Through simulations, one can obtain the conformations, thermodynamics, and force spectra of the transitions at the atomic level and thus gain insights into the experimental results from a microscopic perspective.
The most prevalent approaches to modeling molecules under external mechanical forces are steered molecular dynamics (SMD) (28) and biased MD method (18,29). Many MD simulations have successfully modeled the stretching processes of various biological molecular systems, including proteins, nucleic acids, and polysaccharides (15,19,31–34,36–49,51–59). AFM experiments with slow scanning speed can stretch the molecules at quasi-equilibrium, producing nearly identical force-extension curves for the stretching and relaxing processes (60–62). However, MD simulations may produce significant hysteresis in the force-extension curves (44). An important reason for the discrepancies between MD simulations and single-molecule stretching experiments is the significant difference in timescale. In experiments, the force spectrum of a biopolymer chain with 103 monomers is usually scanned for seconds, which corresponds to ∼10−3 s per monomer. In contrast, a typical MD simulation of ∼10 monomers can sample the stretching process for the microsecond range at most, which corresponds to ∼10−7 s per monomer. The several-orders-of-magnitude difference in the timescale drives the MD simulations far away from the quasiequilibrium condition. In the stretching processes, the AFM can induce numerous occurrences of back-and-forth conformational transitions at a certain extension, whereas the simulations usually cannot sufficiently sample these transitions. The insufficient and nonequilibrium sampling may lead to unconverged potential of mean force surfaces and introduce errors in the force spectra. A brute-force simulation with the sampling time increased to the experimental timescale, however, requires several-orders-of-magnitude more computational cost, which is neither economical nor practical. Therefore, techniques with enhanced sampling efficiency are critical for accurate simulations.
In previous work, we attempted to combine the replica exchange method (REM) (63) with SMD to alleviate the convergence problem (44). The exchange between replicas at different temperatures helps the molecules overcome energy barriers, and thus promotes transitions among different conformations. The employment of REM and related methods has been shown to improve the convergence of the conformational sampling for several biomolecular systems (64–71). In our previous study on a polysaccharide, the simulation using REM-SMD generated force-extension curves with much smaller discrepancies between the stretching and relaxing processes (44). However, the improved convergence with REM still cannot change the nonequilibrium condition because the restraint force remains time-dependent in the simulation. To obtain equilibrium properties in SMD simulations, extra effort using the Jarzynski equality is needed to reconstruct the potential of mean force from the irreversible work (21–23,41,72,73).
To avoid such transformations, here we use the umbrella sampling method to simulate mechanical stretching of molecules directly under equilibrium conditions. In umbrella sampling, a series of time-independent spring forces is applied to the molecular chain at different equilibrium positions, forming a set of sampling windows that covers the desired extension range. The results from each sampling window can be combined to reconstruct the entire potential of mean force using the weighted histogram analysis method (WHAM) (75,76). The critical benefit of this method is that an umbrella sampling simulation is composed of a set of discrete and time-independent ensembles (i.e., the sampling windows), each with a corresponding time-independent restraint force. Because of the time-independence of the ensembles, umbrella sampling allows the simulations to be performed in an arbitrary order, which further enables efficient parallel computation. Combined with the enhanced convergence and straightforward parallelization of REM, we arrive at an approach, termed REM-US, that gains both sampling efficiency and computational speed for the simulation of mechanically induced conformational transitions. Using umbrella sampling by itself to simulate force-extension curves from AFM experiments tends to increase the statistical error as compared to SMD because the independent trajectories may not have sufficient overlaps between each other. The combination of REM with umbrella sampling can alleviate this problem dramatically by enhancing the transitions. Although similar techniques have been suggested in the simulations of mechanical unfolding of protein (68), the performance of the REM in protein systems is limited by the large system size and the high complexity (77). To maintain sufficient overlap of the phase space in the REM, the required number of replicas increases proportional to the square root of the degrees of freedom of the system (77). The desired number of replicas increases quickly as the system complexity increases, which can easily exceed 102–103 for a typical protein system, especially when explicit solvent is included—thus prohibiting an efficient simulation with practical cost. The improvement by the REM is usually more significant in the systems with small sizes or a highly repeating sequence. Thus, the approach REM-US is especially suitable for the sampling of the mechanical stretching of polysaccharides and nucleic acids. In this article, we reached a protocol combining two existing sampling techniques, the replica exchange and umbrella sampling, to address the efficiency and convergence issue of the simulation of mechanical stretching of biopolymers. To illustrate the effectiveness of this approach, we performed simulations on pustulan, a well-parameterized and studied polysaccharide.
Theory
The force spectrum measured in a single-molecule stretching experiment records the relationship between the extension and the force exerted by the instrument on a single molecule. Assuming that the sampling in a MD simulation is at equilibrium, this force 〈F〉x can be interpreted as the ensemble average of the force at extension x,
| (1) |
P(F|x) is the probability of a given force F at a given extension x, which is defined as
| (2) |
where E0 is the native potential energy of the system, β is the inverse of the Boltzmann constant times the temperature, and Γ represents coordinate space. Combining Eqs. 1 and 2, we can write the average force as
| (3) |
| (4) |
| (5) |
| (6) |
This derivation shows that the average force is equivalent to the derivative of the potential of mean force (PMF), A0(x), with respect to the stretching extension, x. To obtain the PMF, we first note its relation to the probability distribution of the extension ρ0(x),
| (7) |
| (8) |
A simulation with converged sampling theoretically provides knowledge of the entire phase space. In practice, however, the sampling at long extensions is too sparse to produce a PMF for the entire region of interest. Therefore, several sampling techniques, such as thermodynamic integration (78), free energy perturbation (79), and umbrella sampling (80), are commonly used to obtain the PMF. Here we choose the umbrella sampling method because of its natural similarity to the stretching experiments. By imposing a series of harmonic restraints on the system, we can divide the stretching process into a set of discrete windows with bias potentials of
| (9) |
| (10) |
where Wi(x) is the harmonic potential that restrains the system near the extension xi.
After we sample the system using different bias potentials, the weighted histogram analysis method (WHAM) can be used to combine the sampling results, reconstructing the original probability distribution ρ0(x) and the PMF A0(x) (75,76). In WHAM, the original probability distribution can be restored from the biased probability distributions from the different sampling windows as
| (11) |
where ρib is the biased probability distribution of the extension from the ith sampling window with bias potential Ei; ni is the number of snapshots in the ith window; L is the number of sampling windows; and fi values are free energy parameters that can be obtained from the following self-consistent relation (81)
| (12) |
According to Eqs. 6, 8, and 11, we can regain the entire force spectrum from the umbrella sampling trajectories using WHAM,
| (13) |
An immediate advantage of the umbrella sampling approach is that the sampling of ρib(x) can be efficiently performed in parallel, thus the entire simulation can be carried out within a much shorter wall-time.
Even though umbrella sampling can achieve much better sampling of conformational space, it may still be insufficient to fulfill convergence requirement, especially in the degrees of freedom orthogonal to the extension coordinate, i.e., the conformational changes that bring little change to the overall extension of the polymer chain. The imposed restraint on the extension may even increase the barriers for conformational changes and trap the system in a potential well in phase space (44). Therefore, we combine REM and the umbrella sampling approach to accelerate the rate of barrier crossing and enhance the sampling of conformational transitions that are not induced by extension changes. For each umbrella sampling window, we perform replica-exchange simulations with M replicas at different temperatures {T1, T2, ···, TM}. The transition probability between any two trajectories Γk and Γl among the M replicas is
| (14) |
| (15) |
After the simulations, only trajectories at the original temperature (T1) are used to generate the biased probability distribution for the corresponding umbrella sampling window. We here take the most straightforward implementation of REM for simplicity; however, the statistical error may be further reduced using maximum likelihood estimation based on the sampling data from the rest trajectories at higher temperatures (82,83). By integrating these two techniques, we obtained a combined REM-US approach for the simulation of force spectra in single-molecule stretching experiments.
Computational details
To assess the efficiency and convergence of the REM-US approach, we performed simulations for pustulan, a polysaccharide composed of (1→6) linked β-D-glucopyranoside monomers. A fragment with 10 monomers was studied here. AFM experiments and previous simulations indicate that, under the external mechanical tension, the pustulan chain undergoes transitions that involve induced rotations of the C5-C6 bonds (84,85). In these conformational transitions, the rings change from the gauche-trans (gt) and gauche-gauche (gg) rotamers to the trans-gauche (tg) rotamer as shown in Fig. 1. We chose to use the pustulan molecule as our benchmark study here because the induced conformational transitions in pustulan are relatively simple and they are correctly represented by the recently developed carbohydrate solution force field (84,85).
Figure 1.
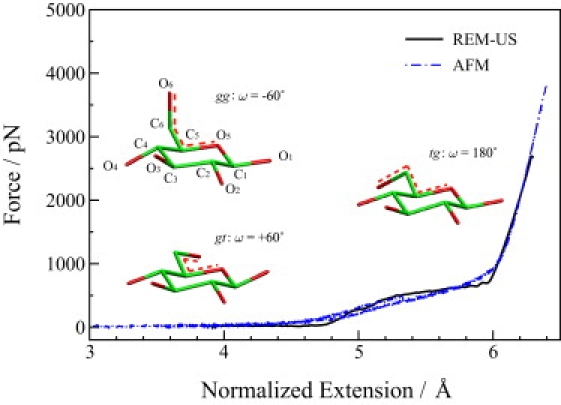
Comparison of force spectra obtained from the REM-US simulations (black solid line) and AFM experiments (blue dash-dot lines) (43). Three major conformations involved in the stretching process are shown in the plot, corresponding to the rotamers: gauche-gauche (gg), with the dihedral angle O6-C6-C5-O5 (denoted by the red dashed lines in the molecules), ω = −60°; gauche-trans (gt), with ω = +60°; and trans-gauche (tg), with ω = 180°.
The MD simulations of the pustulan fragment were performed using the SIGMA program (87,88). An implicit solvent model was used with a dielectric constant of 80. Our previous study on the solvent effect indicates that the explicit solvent and possible hydrogen bonding are not critical factors in the elasticity of (1→6) linked polysaccharides, such as pustulan (89). To demonstrate the effect of REM, two sets of umbrella sampling simulations with and without REM were carried out and the results were compared. For each set of simulations, stretching, relaxing, and parallel processes were modeled to test the convergence of the sampling. In the stretching process, the umbrella sampling started from an equilibrated pustulan chain at x1 = 40.0 Å with no external force. As the chain was stretched, sampling was performed in a sequential manner, using the last snapshot from the previous sampling window as the initial conformation for the current window. The restraint position xi in Eq. 10 was increased by a constant increment of 0.5 Å, until reaching 65 Å for the 10-ring pustulan chain. The whole process was divided into 50 sampling windows. After the stretching process, an analogous, sequential relaxing process was performed, with an initial restraint position of xi = 65 Å and decreasing by 0.5 Å in each window. Simulations were carried out for 20 ns in each window for both the stretching and relaxing processes. For the parallel sampling, the initial structures of the pustulan chain were taken from a previous SMD simulation (84), but the initial structures could also be generated using a sequential procedure with a much shorter simulation time. Since the 50 sampling windows could be simulated simultaneously, up to 50-fold longer simulation time could be accumulated for each window than for the sequential approach. Hence, in the parallel sampling, the simulation time for each window was increased to 200 ns for the umbrella sampling simulation and 40 ns for the REM-US simulation. The REM-US simulations were performed with 12 replicas for each sampling window, with the temperature distributed exponentially between 300 K and 600 K. The acceptance ratio for exchange among different replicas was 0.40 ± 0.01.
Results and Discussion
Force spectra
We obtain very good agreement between the calculated REM-US and experimental AFM force-extension curves as the comparison in Fig. 1 shows. From both the AFM measurements and simulation results, certain transitions are observed when the normalized extension is between 5.0 and 6.0 Å. These transitions are believed to be conformational changes from the gg and gt rotamers to the tg rotamer. The mechanical force required to induce such transitions ranges from 200 to 800 pN.
The SMD and umbrella sampling approaches are very similar in that both impose extension restraints on the molecules during the stretching processes. Therefore, we expect to obtain similar force-extension curves with these two approaches. Adding REM to the umbrella sampling simulation should improve the sampling convergence; thus, we expect to observe a force spectrum with lower forces in the stretched region. As shown in Fig. 2, comparison of the force-extension curves obtained from the three different approaches agrees with our expectations. The force-extension curves obtained using the SMD and umbrella sampling approaches overlap very well for the stretching process, and both have unusually large forces for extensions of 5.5–6.0 Å. However, the REM-US approach generates a smooth force curve for the entire transition. From the inset of Fig. 2, we can clearly see that REM-US lowers the tension forces by >500 pN at the end of the transition region.
Figure 2.
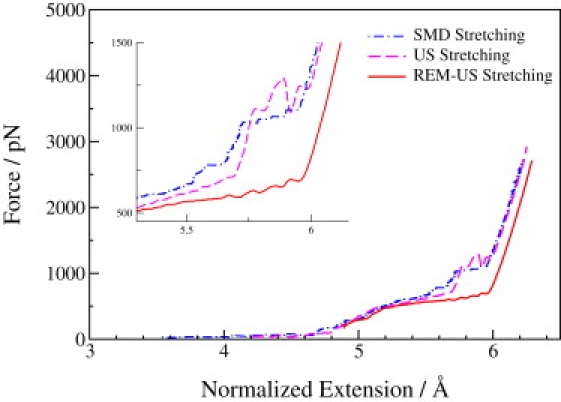
Force spectra of the stretching process obtained using SMD (blue dash-dot line), umbrella sampling (magenta dash line), and REM-US (red solid line). (Inset) Zoom-in of the region 5.5–6.0 Å, to better demonstrate the discrepancies of the force among different methods.
To better demonstrate how much REM-US enhanced the sampling convergence, we performed both umbrella sampling and REM-US simulations for the stretching, relaxing, and parallel processes. The results are compared in Fig. 3. Obvious discrepancies are observed among the different processes using the umbrella sampling approach. In the region with extensions of 5.5–6.0 Å, the forces in the stretching process are much larger than those in the relaxing process, producing significant hysteresis that is not observed experimentally. The parallel simulation, which was performed with 10-times' longer simulation time, produced a force curve in the middle of the hysteresis loop. In contrast, the REM-US simulation generated almost identical force-extension curves for all three different processes, indicating that the sampling of the conformational space of the pustulan chain is well converged. The excellent reproducibility of the force curves clearly demonstrates that REM-US provides a significant enhancement in convergence of the umbrella sampling approach. Furthermore, the REM-US approach allows samplings of the force-extension curve using the parallel process, which is computationally much more efficient than either the sequential stretching or relaxing processes.
Figure 3.
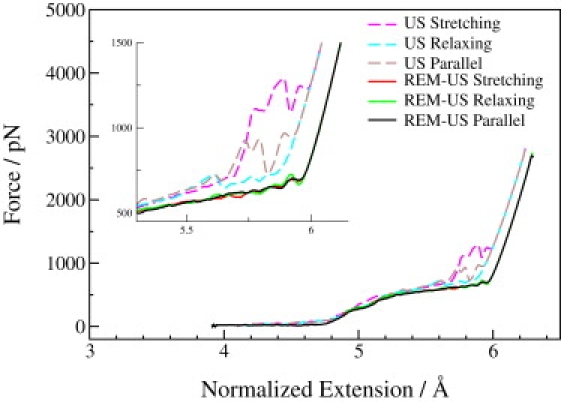
Convergence comparison of the force spectra for the stretching, relaxing, and parallel processes using the umbrella sampling and the REM-US approach. (Inset) Zoom-in of the region 5.5–6.0 Å.
Conformational changes
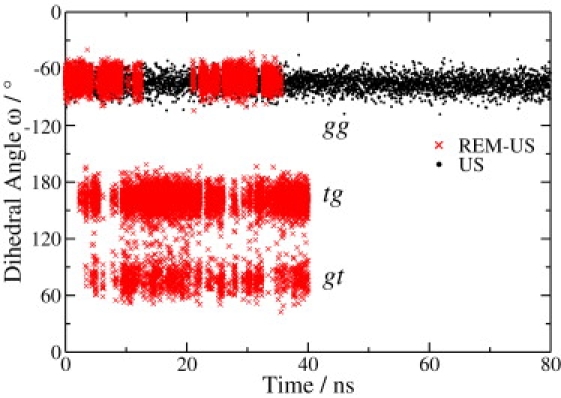
To ascertain the conformational transitions in the pyranose rings, we monitored the following three important dihedral angles: ω (O6-C6-C5-O5), t1(O1-C1-C2-O2), and t2(O3-C3-C4-O4). The dihedral angle ω characterizes the rotameric conformations around the C6-C5 bond, whereas the t1 and t2 angles describe the conformations of the pyranose rings (e.g., chair and boat). Monitoring these angles should capture the possible conformational transitions in the pyranose rings. In Fig. 4, we show the distribution of the dihedral angles ω, t1, and t2 at various extensions. It can be seen that the dihedral angles t1 and t2 fluctuate mildly at ∼−60°, indicating that the pyranose rings remain stable in the chair conformation without flipping into the boat or inverted chair conformations. For the torsion ω, the distribution shows two centers at ∼−60° and +60° at shorter extensions, corresponding to the gg and gt rotamers, respectively. As the extension of the pustulan chain increases, the torsion ω gradually evolves to ∼180°, which corresponds to the tg rotamer. This conformational transition mode agrees well with the results of previous studies using the SMD method (84).
Figure 4.
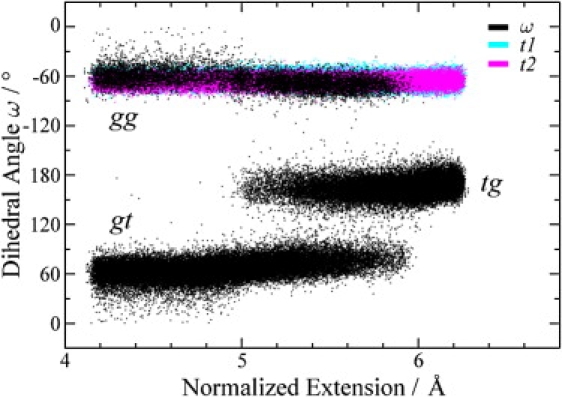
Trajectories of dihedral angles ω (black), t1 (cyan), and t2 (magenta) from the REM-US simulation. The dihedral angle ω characterizes the conformational changes from rotamer gg and gt to tg.
Although the general trend in the conformational transitions obtained from REM-US, umbrella sampling, and SMD simulations are similar, obvious discrepancies exist in the force spectra within the extension range from 5.5 Å to 6.0 Å. After comparing the trajectories generated using the umbrella sampling and REM-US approaches, we found that REM-US significantly promotes the rate of rotameric transitions. If the simulation time is long enough to allow sufficient sampling of the rotameric transitions in each ring, equilibrium can be assumed to be valid and the sampling can thus produce converged results. However, this is not the case for the umbrella sampling simulation of pustulan. This point is illustrated in Fig. 5 by the trajectories of the dihedral angle ω of ring 5, obtained using umbrella sampling (black trace) and the REM-US approach (red trace), for the window with xi = 58 Å. Ring 5 remains in the gg rotamer during the entire 80-ps umbrella sampling simulation, but undergoes many transitions among the gg, gt, and tg rotamers during the 40-ps REM-US simulation. This difference clearly shows that the replicas at high temperatures in the REM-US simulation can help the rings to overcome the barriers and thus enhance the rate of such transitions.
Figure 5.
Time evolution of the dihedral angle ω of ring 5 in the trajectories with xi = 58.0 Å. (Black trace) Umbrella sampling simulation; (red trace) REM-US simulation. The wide distribution of the dihedral angles ω from the REM-US simulation indicates the frequent conformational changes among different rotamers gg, gt, and tg.
Conclusion
Our results indicate that the combination of the replica exchange method and umbrella sampling provides an efficient approach to the equilibrium sampling of force-induced conformational transitions. We demonstrate excellent sampling convergence and high computational efficiency in the application of polysaccharide. This approach also holds great potential for the modeling of mechanically induced transitions in other biopolymers such as nucleic acids.
Acknowledgments
Support from the National Science Foundation (grant No. NSF-MCB-07-17770), the Kirgbaum-Pearson Fellowship, and the Fellowship of the Center for Theoretical and Mathematical Sciences is greatly appreciated.
Contributor Information
Piotr E. Marszalek, Email: pemar@duke.edu.
Weitao Yang, Email: weitao.yang@duke.edu.
References
- 1.Binnig G., Quate C.F., Gerber C. Atomic force microscope. Phys. Rev. Lett. 1986;56:930–933. doi: 10.1103/PhysRevLett.56.930. [DOI] [PubMed] [Google Scholar]
- 2.Perkins T.T., Smith D.E., Chu S. Direct observation of tube-like motion of a single polymer chain. Science. 1994;264:819–822. doi: 10.1126/science.8171335. [DOI] [PubMed] [Google Scholar]
- 3.Smith S.B., Cui Y., Bustamante C. Overstretching B-DNA: the elastic response of individual double-stranded and single-stranded DNA molecules. Science. 1996;271:795–799. doi: 10.1126/science.271.5250.795. [DOI] [PubMed] [Google Scholar]
- 4.Gosse C., Croquette V. Magnetic tweezers: micromanipulation and force measurement at the molecular level. Biophys. J. 2002;82:3314–3329. doi: 10.1016/S0006-3495(02)75672-5. [DOI] [PMC free article] [PubMed] [Google Scholar]
- 5.Kellermayer M.S., Smith S.B., Bustamante C. Folding-unfolding transitions in single titin molecules characterized with laser tweezers. Science. 1997;276:1112–1116. doi: 10.1126/science.276.5315.1112. [DOI] [PubMed] [Google Scholar]
- 6.Tskhovrebova L., Trinick J., Simmons R.M. Elasticity and unfolding of single molecules of the giant muscle protein titin. Nature. 1997;387:308–312. doi: 10.1038/387308a0. [DOI] [PubMed] [Google Scholar]
- 7.Wang M.D., Yin H., Block S.M. Stretching DNA with optical tweezers. Biophys. J. 1997;72:1335–1346. doi: 10.1016/S0006-3495(97)78780-0. [DOI] [PMC free article] [PubMed] [Google Scholar]
- 8.Rief M., Gautel M., Gaub H.E. Reversible unfolding of individual titin immunoglobulin domains by AFM. Science. 1997;276:1109–1112. doi: 10.1126/science.276.5315.1109. [DOI] [PubMed] [Google Scholar]
- 9.Rief M., Oesterhelt F., Gaub H.E. Single molecule force spectroscopy on polysaccharides by atomic force microscopy. Science. 1997;275:1295–1297. doi: 10.1126/science.275.5304.1295. [DOI] [PubMed] [Google Scholar]
- 10.Li H.B., Rief M., Gaub H.E. Single-molecule force spectroscopy on Xanthan by AFM. Adv. Mater. 1998;10:316–319. [Google Scholar]
- 11.Li H.B., Rief M., Shen J.C. Single-molecule force spectroscopy on polysaccharides by AFM-nanomechanical fingerprint of α-(1,4)-linked polysaccharides. Chem. Phys. Lett. 1999;305:197–201. [Google Scholar]
- 12.Brant D.A. Novel approaches to the analysis of polysaccharide structures. Curr. Opin. Struct. Biol. 1999;9:556–562. doi: 10.1016/s0959-440x(99)00005-6. [DOI] [PubMed] [Google Scholar]
- 13.Marszalek P.E., Oberhauser A.F., Fernandez J.M. Polysaccharide elasticity governed by chair-boat transitions of the glucopyranose ring. Nature. 1998;396:661–664. doi: 10.1038/25322. [DOI] [PubMed] [Google Scholar]
- 14.Carrion-Vazquez M., Oberhauser A.F., Fernandez J.M. Mechanical and chemical unfolding of a single protein: a comparison. Proc. Natl. Acad. Sci. USA. 1999;96:3694–3699. doi: 10.1073/pnas.96.7.3694. [DOI] [PMC free article] [PubMed] [Google Scholar]
- 15.Marszalek P.E., Lu H., Fernandez J.M. Mechanical unfolding intermediates in titin modules. Nature. 1999;402:100–103. doi: 10.1038/47083. [DOI] [PubMed] [Google Scholar]
- 16.Marszalek P.E., Li H.B., Fernandez J.M. Fingerprinting polysaccharides with single-molecule atomic force microscopy. Nat. Biotechnol. 2001;19:258–262. doi: 10.1038/85712. [DOI] [PubMed] [Google Scholar]
- 17.Marszalek P.E., Oberhauser A.F., Fernandez J.M. The force-driven conformations of heparin studied with single molecule force microscopy. Biophys. J. 2003;85:2696–2704. doi: 10.1016/s0006-3495(03)74692-x. [DOI] [PMC free article] [PubMed] [Google Scholar]
- 18.Paci E., Karplus M. Unfolding proteins by external forces and temperature: the importance of topology and energetics. Proc. Natl. Acad. Sci. USA. 2000;97:6521–6526. doi: 10.1073/pnas.100124597. [DOI] [PMC free article] [PubMed] [Google Scholar]
- 19.Paci E., Caflisch A., Karplus M. Forces and energetics of hapten-antibody dissociation: a biased molecular dynamics simulation study. J. Mol. Biol. 2001;314:589–605. doi: 10.1006/jmbi.2001.5103. [DOI] [PubMed] [Google Scholar]
- 20.Fowler S.B., Best R.B., Clarke J. Mechanical unfolding of a titin Ig domain: structure of unfolding intermediate revealed by combining AFM, molecular dynamics simulations, NMR and protein engineering. J. Mol. Biol. 2002;322:841–849. doi: 10.1016/s0022-2836(02)00805-7. [DOI] [PubMed] [Google Scholar]
- 21.Hummer G., Szabo A. Free energy reconstruction from nonequilibrium single-molecule pulling experiments. Proc. Natl. Acad. Sci. USA. 2001;98:3658–3661. doi: 10.1073/pnas.071034098. [DOI] [PMC free article] [PubMed] [Google Scholar]
- 22.Hummer G., Szabo A. Kinetics from nonequilibrium single-molecule pulling experiments. Biophys. J. 2003;85:5–15. doi: 10.1016/S0006-3495(03)74449-X. [DOI] [PMC free article] [PubMed] [Google Scholar]
- 23.Hummer G., Szabo A. Free energy surfaces from single-molecule force spectroscopy. Acc. Chem. Res. 2005;38:504–513. doi: 10.1021/ar040148d. [DOI] [PubMed] [Google Scholar]
- 24.Dudko O.K., Hummer G., Szabo A. Intrinsic rates and activation free energies from single-molecule pulling experiments. Phys. Rev. Lett. 2006;96:108101. doi: 10.1103/PhysRevLett.96.108101. [DOI] [PubMed] [Google Scholar]
- 25.Dudko O.K., Mathé J., Hummer G. Extracting kinetics from single-molecule force spectroscopy: nanopore unzipping of DNA hairpins. Biophys. J. 2007;92:4188–4195. doi: 10.1529/biophysj.106.102855. [DOI] [PMC free article] [PubMed] [Google Scholar]
- 26.Dudko O.K., Hummer G., Szabo A. Theory, analysis, and interpretation of single-molecule force spectroscopy experiments. Proc. Natl. Acad. Sci. USA. 2008;105:15755–15760. doi: 10.1073/pnas.0806085105. [DOI] [PMC free article] [PubMed] [Google Scholar]
- 27.Best R.B., Paci E., Dudko O.K. Pulling direction as a reaction coordinate for the mechanical unfolding of single molecules. J. Phys. Chem. B. 2008;112:5968–5976. doi: 10.1021/jp075955j. [DOI] [PubMed] [Google Scholar]
- 28.Izrailev S., Stepaniants S., Schulten K. Molecular dynamics study of unbinding of the avidin-biotin complex. Biophys. J. 1997;72:1568–1581. doi: 10.1016/S0006-3495(97)78804-0. [DOI] [PMC free article] [PubMed] [Google Scholar]
- 29.Paci E., Karplus M. Forced unfolding of fibronectin type 3 modules: an analysis by biased molecular dynamics simulations. J. Mol. Biol. 1999;288:441–459. doi: 10.1006/jmbi.1999.2670. [DOI] [PubMed] [Google Scholar]
- 30.Reference deleted in proof.
- 31.Grubmüller H., Heymann B., Tavan P. Ligand binding: molecular mechanics calculation of the streptavidin-biotin rupture force. Science. 1996;271:997–999. doi: 10.1126/science.271.5251.997. [DOI] [PubMed] [Google Scholar]
- 32.Rief M., Grubmüller H. Force spectroscopy of single biomolecules. ChemPhysChem. 2002;3:255–261. doi: 10.1002/1439-7641(20020315)3:3<255::AID-CPHC255>3.0.CO;2-M. [DOI] [PubMed] [Google Scholar]
- 33.Heymann B., Grubmuller H. ‘Chair-boat’ transitions and side groups affect the stiffness of polysaccharides. Chem. Phys. Lett. 1999;305:202–208. [Google Scholar]
- 34.Heymann B., Grubmuller H. Elastic properties of poly(ethylene-glycol) studied by molecular dynamics stretching simulations. Chem. Phys. Lett. 1999;307:425–432. [Google Scholar]
- 35.Reference deleted in proof.
- 36.Lu H., Isralewitz B., Schulten K. Unfolding of titin immunoglobulin domains by steered molecular dynamics simulation. Biophys. J. 1998;75:662–671. doi: 10.1016/S0006-3495(98)77556-3. [DOI] [PMC free article] [PubMed] [Google Scholar]
- 37.Lu H., Schulten K. Steered molecular dynamics simulations of force-induced protein domain unfolding. Proteins. 1999;35:453–463. [PubMed] [Google Scholar]
- 38.Gao M., Lu H., Schulten K. Simulated refolding of stretched titin immunoglobulin domains. Biophys. J. 2001;81:2268–2277. doi: 10.1016/S0006-3495(01)75874-2. [DOI] [PMC free article] [PubMed] [Google Scholar]
- 39.Gao M., Craig D., Schulten K. Identifying unfolding intermediates of FN-III(10) by steered molecular dynamics. J. Mol. Biol. 2002;323:939–950. doi: 10.1016/s0022-2836(02)01001-x. [DOI] [PubMed] [Google Scholar]
- 40.Gao M., Wilmanns M., Schulten K. Steered molecular dynamics studies of titin I1 domain unfolding. Biophys. J. 2002;83:3435–3445. doi: 10.1016/S0006-3495(02)75343-5. [DOI] [PMC free article] [PubMed] [Google Scholar]
- 41.Park S., Schulten K. Calculating potentials of mean force from steered molecular dynamics simulations. J. Chem. Phys. 2004;120:5946–5961. doi: 10.1063/1.1651473. [DOI] [PubMed] [Google Scholar]
- 42.Lim B.B.C., Lee E.H., Schulten K. Molecular basis of fibrin clot elasticity. Structure. 2008;16:449–459. doi: 10.1016/j.str.2007.12.019. [DOI] [PubMed] [Google Scholar]
- 43.Lee G., Nowak W., Marszalek P.E. Nanomechanical control of glucopyranose rotamers. J. Am. Chem. Soc. 2004;126:6218–6219. doi: 10.1021/ja0491984. [DOI] [PubMed] [Google Scholar]
- 44.Lu Z., Hu H., Marszalek P.E. Simulating force-induced conformational transitions in polysaccharides with the SMD replica exchange method. Biophys. J. 2006;91:L57–L59. doi: 10.1529/biophysj.106.090324. [DOI] [PMC free article] [PubMed] [Google Scholar]
- 45.Marti-Renom M.A., Stote R.H., Karplus M. Structures of scrambled disulfide forms of the potato carboxypeptidase inhibitor predicted by molecular dynamics simulations with constraints. Proteins. 2000;40:482–493. [PubMed] [Google Scholar]
- 46.Klimov D.K., Thirumalai D. Native topology determines force-induced unfolding pathways in globular proteins. Proc. Natl. Acad. Sci. USA. 2000;97:7254–7259. doi: 10.1073/pnas.97.13.7254. [DOI] [PMC free article] [PubMed] [Google Scholar]
- 47.Hyeon C., Thirumalai D. Mechanical unfolding of RNA hairpins. Proc. Natl. Acad. Sci. USA. 2005;102:6789–6794. doi: 10.1073/pnas.0408314102. [DOI] [PMC free article] [PubMed] [Google Scholar]
- 48.Hyeon C., Thirumalai D. Forced-unfolding and force-quench refolding of RNA hairpins. Biophys. J. 2006;90:3410–3427. doi: 10.1529/biophysj.105.078030. [DOI] [PMC free article] [PubMed] [Google Scholar]
- 49.Paci E., Smith L.J., Karplus M. Exploration of partially unfolded states of human α-lactalbumin by molecular dynamics simulation. J. Mol. Biol. 2001;306:329–347. doi: 10.1006/jmbi.2000.4337. [DOI] [PubMed] [Google Scholar]
- 50.Reference deleted in proof.
- 51.Paci E., Vendruscolo M., Karplus M. Native and non-native interactions along protein folding and unfolding pathways. Proteins. 2002;47:379–392. doi: 10.1002/prot.10089. [DOI] [PubMed] [Google Scholar]
- 52.Paci E., Vendruscolo M., Karplus M. Determination of a transition state at atomic resolution from protein engineering data. J. Mol. Biol. 2002;324:151–163. doi: 10.1016/s0022-2836(02)00944-0. [DOI] [PubMed] [Google Scholar]
- 53.van der Vaart A., Ma J., Karplus M. The unfolding action of GroEL on a protein substrate. Biophys. J. 2004;87:562–573. doi: 10.1529/biophysj.103.037333. [DOI] [PMC free article] [PubMed] [Google Scholar]
- 54.Xu Y., Shen J., Jiang H. Conformational transition of amyloid β-peptide. Proc. Natl. Acad. Sci. USA. 2005;102:5403–5407. doi: 10.1073/pnas.0501218102. [DOI] [PMC free article] [PubMed] [Google Scholar]
- 55.Li P.-C., Makarov D.E. Theoretical studies of the mechanical unfolding of the muscle protein titin: bridging the time-scale gap between simulation and experiment. J. Chem. Phys. 2003;119:9260–9268. [Google Scholar]
- 56.Ma J.P., Flynn T.C., Karplus M. A dynamic analysis of the rotation mechanism for conformational change in F1-ATPase. Structure. 2002;10:921–931. doi: 10.1016/s0969-2126(02)00789-x. [DOI] [PubMed] [Google Scholar]
- 57.van der Vaart A., Karplus M. Simulation of conformational transitions by the restricted perturbation-targeted molecular dynamics method. J. Chem. Phys. 2005;122:114903. doi: 10.1063/1.1861885. [DOI] [PubMed] [Google Scholar]
- 58.van der Vaart A., Karplus M. Minimum free energy pathways and free energy profiles for conformational transitions based on atomistic molecular dynamics simulations. J. Chem. Phys. 2007;126:164106. doi: 10.1063/1.2719697. [DOI] [PubMed] [Google Scholar]
- 59.Adamovic I., Mijailovich S.M., Karplus M. The elastic properties of the structurally characterized myosin II S2 subdomain: a molecular dynamics and normal mode analysis. Biophys. J. 2008;94:3779–3789. doi: 10.1529/biophysj.107.122028. [DOI] [PMC free article] [PubMed] [Google Scholar]
- 60.Lee G., Abdi K., Marszalek P.E. Nanospring behavior of ankyrin repeats. Nature. 2006;440:246–249. doi: 10.1038/nature04437. [DOI] [PubMed] [Google Scholar]
- 61.Bornschlögl T., Rief M. Single-molecule dynamics of mechanical coiled-coil unzipping. Langmuir. 2008;24:1338–1342. doi: 10.1021/la7023567. [DOI] [PubMed] [Google Scholar]
- 62.Junker J.P., Ziegler F., Rief M. Ligand-dependent equilibrium fluctuations of single calmodulin molecules. Science. 2009;323:633–637. doi: 10.1126/science.1166191. [DOI] [PubMed] [Google Scholar]
- 63.Sugita Y., Okamoto Y. Replica-exchange molecular dynamics method for protein folding. Chem. Phys. Lett. 1999;314:141–151. [Google Scholar]
- 64.Sugita Y., Kitao A., Okamoto Y. Multidimensional replica-exchange method for free-energy calculations. J. Chem. Phys. 2000;113:6042–6051. [Google Scholar]
- 65.Murata K., Sugita Y., Okamoto Y. Free energy calculations for DNA base stacking by replica-exchange umbrella sampling. Chem. Phys. Lett. 2004;385:1–7. [Google Scholar]
- 66.Murata K., Sugita Y., Okamoto Y. Molecular dynamics simulations of DNA dimers based on replica-exchange umbrella sampling. I. Test of sampling efficiency. J. Theor. Comput. Chem. 2005;4:411–432. [Google Scholar]
- 67.Fukunishi H., Watanabe O., Takada S. On the Hamiltonian replica exchange method for efficient sampling of biomolecular systems: application to protein structure prediction. J. Chem. Phys. 2002;116:9058–9067. [Google Scholar]
- 68.Li P.-C., Huang L., Makarov D.E. Mechanical unfolding of segment-swapped protein G dimer: results from replica exchange molecular dynamics simulations. J. Phys. Chem. B. 2006;110:14469–14474. doi: 10.1021/jp056422i. [DOI] [PubMed] [Google Scholar]
- 69.Woods C.J., Essex J.W., King M.A. The development of replica-exchange-based free-energy methods. J. Phys. Chem. B. 2003;107:13703–13710. [Google Scholar]
- 70.Snow C.D., Sorin E.J., Pande V.S. How well can simulation predict protein folding kinetics and thermodynamics? Annu. Rev. Biophys. Biomol. Struct. 2005;34:43–69. doi: 10.1146/annurev.biophys.34.040204.144447. [DOI] [PubMed] [Google Scholar]
- 71.Ensing B., De Vivo M., Klein M.L. Metadynamics as a tool for exploring free energy landscapes of chemical reactions. Acc. Chem. Res. 2006;39:73–81. doi: 10.1021/ar040198i. [DOI] [PubMed] [Google Scholar]
- 72.Gullingsrud J.R., Braun R., Schulten K. Reconstructing potentials of mean force through time series analysis of steered molecular dynamics simulations. J. Comput. Phys. 1999;151:190–211. [Google Scholar]
- 73.Park S., Khalili-Araghi F., Schulten K. Free energy calculation from steered molecular dynamics simulations using Jarzynski's equality. J. Chem. Phys. 2003;119:3559–3566. [Google Scholar]
- 74.Reference deleted in proof.
- 75.Ferrenberg A.M., Swendsen R.H. Optimized Monte Carlo data analysis. Phys. Rev. Lett. 1989;63:1195–1198. doi: 10.1103/PhysRevLett.63.1195. [DOI] [PubMed] [Google Scholar]
- 76.Kumar S., Rosenberg J.M., Kollman P.A. THE weighted histogram analysis method for free-energy calculations on biomolecules. I. The method. J. Comput. Chem. 1992;13:1011–1021. [Google Scholar]
- 77.Cheng X., Cui G., Simmerling C. Modified replica exchange simulation methods for local structure refinement. J. Phys. Chem. B. 2005;109:8220–8230. doi: 10.1021/jp045437y. [DOI] [PMC free article] [PubMed] [Google Scholar]
- 78.Kirkwood J.G. Statistical mechanics of fluid mixtures. J. Chem. Phys. 1935;3:300–313. [Google Scholar]
- 79.Zwanzig R.W. High-temperature equation of state by a perturbation method. I. Nonpolar gases. J. Chem. Phys. 1954;22:1420–1426. [Google Scholar]
- 80.Torrie G.M., Valleau J.P. Nonphysical sampling distributions in Monte Carlo free-energy estimation: umbrella sampling. J. Comput. Phys. 1977;23:187–199. [Google Scholar]
- 81.Souaille M., Roux B. Extension to the weighted histogram analysis method: combining umbrella sampling with free energy calculations. Comp. Phys. Comm. 2001;135:40–57. [Google Scholar]
- 82.Maragakis P., Spichty M., Karplus M. Optimal estimates of free energies from multistate nonequilibrium work data. Phys. Rev. Lett. 2006;96:100602. doi: 10.1103/PhysRevLett.96.100602. [DOI] [PubMed] [Google Scholar]
- 83.Shirts M.R., Chodera J.D. Statistically optimal analysis of samples from multiple equilibrium states. J. Chem. Phys. 2008;129:124105. doi: 10.1063/1.2978177. [DOI] [PMC free article] [PubMed] [Google Scholar]
- 84.Lee G., Nowak W., Marszalek P.E. Molecular dynamics simulations of forced conformational transitions in 1,6-linked polysaccharides. Biophys. J. 2004;87:1456–1465. doi: 10.1529/biophysj.104.042879. [DOI] [PMC free article] [PubMed] [Google Scholar]
- 85.Kuttel M., Brady J.W., Naidoo K.J. Carbohydrate solution simulations: producing a force field with experimentally consistent primary alcohol rotational frequencies and populations. J. Comput. Chem. 2002;23:1236–1243. doi: 10.1002/jcc.10119. [DOI] [PubMed] [Google Scholar]
- 86.Reference deleted in proof.
- 87.Hu H., Elstner M., Hermans J. Comparison of a QM/MM force field and molecular mechanics force fields in simulations of alanine and glycine “dipeptides” (Ace-Ala-Nme and Ace-Gly-Nme) in water in relation to the problem of modeling the unfolded peptide backbone in solution. Proteins. 2003;50:451–463. doi: 10.1002/prot.10279. [DOI] [PubMed] [Google Scholar]
- 88.Mann, G., R.H. Yun, …, J. Hermans. 2002. Computational methods for macromolecules: challenges and applications. In Proceedings of the 3rd International Workshop on Algorithms for Macromolecular Modeling. Springer-Verlag, Berlin and New York.
- 89.Zhang Q., Marszalek P.E. Solvent effects on the elasticity of polysaccharide molecules in disordered and ordered states by single-molecule force spectroscopy. Polymer (Guildf.) 2006;47:2526–2532. [Google Scholar]