

Abstract
Förster resonance energy transfer (FRET) efficiency distributions in single-molecule experiments contain both structural and dynamical information. Extraction of this information from these distributions requires a careful analysis of contributions from dye photophysics. To investigate how mechanisms other than FRET affect the distributions obtained by counting donor and acceptor photons, we have measured single-molecule fluorescence trajectories of a small α/β protein, i.e., protein GB1, undergoing two-state, folding/unfolding transitions. Alexa 488 donor and Alexa 594 acceptor dyes were attached to cysteines at positions 10 and 57 to yield two isomers—donor10/acceptor57 and donor57/acceptor10—which could not be separated in the purification. The protein was immobilized via binding of a histidine tag added to a linker sequence at the N-terminus to cupric ions embedded in a polyethylene-glycol–coated glass surface. The distribution of FRET efficiencies assembled from the trajectories is complex with widths for the individual peaks in large excess of that caused by shot noise. Most of this complexity can be explained by two interfering photophysical effects—a photoinduced red shift of the donor dye and differences in the quantum yield of the acceptor dye for the two isomers resulting from differences in quenching rate by the cupric ion. Measurements of steady-state polarization, calculation of the donor-acceptor cross-correlation function from photon trajectories, and comparison of the single molecule and ensemble kinetics all indicate that conformational distributions and dynamics do not contribute to the complexity.
Introduction
Measurements of Förster resonance energy transfer (FRET) have proven to be a powerful and useful single molecule optical method in quantitative studies of biomolecular structure and dynamics (1–3). The most common experiment is to measure the equilibrium distribution of FRET efficiencies (E) by counting the number of donor (nD) and acceptor photons (nA) (E = nA/[nA + nD]). After taking shot-noise into account, this distribution contains at least two different kinds of information. The number of components corresponds to the minimal number of distinct subpopulations. The peak value for each component can yield accurate information on interdye distances for each subpopulation, but only after correcting for differences in the quantum yield and detection efficiencies for the donor and acceptor dyes and considering the dynamics of the linker between the dyes and the biomolecule (4,5). Although analyzed less frequently, there is also dynamical information in the shape of the FRET efficiency distribution, analogous to nuclear magnetic resonance line-broadening experiments, as developed in detail in the theoretical work of Gopich and Szabo (6–8) and Nir et al. (9). However, to determine the number of subpopulations and to extract structural and dynamical information from FRET efficiency distributions requires a careful analysis of all possible contributions to the widths of the components of the distribution.
A consistent finding up to now in protein folding studies of both freely diffusing and immobilized proteins is that the width of the FRET efficiency distribution for the unfolded subpopulation is broader than expected from shot noise alone (10–12). This excess width has been interpreted as arising from slow interconversion of conformations with different FRET efficiencies (5,10,11,13). One contribution that may turn out to be quite common in protein studies arises from the fact that the dyes used in FRET experiments can be readily quenched by interaction with amino acids such as tryptophan and tyrosine (14,15). To investigate the contributions to the width of FRET efficiency distributions, we have carried out a single-molecule FRET study of protein GB1, immobilized with a polyhistidine tag to a copper chelator embedded in a polyethylene-glycol–coated glass surface (Fig. 1). The cupric ion is a well-known quencher of dyes (16–18). We find that the FRET efficiency distributions are complex, with peaks having widths in excess of that produced by shot noise. From a variety of measurements, we conclude that this excess width is not due to slow conformational dynamics, but arises from dye photophysics. These measurements include: donor and acceptor lifetimes, steady-state polarizations, photon trajectories from which the donor-acceptor cross-correlation function can be calculated, waiting-time distributions in the folded and unfolded states, and comparison of ensemble relaxation rates with relaxation rates determined from the sum of the individual rate coefficients (the inverse of the mean waiting times).
Figure 1.
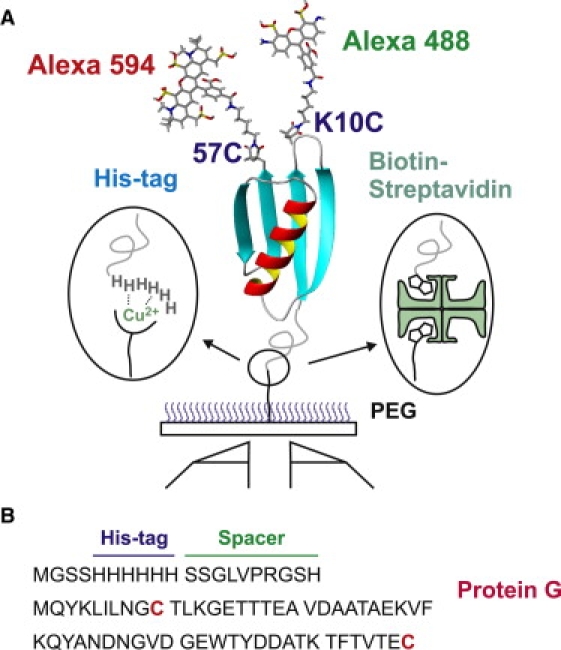
Design of the protein and immobilization of molecules. (A) Immobilization of dye-labeled proteins via his-tag–Cu2+ or biotin (protein)–streptavidin–biotin (surface) linkages on a polyethylene-glycol–coated glass surface. Donor (Alexa 488) and acceptor (Alexa 594) dyes are labeled at the cysteine residues at positions 10 and 57 of protein GB1 (His-GB1K10C/C57). The two isomers, donor10/acceptor57 and donor57/acceptor10, could not be separated in the purification. (B) Amino acid sequences of protein, spacer, and his-tag. Dyes are labeled on cysteine residues (red). The N-terminus of protein GB1 is tethered to six histidine residues with a 10-residue spacer.
Materials and Methods
Single-molecule fluorescence measurements
Single-molecule FRET experiments were performed with a time-resolved fluorescence microscope using confocal optics (MicroTime 200; PicoQuant, Berlin-Adlershof, Germany). Samples were irradiated by a picosecond pulsed laser (λ = 470 nm, full width at half-maximum 90 ps; PicoQuant) at 20 MHz with an excitation power of 45 μW for the free diffusion experiment and 0.9 μW for the immobilization experiment. Details of the instrument are given elsewhere (19). For free diffusion experiments, photons were collected into 2-ms bins for 10–20 h. Only bins containing >30 photons were analyzed. Other experimental details can be found in the Supporting Material.
Results
FRET efficiency distribution for freely-diffusing molecules
Measurement of the FRET efficiency distribution for freely diffusing molecules is a very important control experiment for the immobilization experiment because the differences between the two measurements directly reflect the effect of the immobilization. Fig. 2 shows the FRET efficiency distributions from fluorescence bursts in a free diffusion experiment at various urea concentrations. There is only a single peak at all urea concentrations corresponding to the FRET efficiency of the unfolded subpopulation (the small peak near E = 0 corresponds to molecules with an absent or inactive acceptor). A peak at high FRET efficiency, corresponding to that of the folded subpopulation, is missing. The vast majority of bursts from folded molecules contain <30 photons because there is an interaction between the dyes that results in partial quenching (Fig. 3). Quenching from the interdye interaction was demonstrated by the finding that there is no quenching by either the donor or acceptor dye in the protein singly labeled at position 57, yet proteins doubly labeled with either donor-only or acceptor-only at positions 10 and 57 also show partial quenching (data not shown).
Figure 2.
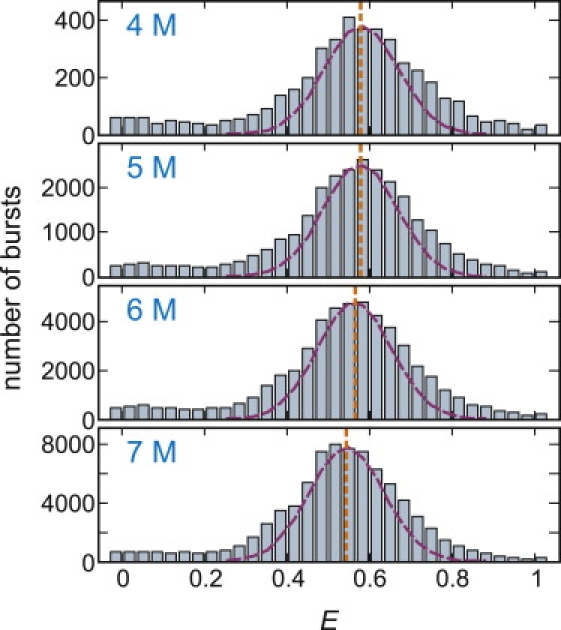
FRET efficiency distribution constructed from the fluorescence bursts containing >30 photons in free diffusion experiments. Due to fluorescence quenching in the folded state, bursts from the folded state are rarely observed. (Purple-dashed curves) Expected distributions arising from shot noise for nA + nD = 30 photons (). Shot noise only accounts for 50% of the variance of the distribution. (Orange lines) Center of the distribution from a single Gaussian fit.
Figure 3.
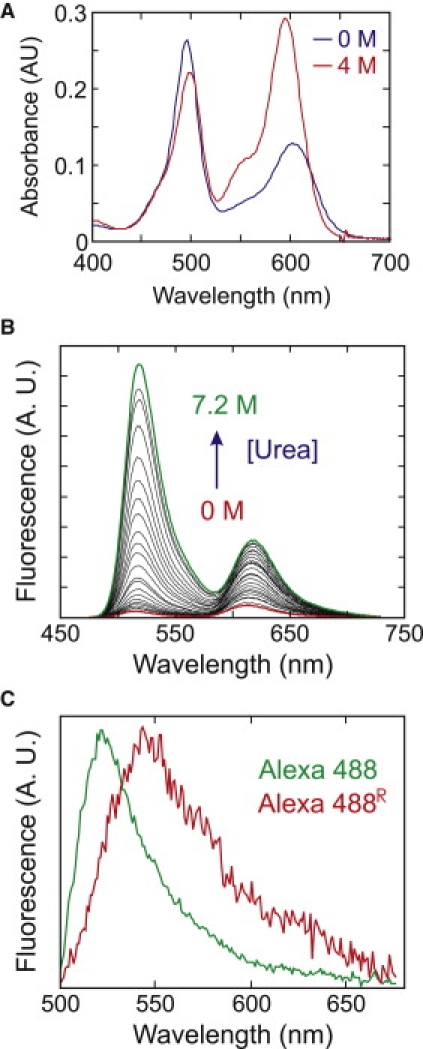
Ensemble absorption and fluorescence spectra of Alexa 488 and Alexa 594 labeled His-GB1K10C/C57. Interactions between donor and acceptor dyes result in (A) a significant decrease in acceptor absorbance and (B) fluorescence quenching (λEx = 470 nm) in the folded state (0 M GdHCl or urea; from (19)). (C) Two different donor fluorescence spectra in 5 M urea averaged over segments of trajectories of immobilized single molecules, distinguished by the fraction of donor photons detected in the acceptor channel with a 600-nm long-pass filter (from (19)).
For the unfolded state, the mean FRET efficiency (E = nA/[nA + nD] for each burst) decreases with increasing urea concentration due to an expansion of the unfolded polypeptide, and has been observed for several other proteins (3). The width of the distribution is wider than the upper limit of the width due to shot noise, given by
with a threshold level of nA + nD = 30 (6), which contributes only 50% of the variance, σ2.
FRET efficiency distribution for immobilized molecules
Because of partial quenching of the dyes in the folded molecules, the donor and acceptor emission trajectories shown in Fig. 4 do not show the expected anticorrelation. However, reversible folding and unfolding transitions between two states of E ∼0.9 and E ∼0.5 are clearly observable in the trajectories of the FRET efficiency. The high and low FRET efficiencies correspond to those of the folded and unfolded molecules, respectively. As previously seen in the streptavidin-biotin immobilization (19), transitions between the states appear to be instantaneous, occurring within one 20-ms time bin.
Figure 4.
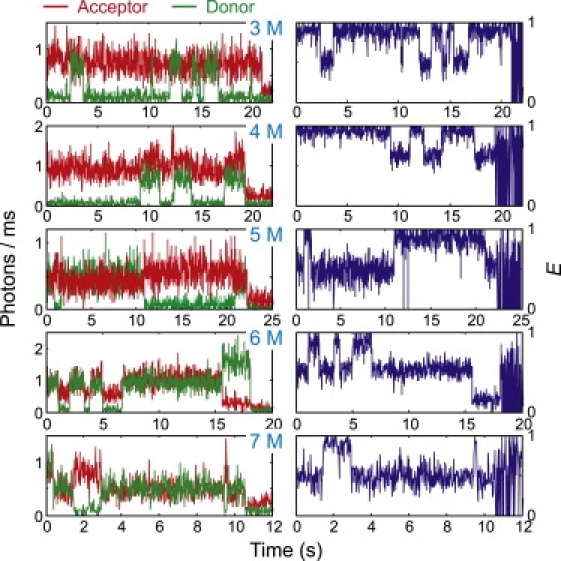
FRET trajectories collected into 10 ms (3 M urea) or 20 ms (4–7 M urea) bins. At 3, 4, 5, and 7 M urea the donor dye in these trajectories bleaches first, but at 6 M urea the acceptor dye bleaches first.
As the urea concentration is increased, the residence time in the unfolded state becomes longer, indicating the shift of the equilibrium toward the unfolded state. The equilibrium constant K can be obtained from the ratio of the folded and unfolded molecules in the FRET efficiency distribution in Fig. 5 A, which were constructed by calculating E from the first segment of the trajectory of each molecule. The midpoint of denaturation is ∼5 M.
Figure 5.
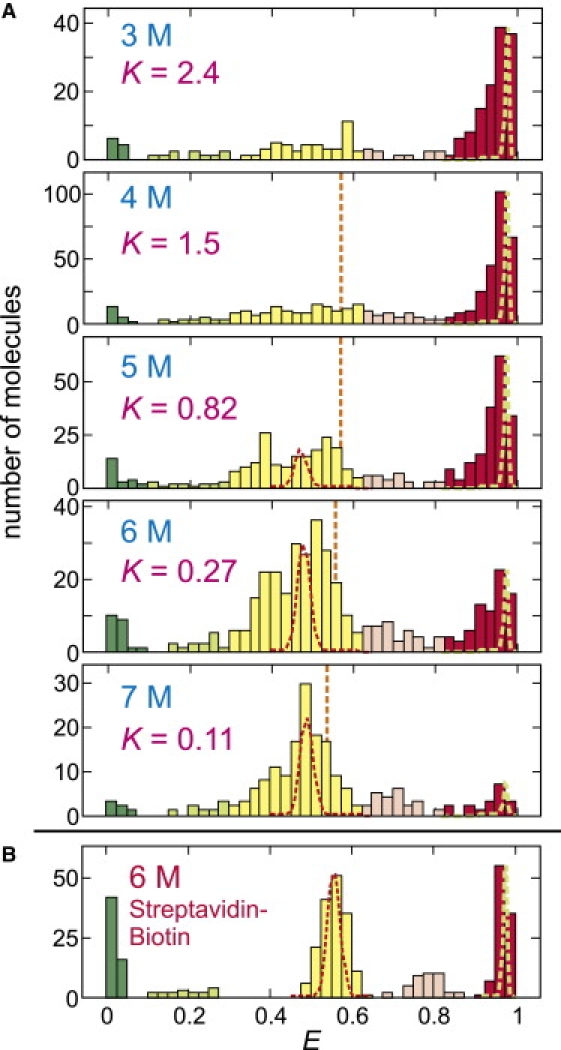
FRET efficiency histogram of immobilized proteins. (A) The distribution was obtained from the FRET efficiencies of the initial segments of the trajectories. The ranges of the states are E < 0.1 (green, donor only), 0.1 ≤ E < 0.3 (light green, donor only with Alexa 488R), 0.3 ≤ E < 0.625 (yellow, unfolded), 0.625 ≤ E < 0.825 (light red, unfolded with Alexa 488R), and E ≥ 0.825 (red, folded). These ranges are based on the results in panel B for the streptavidin-biotin immobilization, where the separate states from Alexa 488R are clearly resolved. The equilibrium constant was calculated from the ratio of the fractions belonging to the folded and unfolded states (K = fF/fU). (Red and green dashed lines) Distributions due solely to shot noise for >1000 photons for unfolded and folded peaks, respectively. (Orange vertical lines) Mean FRET efficiencies of the unfolded state in free diffusion experiment in Fig. 2. (B) The result for streptavidin-biotin immobilization is shown for comparison (from (19)).
The striking, and initially puzzling, observation is the complex distribution of FRET efficiencies and the large width of the individual peaks. There are at least four distinct peaks. Based on the free-diffusion histogram (Fig. 2), the peaks at E = 0 and ∼0.5 correspond to molecules without an active acceptor and unfolded molecules with active donor and acceptor dyes, respectively. The peak at E ∼0.95 corresponds to folded molecules, not apparent in the free diffusion experiments with a threshold of 30 photons because of partial quenching of both dyes. As previously demonstrated for molecules immobilized with a streptavidin-biotin linkage from measurements of donor and acceptor spectra (Fig. 5 B) (19), FRET efficiencies in the ranges 0.1 ≤ E < 0.3 and 0.625 ≤ E < 0.825 arise from molecules with a red-shifted emission spectrum of the donor, called Alexa 488R (Fig. 3 C). FRET efficiencies in the range 0.1 ≤ E < 0.3 correspond to molecules (both folded and unfolded) with a bleached acceptor and E > 0 because donor photons are being detected in the acceptor channel, whereas those in the range 0.625 ≤ E < 0.825 correspond to unfolded molecules with a higher FRET efficiency because of increase in the overlap integral, as well as leakage of donor photons into the acceptor channel.
The width of the unfolded peak at E ∼0.5 is roughly comparable to what is observed for freely diffusing molecules even though the FRET efficiency was calculated from segments containing >1000 photons, compared to the 30–40 photons in the free diffusion experiment. If all of the width in these distributions came from shot noise, the width for the immobilized molecules should be 5–6 times narrower than the width for the freely-diffusing molecules. The much narrower distributions in both the folded and unfolded states found for the same protein with the same dye pair at the same labeling sites was observed using a streptavidin-biotin linkage (Fig. 5 B) (19), indicating that there is an additional source of broadening caused by the his-tag-copper immobilization.
Fig. 6 A shows the histogram of FRET efficiency differences for different unfolded segments within the same trajectory. This ΔE histogram was constructed from two unfolded segments of at least 500 photons, each separated by a folded segment in the same trajectory. The width calculated from the shot noise for 500 photons (red dashed line) more closely corresponds to the observed width. On the other hand, the calculated ΔE distribution is much wider when two E values are arbitrarily selected from the Gaussian distribution of the unfolded state (blue dashed line in Fig. 6 A). In other words, the variation of the FRET efficiency is small and close to shot-noise-limited within the same trajectory but large for different trajectories, indicating that the origin of the broad FRET efficiency distribution of the unfolded state is the variation in the local environment for each molecule.
Figure 6.
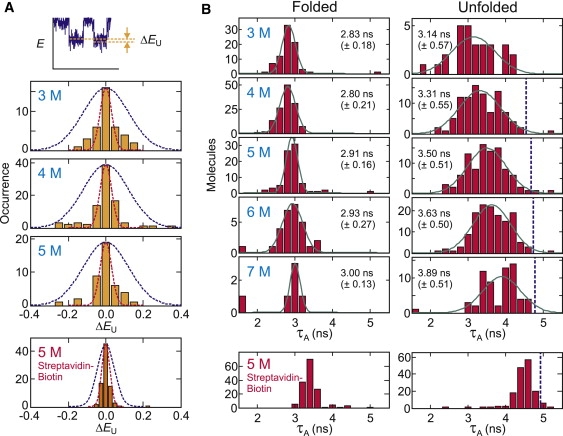
Unfolded FRET efficiency from single trajectories and photophysics of Alexa 594. (A) FRET efficiency difference between two unfolded trajectory segments, which contain >500 photons (1000 photons in the case of streptavidin-biotin linkage) and are separated by a folded segment in the same trajectory. (Blue-dashed line) Distribution calculated from the Gaussian width of the unfolded peak at 6 M urea in Fig. 5. (Red-dashed line) Distribution calculated from the shot noise width from 500 photons (1000 photons for streptavidin-biotin linkage). (B) Lifetime distribution of the acceptor in the folded and unfolded states. For trajectories showing multiple transitions, photons of all folded (unfolded) segments in the same trajectory were added up to obtain the calculated folded or unfolded lifetime. Trajectories containing >5000 photons (donor + acceptor) were considered. Means and standard deviations were obtained by fitting data to the Gaussian distribution. (Vertical dashed lines) Lifetime in the unfolded state obtained from the free diffusion experiment. Data from streptavidin-biotin immobilization are shown in the bottom row for comparison (from (19)).
A clue to understanding the origin of this broad distribution of FRET efficiencies for unfolded molecules came with the observation of a broad distribution of acceptor lifetimes. Fig. 6 B shows the distribution of the acceptor fluorescence lifetime (τA) in the folded and unfolded state. As expected from the lower photon-counting rate in the folded state resulting from the interaction between the dyes that dynamically quenches both, the mean acceptor lifetime is shorter in the folded state than in the unfolded state, as also found in the streptavidin-biotin immobilization (Fig. 6 B, bottom row) (19). However, there are significant differences both in the width and in the mean of the distribution for unfolded molecules. In the streptavidin-biotin immobilization, the width of the distribution is almost as narrow as that in the folded state and the mean value is close to the free diffusion value. In the his-tag immobilization, on the other hand, the lifetimes are much more broadly distributed and shorter than the free diffusion value by ∼1.5 ns, indicating much more quenching of the acceptor fluorescence.
This reduced mean acceptor lifetime can account for the lower mean FRET efficiencies of the unfolded peaks in the immobilization experiment compared with those in the free diffusion experiment (orange vertical dashed lines in Fig. 5). The apparent FRET efficiency, E, determined from counting donor and acceptor photons (E = nA /[nA + nD]) depends on the acceptor quantum yield, but not on the donor quantum yield (Eq. S4 of Supporting Material). If the radiative lifetime of the acceptor is constant, then the acceptor quantum yield is simply proportional to the acceptor lifetime, i.e.,
and variation in the acceptor lifetime from quenching processes will contribute to the width of the FRET efficiency distribution (Eq. S5). Fig. 7 A shows that there is in fact a correlation, albeit a weak one, between the acceptor lifetime and the FRET efficiency for unfolded molecules. This correlation coefficient of only 0.43 represents a minimal value because of two effects. First, the experimental uncertainty in the lifetime decreases the correlation coefficient. Second, the plot contains points that should not be included, but could not be excluded. When the acceptor bleaches first, FRET efficiencies obtained with the red-shifted donor spectrum of Alexa 488R could be readily identified and were removed because of the increased count rate in the acceptor channel. However, when the donor bleaches first this diagnostic method cannot be used. Consequently, trajectories with a red-shifted donor spectrum in which the donor bleaches first, could be responsible for points at high E and low τA that lower the correlation coefficient.
Figure 7.
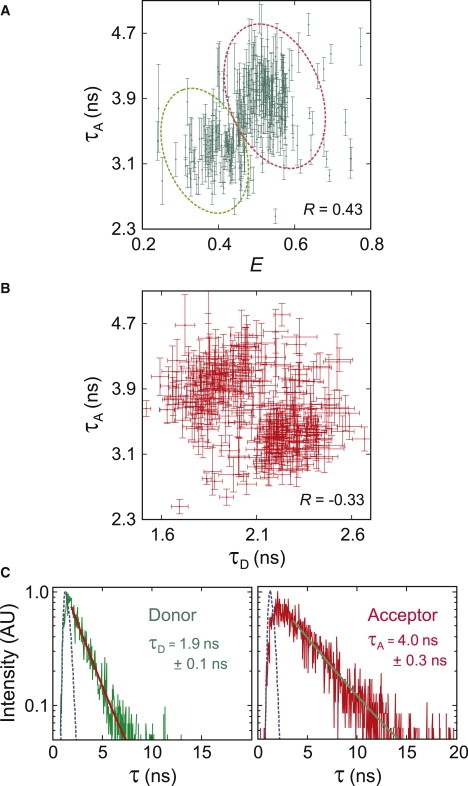
Correlations between the acceptor lifetime and the apparent FRET efficiency (R = 0.43) (A) or the donor lifetime (R = −0.33) (B). (Dotted curves in A) Outline of the clusters that were used in constructing the histogram in Fig. 8. (Error bars) Indicate ±1σ in the exponential fit shown in panel C. Representative distributions of time delays between excitation and detection. (Blue-dashed lines) Instrument responses of the avalanche photodiodes for the donor and acceptor channels. (Thick solid lines) Exponential fits (I = aexp[−τ /τD,A] + b).
Fig. 7 B shows that there is also a weak anticorrelation between the donor and acceptor lifetimes of individual trajectories. The data appears to be clustered into two regions, as is the data in the τA, E plot (Fig. 7 A). Two clusters in both distributions and the anticorrelation between the acceptor and donor lifetimes strongly suggest that the clusters correspond to the two dye isomers, one with the donor at position 10 and the acceptor at position 57, and another with the donor at position 57 and the acceptor at position 10. The dye in position 10 is much closer to the copper binding site (Fig. 1), and is therefore much more likely to be quenched in unfolded molecules. As pointed out earlier, the cupric ion is a well-known dye fluorescence quencher (16–18), and we have observed that the lifetime of the acceptor and the FRET efficiency are decreased in the presence of CuSO4 in free diffusion experiments (see Fig. S1).
Fig. 8 shows the FRET efficiency distributions of the individual clusters of Fig. 7 A, assumed to correspond to the two isomers. The low E cluster on the left in Fig. 7 A would correspond to the isomer donor57/acceptor10 and the high E cluster on the right to the isomer donor10/acceptor57. Segments with E > 0.7 were not included, because they most probably contain Alexa 488R (Fig. 3 C) which increases the R0 and the leakage of donor photons into the acceptor channel. There is still excess width to the individual cluster distributions, indicating that there are additional sources of broadening. There can of course be other contributions to the width, including lack of reorientational averaging of the transition dipoles due to dye sticking, and, as mentioned earlier, very slow interconversion of unfolded conformations. Each of these issues is addressed in the following experiments.
Figure 8.
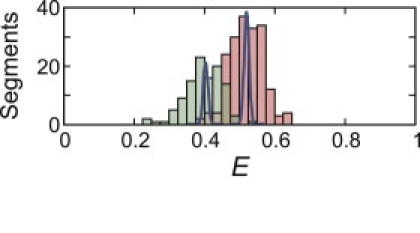
FRET efficiency distributions of the two clusters of unfolded segments in Fig. 7A. The continuous curves are the shot-noise–limited widths calculated for 5000 photons, the minimum number of photons in the sum of the segments for each trajectory.
Steady-state polarization measurements
In FRET measurements, free rotation of dyes is important because incomplete orientational averaging and abrupt changes in dye orientation, caused, for example, by sticking or unsticking of either dye to the protein, linker, or surface, can broaden the FRET efficiency distribution. They can also produce jumps between different FRET efficiency levels, which are indistinguishable from those caused by changes in interdye distances and can possibly be misinterpreted as slow conformational changes between unfolded states.
The anisotropy (r) of each segment was calculated after calibrating the microscope objective as in (20,21)
| (1) |
Here, n‖ and n⊥ are the number of photons detected in parallel and perpendicular polarization channels for a given segment, k1 (= 0.19) and k2 (= 0.13) are objective calibration parameters, and G (= 0.86 (donor), 0.96 (acceptor)) is the correction factor for the detection efficiency of the two polarization channels. The anisotropy of a freely rotating donor dye is given by
| (2) |
where θ is the angle between absorption and emission dipoles, assumed to be zero, τD is the donor lifetime, and τc is the reorientational correlation time. Using τc of 0.74 ns measured by Nettels et al. (21) from time-resolved anisotropy decay of Alexa 488 attached to unfolded CspTm with the same linker, and the average τD of 2.1 ns (Fig. 7), the average r is predicted to be 0.10, close to the observed value of 0.06. However, the width of the distribution is much broader than the width expected from the lifetime distributions in Figs. 6 and 7. Because the anisotropy cannot be negative and the distribution in r resulting from the distribution in τD should be asymmetric, the symmetric distribution in Fig. 9 implies that the variations of the anisotropy result from other sources. The errors of individual anisotropy values can be calculated from the errors of the photon counts of each of polarization channels as σ/N1/2, where σ is the standard deviation of the photon count for the bins in a given segment and N is the number of bins. This error (red numbers in Fig. 9) is very close to the width (standard deviation) of the distribution obtained from Gaussian fits (black numbers), which indicates that the distribution of the anisotropy results mostly from the errors in photon measurement, and not from interaction of the dye with the linkers or surface.
Figure 9.
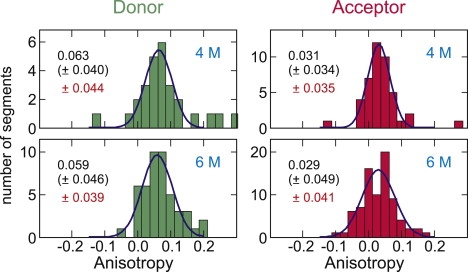
Anisotropy measurements for donor- and acceptor-labels on His-GB1K10C/C57 at 4 M and 6 M urea. Errors (standard deviation) from Gaussian fits for the distribution (black) are compared with the errors calculated from the trajectories (red).
Slow (10 μs–1 s) interconversion of unfolded conformations
The dynamics of the unfolded protein can be evaluated from the calculation of the donor-acceptor cross-correlation function from the average of unfolded trajectory segments, i.e.,
| (3) |
and comparing the measured amplitude extrapolated to zero time with the theoretically predicted amplitude for the cross-correlation function in the accessible time window for a Gaussian chain having a mean-squared interdye distance consistent with the measured FRET efficiency (see Eq. S6, Eq. S7, Eq. S8, and Eq. S9 in the Supporting Material). The cross-correlation function is flat (Fig. 10), indicating no dynamics in the time range 5 μs–1 s as also found by Nettels et al. for CspTm (21).
Figure 10.
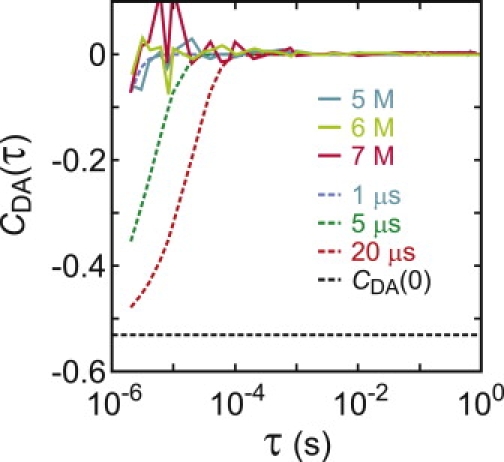
Donor and acceptor intensity cross-correlation function averaged over all unfolded segments longer than 5 s (continuous curves) at 5, 6, and 7 M urea. (Dashed curves) Simulated correlation decay with decay times of 1, 5, and 20 μs with the amplitude at τ = 0 (CDA(0) = −0.53) calculated for the FRET efficiency distribution for a Gaussian chain (see Eq. S6, Eq. S7, Eq. S8, and Eq. S9).
Very slow (>1 s) interconversion of unfolded conformations
Fig. 11 shows the kinetics of folding and unfolding. The mean waiting time in the unfolded state, and therefore the mean folding time, is 1–2 s under the conditions of our experiment. Because the length of the single molecule trajectories is finite due to the bleaching of dyes, the apparent rates are higher than the true values and thus, the single molecule rates were corrected by simulations of folding/unfolding trajectories with bleaching of dyes as described in Chung et al. (19). The average bleaching time varies from 13 s (3 M urea) to 6 s (7 M urea), so there is a 20–30% overestimation of rates that are <1 s−1. This correction brings the single-molecule rate coefficient at 5 M urea closer to the ensemble value. At low urea concentrations (3 and 4 M), however, the rate coefficients from the immobilizations are slightly smaller than the ensemble values. This slower folding/unfolding can be attributed to missing fast folding events due to the long bin time. With a bin time of 10–20 ms, many folding segments <100 ms will be missed unless the intensity level is high.
Figure 11.
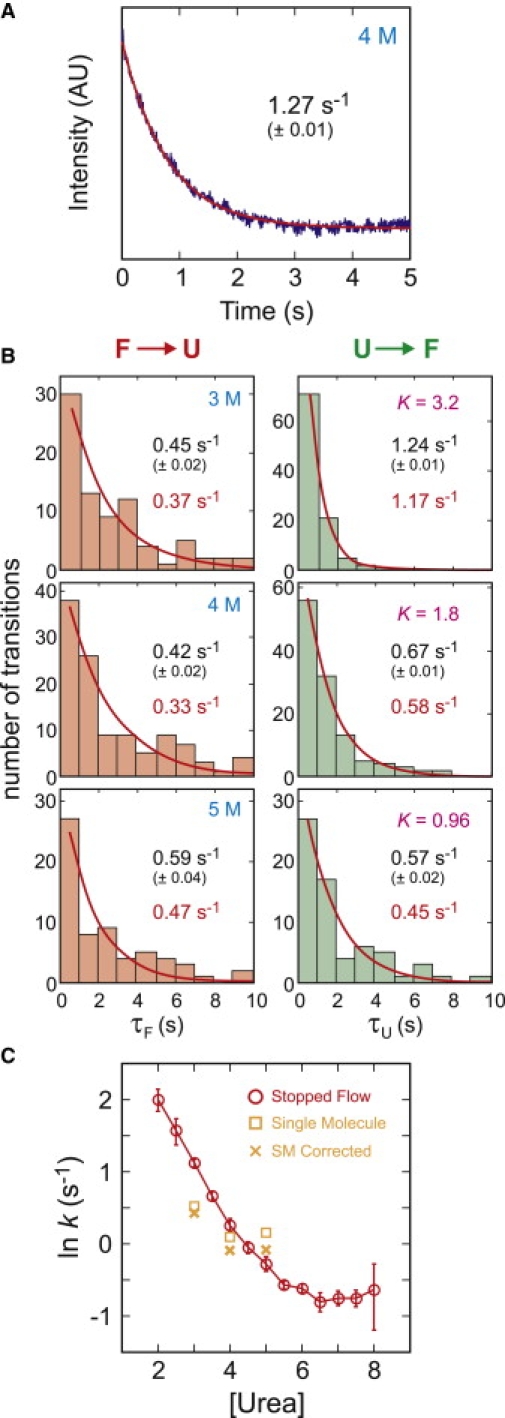
Folding and unfolding kinetics. (A) Time course of unfolding/refolding after rapid change in denaturant concentration in an ensemble stopped-flow mixing experiment. The continuous curve is an exponential fit to the data. (B) Waiting-time distributions in single-molecule experiments. Folding and unfolding rate coefficients were obtained from the exponential fits of waiting-time distributions. Errors were calculated from the fit with 60% confidence level (1σ). (Red) Rates corrected for the finite length of trajectories. (C) Comparison of the single-molecule kinetics with ensemble kinetics from stopped-flow measurements with dye-labeled proteins.
For the kinetics of folding to have an exponential time course, the interconversion of the conformations of the unfolded state must be fast relative to 1–2 s. For freely diffusing molecules, the kinetics measured in a stopped flow experiment are perfectly exponential (Fig. 11 A), so dynamics on a timescale >1 s does not contribute to the width of the FRET efficiency distribution for freely diffusing molecules (Fig. 2). Immobilization, however, could lead to sticking of the unfolded protein to the surface for times longer than the length of the trajectory, ∼10 s. This possibility seems unlikely, not only because the waiting time distribution for the single molecules is exponentially distributed (Fig. 11 B), but because the calculated relaxation rates from the sum of the single molecule rate coefficients (the inverse of the mean waiting times) agree very well with the relaxation rates measured in an ensemble stopped-flow experiment (Fig. 11 C).
Discussion
The two major experimental findings reported here are that the FRET efficiency distribution for protein GB1 immobilized to a glass surface are quite complex (Fig. 5), and that the widths of the components of this distribution are much larger than what is expected from shot noise. A superficial analysis of the data would suggest that the protein has a complex distribution of conformations that interconvert on a timescale comparable to, or slower than, the 20-ms bins from which the FRET efficiency was calculated. However, by making a variety of measurements, we find that the complexity does not reflect either structure distributions or slow dynamics of the protein, but is caused by dye photophysics and photochemistry.
The 57-residue protein GB1 was labeled at positions 10 and 57, but, as in almost all previous single molecule FRET studies on proteins, the isomers (here donor10/acceptor57 and acceptor10/donor57) could not be separated in the purification. So there are two general sources of excess broadening—dynamics of the unfolded molecules on a timescale comparable to or longer than the time bins from which the FRET efficiency is calculated, and differences in the Förster radius for the two isomers. Processes that occur on a timescale much shorter than the interphoton interval, such as triplet state formation of the acceptor, alter the mean FRET efficiency, but not the width because the photons are being detected from an equilibrium distribution (7,8).
The Förster radius (R0) depends on the emission (fD(λ)) and absorption spectra (ɛA(λ)) of the donor and acceptor, respectively (the spectral-overlap integral), as well as the orientation of donor and acceptor transition dipoles
the quantum yield (ϕD) of the donor in the absence of the acceptor, and the refractive index (n) of the medium between the two fluorophores (22),
| (4) |
The apparent FRET efficiency, E, determined by counting photons in the donor and acceptor channels without any corrections for differences in quantum yield between the donor (ϕD) and acceptor (ϕA), also depends on the quantum yield of the acceptor, but not on the donor quantum yield, ϕD (see Eq. S4). If the radiative lifetime of the acceptor () is unaffected, then any difference in ϕA for positions 10 and 57 will appear as differences in the measured acceptor lifetime, τA, because .
The important clues to a possible explanation of the large excess width of the FRET efficiency peaks in Fig. 5 for the immobilized molecule are found in Figs. 6 and 7. Fig. 6 A shows that E for unfolded segments from the same trajectory show a small and almost shot-noise–limited variation, in sharp contrast to the much larger molecule-to-molecule variation in E. Fig. 6 B shows that τA of the unfolded molecules is not only much shorter than the free-diffusion value, but it is also broadly distributed. Moreover, there is a positive correlation between E and τA, as predicted by Eq. S5. The correlation coefficient is only 0.43, but as described in Results, this represents a minimum correlation coefficient (Fig. 7 A). We also noted that both the donor and acceptor lifetimes show two clusters, and that molecules with the longer τA have the shorter τD and vice versa (Fig. 7 B). From these results we have concluded that a major contribution to the large excess width for the immobilized protein arises from differences in the quantum yield of the acceptor of the two isomers. The most likely origin of this difference is that the acceptor dye in position 10 is much closer to the copper ion bound to the his-tag than the dye in position 10, and therefore has a higher probability of being partially quenched than the acceptor dye in position 57. Differential quenching of acceptor fluorescence by amino acids, such as tyrosine or tryptophan (see sequence in Fig. 1) (14,15), in the two isomers might also account for the excess width in free diffusion experiments (Fig. 2).
To test the plausibility of the quenching of the acceptor dye by copper, it is instructive to make a rough theoretical estimate of the parameters required to produce the observed decrease in the acceptor lifetime of the immobilized molecules compared to the lifetime measured in the free diffusion experiments (Fig. 7). The lifetime of the acceptor dye in free diffusion experiments is 4.7 ns, and is reduced to an average value of 3.3 ns by quenching of the acceptor dye in the isomer: acceptor10/donor57. This decrease requires an average quenching rate 〈q〉 of 1/(11 ns) (1/(3.3 ns) = 1/〈τA〉 (immobilized) = 1/〈τA〉 (freely-diffusing) + 〈q〉). Assuming a Gaussian dye-copper distance distribution, the average quenching rate is given by
| (5) |
where q0 is the quenching rate, assumed to occur via an electron transfer process, at the distance of closest approach (a) of the dye to the cupric ion, and P(r) is the distance distribution for a Gaussian chain of contour length L, given by Eq. S8. For L = 7.9 nm (22 residues × 0.36 nm/residue), 〈r2〉 = 7 nm2 from the work of Buscaglia et al. (23) on disordered peptides a = 0.4 nm, 〈q〉 = 1/(11 ns) could result from q0 = 26 ns−1, and β = 14 nm−1—parameters which are consistent with those found in electron transfer studies (24). These same parameters, however, predict an acceptor lifetime in the isomer donor10/acceptor57 of 4.5 ns compared to the observed average of 4.1 ns, suggesting that there may also be quenching from nearby cupric ions embedded in the surface, but not bound to the his-tag (the surface density of the copper ions is not known to an accuracy sufficient to make a quantitative estimate of their contribution to the quenching rate).
Differential quenching of the acceptor in the two isomers explains a large fraction of the width in the FRET efficiency distributions in Fig. 5, but there is still considerable excess width in the FRET efficiency histograms for the individual isomers (Fig. 8). To investigate possible contributions from protein dynamics to the remaining excess width, we analyzed photon trajectories. We measured steady-state polarizations and compared the folding/unfolding kinetics with the results of ensemble experiments on freely diffusing molecules.
One possibility is that the dye is not freely rotating, but reorients on a timescale comparable to or longer than the interphoton interval of 500 μs–1 ms (Fig. 4) (if it reorients on a timescale that is longer than the dye lifetime but shorter than the interphoton interval, then the mean FRET efficiency will be altered, although there will be no additional width to the E distribution (7,8)). Restricted rotation arising, for example, from the dye sticking to the linker or the surface, would appear as an increase in the steady-state polarization. Fig. 9 shows that the both the average anisotropy and the width of the anisotropy distribution is very close to what is expected from the dye lifetime and reorientational correlation time, and the uncertainty due to photon statistics, respectively.
Another possible contribution to the width is the dynamics of the polypeptide chain (for example, sticking and unsticking to the immobilization surface or linker on a timescale comparable to or slower than the average interphoton interval). This possibility was readily eliminated by calculating the donor-acceptor cross-correlation function for unfolded segments (Fig. 10). These results show that there are no dynamics at times longer than ∼5 μs (i.e., much shorter than the interphoton interval)—a result consistent with a variety of experimental results on freely diffusing unfolded proteins and unstructured peptides. This indicates that the reconfiguration time of a polypeptide is ∼100 ns (21,23,25–27). The possibility of polypeptide dynamics from some interaction with the surface or linkers that is even slower than the maximum time of ∼1 s evaluated in the correlation function of Fig. 10, was eliminated by a comparison of the single molecule kinetics with the ensemble kinetics of freely-diffusing molecules. The relaxation rates calculated from the sums of the individual single molecule rate coefficients are very close to those observed in ensemble kinetic experiments for the dye-labeled protein with the his-tag (Fig. 11, A and C). Moreover, unfolded state dynamics on a timescale comparable to or slower than the mean waiting times would result in nonexponential kinetics, while the measured waiting times are exponentially distributed (Fig. 11 B).
The one source of excess width (see Fig. 8) that remains to be investigated would be the molecule-to-molecule variations in R0. These result from differences in the emission spectra of the donor other than from the formation of Alexa 488R (Fig. 3 C) and in the absorption spectra of the acceptor (Eq. 4), and which might result from the proximity of the dyes to a surface of different refractive index—the so-called electromagnetic boundary conditions effect (28–30). Such variations would affect the apparent FRET efficiency distribution through variations in radiative lifetimes (and therefore quantum yields), as well as the overlap integral (Eq. 4). These are challenging experiments, and may have to await a number of methodological improvements.
Supporting Material
Nine equations and one figure are available at http://www.biophysj.org/biophysj/supplemental/S0006-3495(10)00093-7.
Supporting Material
Acknowledgments
We thank Attila Szabo, Irina Gopich, and Kevin McHale for helpful discussions, and Annie Aniana for technical assistance.
This work was supported by the Intramural Research Program of the National Institute of Diabetes and Digestive and Kidney Diseases, National Institutes of Health.
Contributor Information
Hoi Sung Chung, Email: chunghoi@niddk.nih.gov.
William A. Eaton, Email: eaton@helix.nih.gov.
References
- 1.Ha T., Enderle T., Weiss S. Probing the interaction between two single molecules: fluorescence resonance energy transfer between a single donor and a single acceptor. Proc. Natl. Acad. Sci. USA. 1996;93:6264–6268. doi: 10.1073/pnas.93.13.6264. [DOI] [PMC free article] [PubMed] [Google Scholar]
- 2.Ha T. Single-molecule fluorescence resonance energy transfer. Methods. 2001;25:78–86. doi: 10.1006/meth.2001.1217. [DOI] [PubMed] [Google Scholar]
- 3.Schuler B., Eaton W.A. Protein folding studied by single-molecule FRET. Curr. Opin. Struct. Biol. 2008;18:16–26. doi: 10.1016/j.sbi.2007.12.003. [DOI] [PMC free article] [PubMed] [Google Scholar]
- 4.Best R.B., Merchant K.A., Eaton W.A. Effect of flexibility and cis residues in single-molecule FRET studies of polyproline. Proc. Natl. Acad. Sci. USA. 2007;104:18964–18969. doi: 10.1073/pnas.0709567104. [DOI] [PMC free article] [PubMed] [Google Scholar]
- 5.Merchant K.A., Best R.B., Eaton W.A. Characterizing the unfolded states of proteins using single-molecule FRET spectroscopy and molecular simulations. Proc. Natl. Acad. Sci. USA. 2007;104:1528–1533. doi: 10.1073/pnas.0607097104. [DOI] [PMC free article] [PubMed] [Google Scholar]
- 6.Gopich I., Szabo A. Theory of photon statistics in single-molecule Förster resonance energy transfer. J. Chem. Phys. 2005;122:014707. doi: 10.1063/1.1812746. [DOI] [PubMed] [Google Scholar]
- 7.Gopich I.V., Szabo A. Single-molecule FRET with diffusion and conformational dynamics. J. Phys. Chem. B. 2007;111:12925–12932. doi: 10.1021/jp075255e. [DOI] [PubMed] [Google Scholar]
- 8.Gopich I., Szabo A. Theory of single-molecule fluorescence resonance energy transfer histograms. Adv. Chem. Phys. 2009 In press. [Google Scholar]
- 9.Nir E., Michalet X., Weiss S. Shot-noise limited single-molecule FRET histograms: comparison between theory and experiments. J. Phys. Chem. B. 2006;110:22103–22124. doi: 10.1021/jp063483n. [DOI] [PMC free article] [PubMed] [Google Scholar]
- 10.Deniz A.A., Laurence T.A., Weiss S. Single-molecule protein folding: diffusion fluorescence resonance energy transfer studies of the denaturation of chymotrypsin inhibitor 2. Proc. Natl. Acad. Sci. USA. 2000;97:5179–5184. doi: 10.1073/pnas.090104997. [DOI] [PMC free article] [PubMed] [Google Scholar]
- 11.Talaga D.S., Lau W.L., Hochstrasser R.M. Dynamics and folding of single two-stranded coiled-coil peptides studied by fluorescent energy transfer confocal microscopy. Proc. Natl. Acad. Sci. USA. 2000;97:13021–13026. doi: 10.1073/pnas.97.24.13021. [DOI] [PMC free article] [PubMed] [Google Scholar]
- 12.Schuler B., Lipman E.A., Eaton W.A. Probing the free-energy surface for protein folding with single-molecule fluorescence spectroscopy. Nature. 2002;419:743–747. doi: 10.1038/nature01060. [DOI] [PubMed] [Google Scholar]
- 13.Kuzmenkina E.V., Heyes C.D., Nienhaus G.U. Single-molecule Forster resonance energy transfer study of protein dynamics under denaturing conditions. Proc. Natl. Acad. Sci. USA. 2005;102:15471–15476. doi: 10.1073/pnas.0507728102. [DOI] [PMC free article] [PubMed] [Google Scholar]
- 14.Doose S., Neuweiler H., Sauer M. Fluorescence quenching by photoinduced electron transfer: a reporter for conformational dynamics of macromolecules. ChemPhysChem. 2009;10:1389–1398. doi: 10.1002/cphc.200900238. [DOI] [PubMed] [Google Scholar]
- 15.Chen H.M., Rhoades E., Webb W.W. Dynamics of equilibrium structural fluctuations of apomyoglobin measured by fluorescence correlation spectroscopy. Proc. Natl. Acad. Sci. USA. 2007;104:10459–10464. doi: 10.1073/pnas.0704073104. [DOI] [PMC free article] [PubMed] [Google Scholar]
- 16.Brunner J., Kraemer R. CopperII-quenched oligonucleotide probes for fluorescent DNA sensing. J. Am. Chem. Soc. 2004;126:13626–13627. doi: 10.1021/ja047252a. [DOI] [PubMed] [Google Scholar]
- 17.Meallet-Renault R., Pansu R., Larpent C. Metal-chelating nanoparticles as selective fluorescent sensor for Cu2+ Chem. Commun. (Camb.) 2004;20:2344–2345. doi: 10.1039/b407766k. [DOI] [PubMed] [Google Scholar]
- 18.Lee Y.E.K., Smith R., Kopelman R. Nanoparticle PEBBLE sensors in live cells and in vivo. Ann. Rev. Anal. Chem. 2009;2:57–76. doi: 10.1146/annurev.anchem.1.031207.112823. [DOI] [PMC free article] [PubMed] [Google Scholar]
- 19.Chung H.S., Louis J.M., Eaton W.A. Experimental determination of upper bound for transition path times in protein folding from single-molecule photon-by-photon trajectories. Proc. Natl. Acad. Sci. USA. 2009;106:11837–11844. doi: 10.1073/pnas.0901178106. [DOI] [PMC free article] [PubMed] [Google Scholar]
- 20.Schaffer J., Volkmer A., Seidel C.A.M. Identification of single molecules in aqueous solution by time-resolved fluorescence anisotropy. J. Phys. Chem. A. 1999;103:331–336. [Google Scholar]
- 21.Nettels D., Hoffmann A., Schuler B. Unfolded protein and peptide dynamics investigated with single-molecule FRET and correlation spectroscopy from picoseconds to seconds. J. Phys. Chem. B. 2008;112:6137–6146. doi: 10.1021/jp076971j. [DOI] [PubMed] [Google Scholar]
- 22.Van Der Meer B.W., Coker G., Chen S.Y.S. VCH Publishers; New York, Weinheim, Cambridge: 1994. Resonance Energy Transfer: Theory and Data. [Google Scholar]
- 23.Buscaglia M., Lapidus L.J., Hofrichter J. Effects of denaturants on the dynamics of loop formation in polypeptides. Biophys. J. 2006;91:276–288. doi: 10.1529/biophysj.105.071167. [DOI] [PMC free article] [PubMed] [Google Scholar]
- 24.Moser C.C., Keske J.M., Dutton P.L. Nature of biological electron transfer. Nature. 1992;355:796–802. doi: 10.1038/355796a0. [DOI] [PubMed] [Google Scholar]
- 25.Lapidus L.J., Steinbach P.J., Hofrichter J. Effects of chain stiffness on the dynamics of loop formation in polypeptides. J. Phys. Chem. B. 2002;106:11628–11640. [Google Scholar]
- 26.Möglich A., Joder K., Kiefhaber T. End-to-end distance distributions and intrachain diffusion constants in unfolded polypeptide chains indicate intramolecular hydrogen bond formation. Proc. Natl. Acad. Sci. USA. 2006;103:12394–12399. doi: 10.1073/pnas.0604748103. [DOI] [PMC free article] [PubMed] [Google Scholar]
- 27.Nettels D., Gopich I.V., Schuler B. Ultrafast dynamics of protein collapse from single-molecule photon statistics. Proc. Natl. Acad. Sci. USA. 2007;104:2655–2660. doi: 10.1073/pnas.0611093104. [DOI] [PMC free article] [PubMed] [Google Scholar]
- 28.Kunz R.E., Lukosz W. Changes in fluorescence lifetimes induced by variable optical environments. Phys. Rev. B. 1980;21:4814–4828. [Google Scholar]
- 29.Macklin J.J., Trautman J.K., Brus L.E. Imaging and time-resolved spectroscopy of single molecules at an interface. Science. 1996;272:255–258. [Google Scholar]
- 30.Lee M., Kim J., Hochstrasser R.M. Fluorescence quenching and lifetime distributions of single molecules on glass surfaces. Chem. Phys. Lett. 2002;359:412–419. [Google Scholar]
Associated Data
This section collects any data citations, data availability statements, or supplementary materials included in this article.