Abstract
The success of polyethyleneimine (PEI) as a non-viral based gene delivery vector has been attributed to its proton buffering capacity. Despite the great interest in PEI for its use in non-viral based gene delivery, the protonation behavior of PEI in solution is not well understood. Earlier experimental studies have reported inconsistent values of the protonation state of PEI. In this work, we report our investigation of the protonation behavior of a realistic linear PEI (lPEI) with computational approaches. Reported experimental pKa values of several diamine compounds are first examined. A screened coulombic interaction with a distance dependence dielectric is shown to reproduce the shifted pKa values of the model diamine compounds. Then atomistic molecular dynamics simulations of lPEI chain with 20 repeating units are performed and the results are used to provide parameters for a coarse-grained polyamine model. The screened coulombic interaction is then incorporated in the coarse-grained lPEI chain and computational titrations are performed. The obtained computational titration curves of lPEI in solutions were found to be in best agreement with experimental results by Smits et al, but the computational titration curves have too strong of a dependence on salt concentration compared to the experimental results by Smits et al. Disregarding the discrepancy in the salt dependence, our computational titrations reveal that approximately 55% of the lPEI amine groups are protonated under physiological conditions in solution with a nearly alternating arrangement of protonated and non-protonated amines. Titrations of lPEI in the presence of a polyanion are also performed to determine how the charge state of lPEI could be affected by complexation with DNA in gene therapy preparations. While the presence of the polyanion increases the degree of protonation of the PEI, many of PEI amines remain unprotonated under physiological conditions, providing evidence that PEI complexed with DNA could still have proton buffering capacity. Potential sources of error that have resulted in the inconsistency of previously reported protonation states of PEI were also discussed.
Keywords: linear polyethyleneimine, protonation behavior, Monte Carlo titration, gene delivery
1. Introduction
A little over a decade ago, the cationic polymer, polyethyleneimine (PEI: -(NH2-CH2-CH2)n-), was first reported to have high transfection efficiencies as a gene delivery vector both in vitro and in vivo,1 and, in the years since, has been used extensively in the design of a variety of more sophisticated delivery vectors.2, 3 In contrast with other polyamines, such as poly-L-lysine, PEI has shown the ability to provide DNA with greater protection from enzyme degradation4 and also has higher transfection efficiencies.1, 5 The effectiveness of PEI as a gene delivery vector is considered to be due in large part to a balance between two factors related to its charge density. Since the positively charged groups of PEI are directly along the chain backbone, PEI has a high charge density, enabling strong interactions with negatively charged DNA. However, PEI is also believed to not be fully protonated under physiological conditions, allowing for the possibility that the protonation state of PEI increases in cells. After PEI-DNA complexes enter cells through endocytosis, the endosomal compartments become increasingly acidic, and PEI may act as a “proton sponge”, adsorbing some of the entering protons.1, 5, 6 The proton sponge effect is thought to play a key role in the release of the polyplexes from endosomes resulting in high transfection efficiencies. The change in PEI protonation state in endosomes may also impact the polyplex structure, potentially destabilizing the polyplex and releasing the DNA.
Despite the importance of the presumed proton sponge effect of PEI, the actual protonation state of PEI, both free in solution and bound with DNA, is not very well known. Inconsistent values of the protonation state of PEI are reported in the literature. Many studies of gene delivery with PEI use the value of PEI protonation provided by titrations of branched PEI performed by Suh et al. in 1994,7 who found that only 10–20% of PEI amine groups are protonated at physiological pH (~7.4). Nagaya et al.8 reported that approximately 30% of branched PEI amines are protonated at pH 7.4, while others9, 10 have reported chain length dependent pKa’s for a series of PEI samples in the range of 8.2 to 9.5, indicating that most PEI amine would be protonated at physiological pH. One recent review article11 on non-viral based gene delivery cited that linear PEI has 90% amines protonated at pH~7. Koper and coworkers12–19 have determined the degree of protonation for linear, star-like, and comb-like PEI using both experimental titrations and Ising-model based computational methods. In a review of their findings, they reported that all forms of PEI have approximately 50% of the amine groups protonated at pH = 7.4 and that inclusion of doublet and triplet interactions, arising from the protonation of nearest neighbor amine groups, are essential in replicating experimental titration curves. Finally, the pKa’s of polyamines with 2–6 protonatable sites has been reviewed, showing that polyamines with structures similar to PEI typically have at least 50% of the amine groups protonated at physiological pH.20 The uncertainty in the actual PEI protonation state also causes difficulty in estimating the overall charge of PEI-DNA complexes, which is an important factor to consider in the gene delivery process. There also have been conflicting reports on how changes in PEI concentration affected the zeta potential of the resulting DNA-polycation complexes, with one report showing that the zeta potential of PEI-DNA complexes increased with concentration of PEI,21 while a second report found that zeta potential decreased.22 These inconsistent experimental results remain to be resolved.
The actual protonation state of a polyelectrolyte chain such as PEI, theoretically speaking, can be understood and predicted reasonably well with the help of computational methods. While small molecules are typically sufficiently separated in solution so that the titration of the individual molecules occurs independently, titrations of different sites on a polyelectrolyte are correlated. If titratable sites on a polyelectrolyte are close together, the protonation state of a site will electrostatically affect the protonation of nearby sites. Additionally, as a chain becomes increasingly charged, the cumulative build-up of multiple charge-charge interactions could lead to significant deviation in the protonation behavior from that of an independent single site. This deviation can be either interpreted as having a shifted pKa value if protonation of individual site can still be monitored, or the deviation may simply show up as an unusual titration curve. Accounting for such multiple charge-charge interactions by an analytically tractable theory is a difficult task, but is not difficult if one makes use of a computational approach. Changes in the pKa’s of titratable groups in proteins caused by surrounding charges have been studied with great interest for many years.23–27 Typically, in the case of proteins, simulations are simplified by assuming that the protein is a rigid, unmoving object, so that changes in the protonation of different sites do not result in changes in macromolecular structure. For more flexible synthetic polymers, this simplification is not appropriate, and conformation changes resulting from electrostatic repulsion along the chain must be considered. In fact, the latter (i.e, the change of polyelectrolyte conformation) often becomes the focus of discussion instead of protonation states. Protein simulations however have another challenge. The titratable residues are often separated or buried inside globular proteins which have a much lower dielectric constant than water. The charge/charge interaction is a sensitive function of the surrounding dielectric medium. Therefore, much effort in protein simulations has been devoted to obtaining accurate calculation of charge/charge interactions in a complex dielectric medium defined by the protein/water surface boundary. For polyelectrolytes, this is of less concern since polyelectrolytes are unlikely to form a globule core with a low dielectric constant.
The protonation behavior of flexible polyelectrolytes has been studied earlier using a variety of computational methods. Reed and Reed28 used a rotational isomeric state model for a polyelectrolyte chain and studied how the degree of protonation of a polyelectrolyte as a function of pH was affected by the distance and angle between titratable sites. Ullner et al.29 simulated the titration of a freely jointed polyelectrolyte chain and compared the protonation of chains using a screened Coulomb potential with a model that included explicit counterions and salt.30 The equilibrium charge distribution31, 32 and radius of gyration33–35 of polyelectrolytes as a function of their charge state has been determined under various solvent conditions. The interaction of polyelectrolytes with oppositely charge nano-36, 37 and colloidal38 particles has also been studied, and it has been shown that the presence of the oppositely charged object increases the fraction of charged polyelectrolyte monomers at a given pH.
We are interested in determining the protonation states of a realistic PEI chain at various conditions, for the purpose of understanding the proton sponge effect in gene delivery. We first examine experimentally reported pKa values in diamines and show that the shift in pKa observed for diamines can be reasonably modeled with a screened coulombic interaction and a distance dependent dielectric constant. We then extract a coarse grained model for a PEI chain based on results from atomistic simulations of 20-mer PEI chains in explicit water and counter ions. This coarse-grained model of PEI chain is then used in Monte Carlo simulations where conformational relaxation and variation in protonation states are both considered. The protonation behavior of linear PEI, both free in solution and in the presence of DNA, at different ionic conditions are then studied and are compared against the reported literature values. Our computational results support the results by Smits et al12 and we also discuss potential sources of errors in the inconsistent reported PEI states.
2. Methods
2.1 Atomistic molecular dynamics simulations of PEI
In order to parameterize our coarse-grained model of PEI, atomistic simulations of a 20 monomer long PEI chain were performed using the AMBER gaff force field39 and the AMBER 8 software package.40 The partial charges used for the PEI were determined with the RESP method39, 41 using the Gaussian03 program42 with the 6-31G* basis set. The chains were neutralized with Cl− ions and solvated with a rectangular 20 Å shell of TIP3P water surrounding the chain. The systems were first equilibrated with 2000 steps of energy minimization with harmonic restraints on the PEI atoms and, subsequently, 1000 steps of unrestrained minimization. The temperature was increased to 300 K over 20 ps of constant pressure simulation followed by 1.2 ns of an equilibration simulation at constant temperature (300K) and pressure (1 bar) using Langevin temperature equilibration with a collision frequency of 1.0 ps−1. The restraints were then removed and the production runs were performed with constant temperature and pressure for ~10 ns. A time step of 2 fs was used throughout all the simulations with SHAKE constraints43, 44 on covalent bonds with hydrogen atoms. The particle mesh Ewald method45 was used to treat long-range electrostatic interactions with a 10 Å direct space cutoff. The average distance between nearest neighbor and next-nearest neighbor nitrogen atoms was calculated using ptraj. These distance distributions are used to derive the coarse-grained model of PEI chain.
2.2 Coarse-grained models of PEI and DNA
In the Monte Carlo titrations, PEI was modeled with a bead-spring model, with each bead representing a monomer of PEI and the bead centered at the nitrogen atom of the amine group. The beads were connected via harmonic bond and harmonic angle bending potentials, given by
| (1) |
and
| (2) |
where kbond = 200kBT/Å2, l0 = 3.85 Å, kang = 0.002kBT/deg2, and θ0 = 150°. The values of l0 and θ0 were chosen to replicate the average distances between nearest neighbor amine nitrogen atoms and next-nearest neighbor amine nitrogen atoms found in the atomistic simulations, respectively. Non-bonded monomers separated by a distance less than l0 interacted through a purely repulsive 12-6 Lennard Jones potential
| (3) |
where εLJ = kBT. The Lennard-Jones potential was included only to prevent overlap between non-bonded beads and typically resulted in very low energies except during the equilibration stage of the simulation. The chains used in the titrations of free PEI had length, N = 100, while the chains used that formed complexes with the polyanion had length 50.
Double stranded DNA was modeled as a very simple polyanion formed by two parallel, linear strings of negatively charged beads. The two strands of the polyanion were separated by 10 Å, while the distance between consecutive charges on a strand was 5 Å. Each strand of the polyanion was 50 beads long, forming a polyanion with a total charge of −100. We have previously shown that the structure of a DNA duplex does not change significantly upon complexation with a smaller PEI,46 and therefore did not allow the polyanion to move in the simulation. In addition to electrostatic interactions, the polyanion beads interacted with the PEI as hard spheres, allowing for a minimum distance between the PEI and polyanion beads of 5 Å, preventing the PEI from moving in between the two strands of the polyanion.
2.3 Monte Carlo titrations
The titrations of PEI were performed using Metropolis Monte Carlo simulations with different steps that allowed for movement and titration of the PEI chain simultaneously. Two types of chain moves were allowed for free PEI: local bead translations that allowed for relaxation of the internal structure of the chain and pivot moves that resulted in larger scale conformational changes. For simulations of PEI in the presence of a polyanion, there were additional moves that allowed for translation of the entire chain and reptation of the chain. Trial chain movements were accepted based on the sum of bond, angle, Lennard-Jones, and electrostatic energies, as well as checking for overlap with DNA beads.
During a titration step, a bead, i, of the PEI chain was randomly chosen and its charge, q, was switched from 0 to +1 or +1 to 0. The titration step was accepted or rejected according to the Metropolis rule based on considering the intrinsic energy change associated with protonation or deprotonation as well as the electrostatic energy change resulting from the protonation switch24
| (4) |
where Wij is the electrostatic interaction energy between sites i and j, M was the total number of beads in the chain, and pK0 was the intrinsic pKa of site i as an isolated amine group. The ± sign was changed depending on whether a protonation or deprotonation was attempted. pH-pK0 was an input parameter of the simulation and pK0 was assumed to be the same for all of the titratable beads of PEI. A screened Coulomb potential was used, giving an electrostatic interaction of
| (5) |
where ε is the dielectric constant of the system and κ−1 is the Debye screening length, given by
| (6) |
where ε0 is the permittivity of a vacuum, e is the elementary charge, NA is Avogadro’s number, and Cs is the monovalent salt concentration expressed in moles/liter (M). Two different models for dielectric values were used: a constant dielectric, CD, model with εCD = 78.3, and a distance dependent dielectric, DD, model with
| (7) |
where rmax = 78.3/4 = 19.58Å and rij is the distance between charges in Å. Theoretical understanding on microscopic dielectric properties of solvent currently is limited and is under developing.47 In the literature, other forms of distance dependent dielectric constant models have been proposed,48, 49 which have more complex mathematical forms and sometimes with fitting parameters. The form in Eq. 7 being mathematically simple is frequently used in simulations of macromolecules including DNA50 and proteins.51, 52 Use of a distance dependent dielectric has been found to better represent solutions to the Poisson equation and solvation energies than a CD model.53 More discussion on why we use DD model will be presented later in section 3.1. When the DD model was used, changes in εDD caused corresponding changes in κ−1.
A typical Monte Carlo simulation involving a free PEI chain involved an equilibration stage of 100,000 pivot moves, each followed by many internal translation moves. The chain was initially fully deprotonated (i.e, uncharged) and the pH was well above pK0. At each value of pH, 1000N titration moves were attempted with 100 pivot moves, and subsequent internal translations, attempted after each N titration attempts. The pH was then increased by 0.2 pH units. The average fraction of protonated amine sites, α, at the given pH was calculated by simply averaging the charges over all sites:
| (8) |
The procedure for titrations in the presence of polyanion was similar, except the chain was initially fully protonated with the initial pH several units below pK0 and reptation and chain translation moves were included. The initial configuration of the system had the PEI near the polyanion, but no additional constraints were used to keep the PEI and polyanion together.
3. Results
3.1 Shift of pKa of diamines
In order to understand the protonation behavior of PEI, we first discuss protonation behavior of diamines, a subject that has recently been reviewed by Bencini et al.,20 who discussed how the protonation of the first amine group affects the subsequent protonation of the second amine of the molecule. Table 1 summarizes experimentally determined first and second pKa’s, as well as their difference ΔpK, for several diamines separated by varying the number of (CH2) groups. The protonation of the second amine is shifted to a lower pH than the first pKa, reflecting the influence of the charge/charge interaction between two positively charged amines. For ethylenediamine, ΔpK is a large value; it requires a significantly lower pH for protonation of the second amine to occur after the first amine group has been protonated. In comparison, the ΔpK of propylenediamine is significantly smaller, as the extra distance between amine groups caused by the addition of a third methylene group reduces the electrostatic repulsion between the two protonated sites.20 As the distance between the amine groups is further increased, ΔpK continues to drop, and the change in ΔpK becomes smaller. For example, the difference in ΔpK for pentamethylenediamine and hexamethylenediamine is small enough that it may be attributed to statistical error.20 From these experimental data, one can already appreciate that influence of protonation states between neighboring amines in PEI will be significant, however when the methylene units between two amines increases, the influence will be reduced.
Table 1.
Experimentally and computationally determined differences in the logarithms of the first and second protonation constants for diamines with Cs = 0.1 M.
| Experimental Datab | Calculated Datac | Simulation Datad | |||||
|---|---|---|---|---|---|---|---|
| Diamine | lo,(Å)a | pK1, pK2 | ΔpK | CD ΔpK | DD ΔpK | CD ΔpK | DD ΔpK |
| NH2-(CH2)2-NH2 | 3.5 | 9.89, 7.08 | 2.81 | 1.21 | 2.69 | 1.2 | 2.6 |
| NH2-(CH2)3-NH2 | 4.6 | 10.56, 8.76 | 1.80 | 1.02 | 1.67 | 1.0 | 1.7 |
| NH2-(CH2)4-NH2 | 5.6 | 10.72, 9.44 | 1.28 | 0.91 | 1.25 | 0.9 | 1.2 |
| NH2-(CH2)5-NH2 | 6.7 | 10.78, 9.85 | 0.93 | 0.83 | 1.01 | 0.8 | 1.0 |
| NH2-(CH2)6-NH2 | 7.5 | 10.97, 10.09 | 0.88 | 0.79 | 0.91 | 0.8 | 0.9 |
These experimental data motivated us to examine if the change in pKa of these diamines could be solely attributed to electrostatic repulsion between two charged amine groups. Because there are two amines groups in each diamine, the following diagram54 can be used in relating the microscopic equilibrium constants K1micro and K2micro, which can be computationally estimated, to the macroscopically measured K1 and K2:

Unlike many small molecules with two ionizable groups, these diamines are symmetrical, and the two singly protonated microstates are identical, resulting in K1=2K1micro. Also, K1K2=K1microK2micro. Therefore,
| (9) |
Values of K1micro and K2micro depend on microscopic free energy changes when protonating the first and second amine respectively. We will assume that the standard free energy change of the first protonation is the same as a primary amine, i.e, K1micro=K0. However, protonation of the second amine has an additional free energy cost due to electrostatic repulsion between the two amine sites:
| (10) |
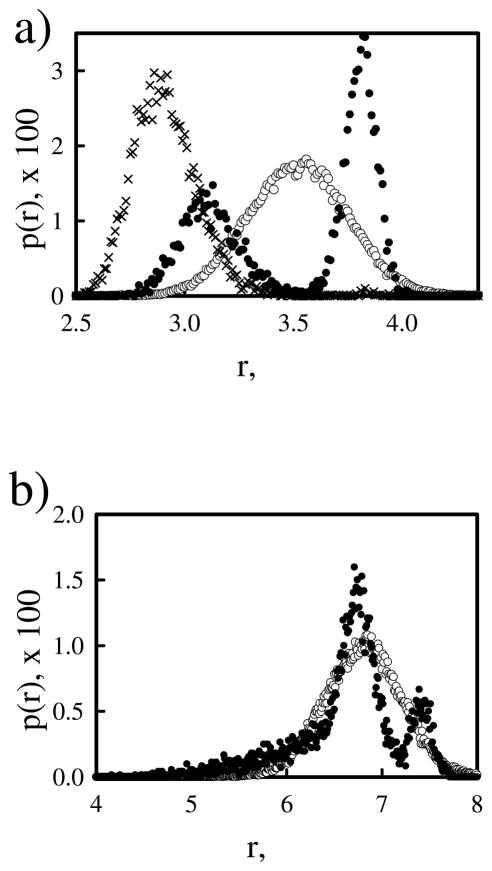
The charge/charge interaction can be approximated by a screened Columbic interaction so that ΔGelec=qiqjWij, where qi=qj=+1 for the second protonation and Wij is given in Eq. 5. To get a realistic estimate of rij, we performed atomistic molecular dynamic simulations of diamines in explicit water using AMBER 8 when only one amine is protonated and when both amines are protonated. Figure 1 presents the probability distribution of distances of singly and doubly protonated ethylenediamine and pentamethylenediamine. The distance between two amine groups, especially in the case of ethylenediamine, varies with the protonation states. For the singly protonated ethylenediamine, there is one peak centered around 2.9 Å in the distance distribution. For the doubly protonated species, the average distance between nitrogen atoms increases to around 3.5 Å, and the distribution is more complex, with a peak centered around 3.8 Å and a shorter peak centered around 3.1 Å. For pentamethylenediamine, the distribution for both the species is much broader and there is no apparent shift in equilibrium bond distance. We used rij=3.5 Å and 6.7 Å in Eq. 5 for ethylenediamine and pentamethylenediamine, respectively. Similar protocols were used to estimate the distance between two amine groups in the other diamines. Table 1 shows the computed ΔpK according to Eq. 9 and 10 with a constant dielectric for water, εCD=78.3. The predicted ΔpK do not agree very well with the experimentally observed ΔpK; the constant dielectric model underestimates the ΔpK when the distance between the two amines is short (i.e., in the case of ethylenediamines). This is not too surprising since dielectric constant of water at short distance can not reach the value of 78.3. We calculated ΔpK of the diamines using the distance dependent dielectric shown in Eq. 7. The predicted ΔpK with the distance dependent dielectric constant agreed much better with the experimentally observed ΔpK’s, especially for ethylenediamine. We also tried the Columbic interaction with the distance dependent dielectric, but the calculated ΔpK were too large for all the diamines. Other forms of distance dependent dielectric constant could be used, but since current theoretical understanding on microscopic dielectric constant is limited, at this stage, we will use this simple form with no adjustable fitting parameters. We will also retain both CD and DD forms in the rest of study keeping in mind that distance dependent dielectric model is a better model to reproduce experimental results for diamines.
Figure 1.
Distribution of bond lengths for atomistic and coarse-grained models of ethylenediamine (a) and pentamethylediamine (b). Distributions are shown from atomistic simulations of monoprotonated (×) and diprotonated (●) for ethylenediamine in (a), but only diprotonated (●) are shown for pentamethyledimaine in (b). The coarse-grained distributions (open circles) were created with lo = 3.5 Å and kbond = 20kBT/Å2 for ethylenediamine and lo = 6.7 Å and kbond = 6kBT/Å2 for pentamethylenediamine.
3.2 Monte Carlo Titration of diamines compounds
Before we present the titration of PEI chains, we first present Monte Carlo titration of diamines as a model system to validate our Monte Carlo titration method. The titrations of diamine model compounds follow the method used for PEI chains as outlined in the method section with only small modifications. All the diamine compounds were represented by two beads connected via a harmonic bond potential given in Eq. 2, where l0 is the equilibrium bond distance listed in Table 1, and kbond is chosen such that the bond distribution between the two beads matches approximately with the bond distribution from the atomistic simulation with the double protonated state. Typical values for kbond were around 5 to 20 kBT/Å2. In Figure 1, the equilibrium distance distribution obtained in the Monte Carlo titrations is overlayed with that from the atomistic MD simulations. For the ethylenediamine, we have chosen kbond so that the bond distribution is a broad peak, centered around the average distance, that encompasses much of both of the peaks in the distribution of the double protonated atomistic species. The charge on the two beads, q, was switched between 0 and +1 using a Monte Carlo titration step, which was accepted or rejected according to the Metropolis rule by considering the intrinsic energy changes associated with protonation or deprotonation as given in Eq. 4 in the method. We note Wij used was the same screened coulombic interaction. For these diamines, we have also monitored the fraction of doubly protonated, α2, singly protonated, α1, and zero-protonated species, α0, as a function of pH, in addition to the fraction of protonated amines, α. Figure 2 presents the dependence of these four fractions of diamines on pH. The average fraction of protonated amines α is a quantity that can be monitored experimentally through potentiometric titrations. One may observe that the dependence of α on pH in Figure 2 showed a two-step dissociation. The numerical curve could be fitted to extract the two apparent pKa’s, but such a method does not yield reliable values especially when the two pKa’s are close to each other. The more accurate way to locate the two pKa’s is to monitor the doubly, singly, and non-protonated species (i.e, α2, α1 and α0) individually. The macroscopic pK1 value is then determined by locating the pH where α1 =α0, and pK2 is the pH where α2=α1. The values of ΔpK determined by this approach are included in Table 1 as well. We note that the computationally determined ΔpK values will not be exactly same as the computed ΔpK through Eq. 9, although the two are very close, since during the Monte Carlo titration, the bond length fluctuates around the equilibrium bond length.
Figure 2.
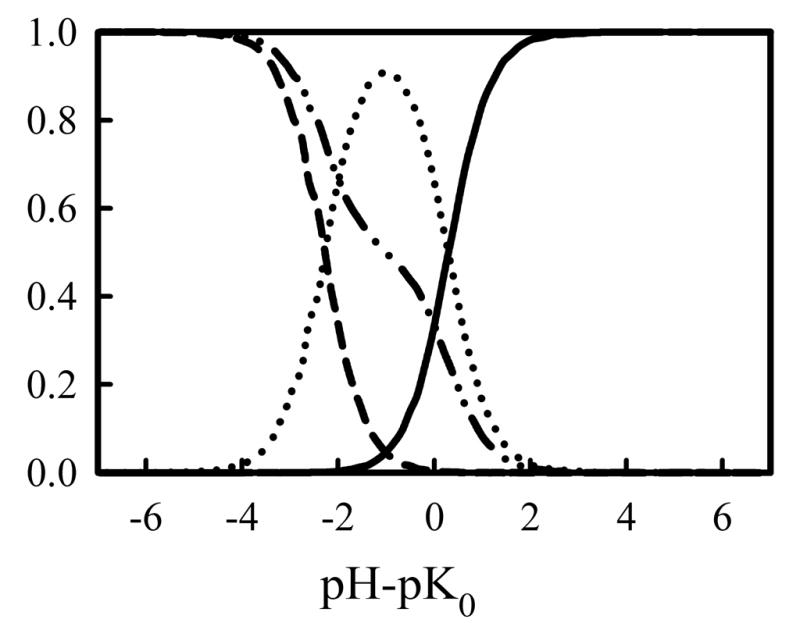
Computational speciation diagram of ethylenediamine showing the fraction of unprotonated (solid line), monoprotonated (dotted line), and diprotonated (dashed line) species as a function of pH for a coarse-grained model of ethylenediamine with lo = 3.5 Å and kbond = 20kBT/Å2. The computational titration curve (dashed-dotted line) is also shown.
For diamines with more than 4 methylene groups, the calculated ΔpK values are similar whether using the CD or the DD model. At the longer distances, the electrostatic repulsion is similar for both CD and DD situations for Cs = 0.1 M, because, while the DD results in an increase in the direct electrostatic interaction energy, it also increases the damping effect of the screened Coulomb factor, as the Debye length increases for the smaller dielectric values. There is a much greater difference between CD and DD models for ethylenediamine and propylenediamine, and the ΔpK values using the DD model are significantly higher than in the CD model. The DD also better approximates the experimental ΔpK values, as the CD underestimates the energy penalty for having two charged groups at such close distances. For amine groups separated by only a few angstroms, there is little room for water molecules to come between the amines to screen the electrostatic repulsion, and much of the space between the charges is occupied by methylene groups, creating an environment with a much lower dielectric medium than pure water. Overall, the agreement between Monte Carlo titration data and experimental data are very good especially when distance dependent dielectric constant is used. These data serve to validate our computational titration method.
3.3 Titrations of linear PEI
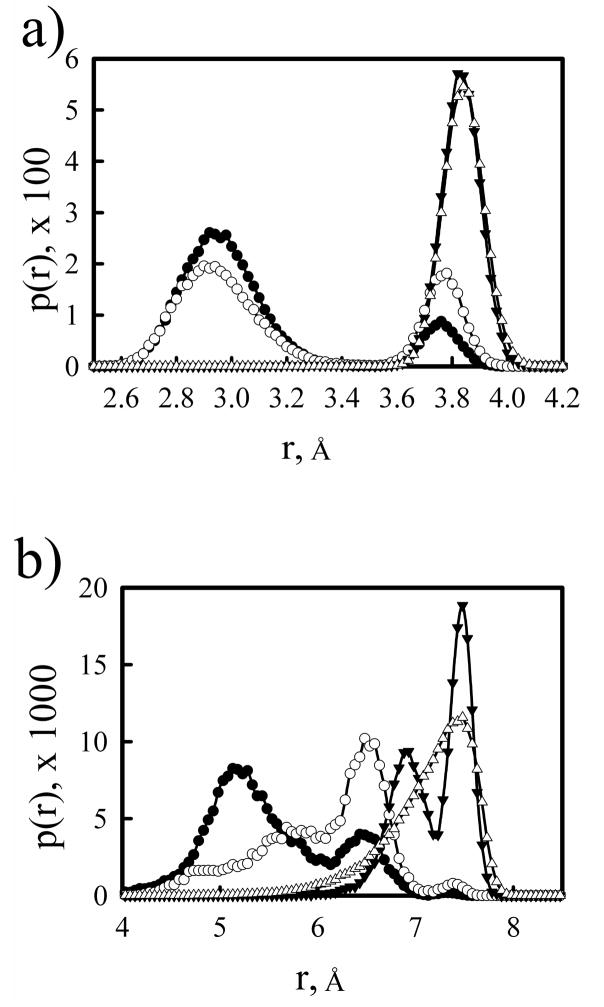
The coarse grained model of linear PEI chain used in the titrations has been given in the method section. Figure 3 presents distance distributions for nearest-neighbor and next-nearest neighbor amine groups from atomistic simulations of a 20-mer lPEI chain with three different protonation states: a chain with no protonated amine groups, one in which every other amine is protonated, and a fully protonated chain. While the nearest-neighbor distance distributions for the unprotonated and half-protonated chains have a larger peak centered near 2.9 Å and a smaller peak at 3.8 Å, only the peak at 3.8 Å appears in the distribution of the fully protonated chain. We also note that the nearest-neighbor distance distribution for the fully charged chain differs from that of the diprotonated ethylenediamine, the latter also had two peaks in the distance distribution. Except for the terminal beads of the chains, the amines of the fully protonated lPEI were neighbors with two charged sites, not just one site as in the case of a diamine, resulting in the chains taking conformation that increase the distance between charges in order to reduce the electrostatic repulsion. In the distance distributions for the next-nearest neighbors, there is a large difference between the unprotonated and half-protonated chain, as the maximum peak in the distribution of the half-protonated chain is shifted to a distance of ~ 1.5 Å greater than the maximum peak for the unprotonated chain. As every other amine in the half-protonated chain is charged, all next-nearest neighbor pairs repel each other and the chain takes conformations that reduce the repulsion. Similar to the nearest-neighbor distribution, the increased electrostatic repulsion in the fully charged chain shifts the peaks in the next-nearest neighbor distribution to even larger distances. Figure 3 also shows nearest and next-nearest neighbor distributions of the coarse-grained model of PEI using the parameters given in section 2.2. The coarse-grained model of lPEI was designed to reproduce the behavior of the fully charged lPEI chain. As will be discussed later, the primary factor that limits the protonation of PEI is the electrostatic repulsion resulting from protonation of neighboring amine groups, and, therefore, the main goal of our model was to correctly include the electrostatic interaction between nearby protonated sites. If a chain already has a significant fraction of amine groups protonated, subsequent attempts to protonate uncharged sites are more likely to be successful if the distance to charged sites is greater, i.e., protonation of site i that is 3.8 Å away from charged site i+1 is more likely than protonation of site j that is 2.9 Å from charged site j+1. Additionally, PEI is flexible and local conformations that are similar to fully charged PEI are accessible to chains with lower degrees of protonation. Therefore, the fully protonated chain will best replicate the local structure and electrostatic interaction that occurs when attempting to protonate a site nearby other charges.
Figure 3.
Distribution of distances between nearest neighbor (a) and next nearest neighbor (b) amine groups from atomistic molecular dynamics simulations of a 20-mer PEI with no amines protonated (open circles), every other amine protonated (filled circles), and all amines protonated (filled triangles) and from Monte Carlo simulations of a coarse-grained PEI model (open triangles).
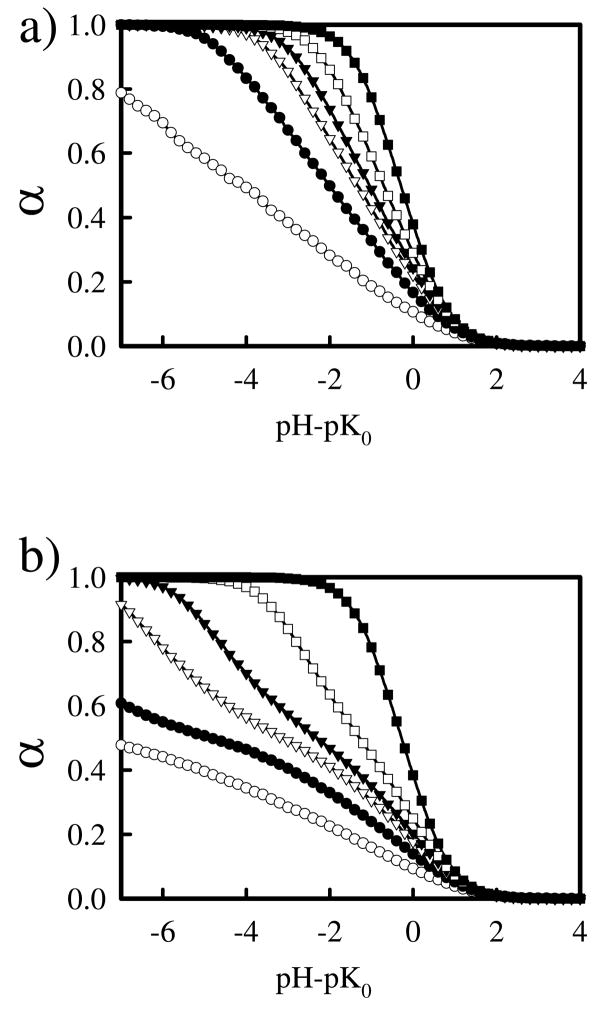
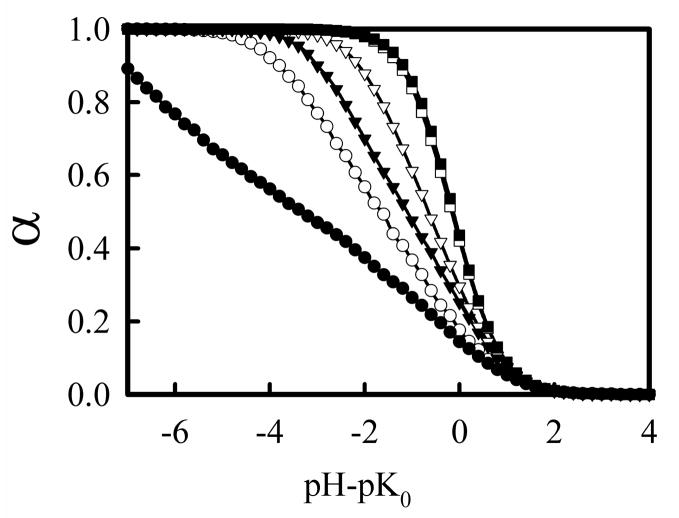
In contrast to diamines, it is not feasible to determine the individual pKa for each step of the protonation, and we instead monitor α, the fraction of protonated amine groups. Figure 4 shows plots of α as a function of pH for linear PEI with N = 100 at various salt concentrations using both CD and DD models. At high salt concentration (Cs = 1.0), the models result in similar behavior, with both models showing a steep rise in protonation as the pH approaches pK0 and the chain being completely protonated when pH-pK0 ≈ −2. As the salt concentration decreases, protonation of the chains becomes more difficult, as there are fewer ions to screen the electrostatic repulsion of nearby charges on the chain. For both models, there is significant change in the titration curves as salt concentration changes, a result that is not fully in agreement with the experimental curves for linear PEI by Smits et al.,12 but is in agreement with computational results reported in other studies.29, 55 The two models behave differently for lower salt concentrations, as it becomes more difficult to protonate amines using the DD model in low salt. For example, for Cs = 0.01 M, the chain is completely protonated using the CD model when pH – pK0 ≈ −4, but is only around 60% protonated at the corresponding pH in the DD model. For intermediate salt concentration (Cs = 0.05–0.25M), the divergence between the models only becomes apparent for higher values of α; for pH – pK0 > 0, the titration curves of the two models are similar.
Figure 4.
Simulated titration curves of linear PEI using constant (a) and distance dependent (b) dielectric models for salt concentrations, Cs = 0 (open circles), 0.01 (filled circles), 0.05 (open triangles), 0.10 (closed triangles), 0.25 (open squares), and 1.0 (closed squares) M.
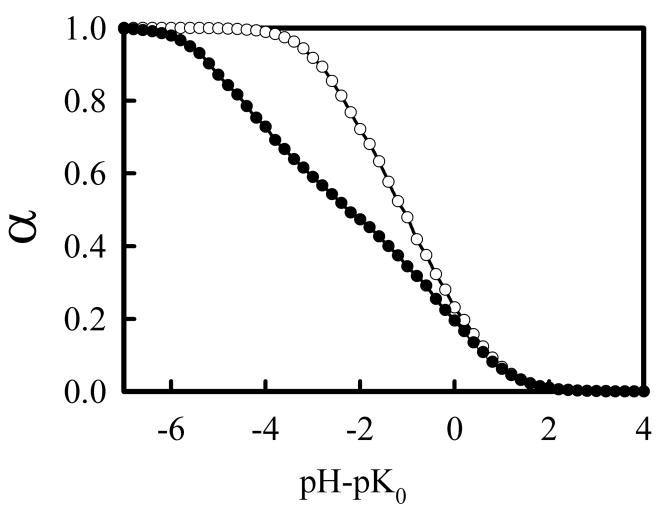
Of particular interest to understanding the protonation behavior in PEI used in gene therapy applications is determining its charge state under physiological conditions. Figure 5 shows titration curves using the CD and DD models at physiological salt concentration (Cs = 0.15 M). As typical amine pK0 values20 range between 10 and 10.5 and physiological pH is 7.4, the value of α at pH – pK0 ≈ −2.7 would provide an estimate of the fraction of protonated amine groups in PEI under physiological conditions. Using the CD model, α is close to one, a value that is much higher than previous estimates of the protonation of PEI under physiological conditions. In contrast, the DD model predicts that around 55% of the amines are protonated under physiological conditions, a result that is in good agreement with a previous estimate by Smits et al.12 but substantially higher than that of Suh et al.7 The titration curve of lPEI also reveals that it has a very wide buffering range, a factor that could be important its role as a “proton sponge” in gene delivery polyplexes. Using the pH where α = 0.9 as the lower limit of its buffer range, Figure 5 indicates that PEI would be able to buffer solutions with pH values as low as ~5, a value comparable with the known pH value in late endosomes.
Figure 5.
Simulated titration curves of linear PEI at physiological salt concentration (0.15 M) using CD (open circles) and DD (closed circles) models.
3.4 Charge distribution
One advantage of using simulations to study the protonation behavior of PEI is that the identity of the specific protonated sites is known, allowing for the understanding of how charges are distributed along the chain. Figure 6 compares titration curves of an lPEI chain of length 100 using the DD model when considering only the 50 beads in the middle of the chain, only the 25 beads on each end of the chain, only the 5 beads on each end of the chain, and only the terminal beads of the chain. Using both density functional theory and Monte Carlo titrations, Berghold et al.31 have shown that there is a depletion in local charge density in the center of the chain and an increase in local charge density at the chain ends. The data shown in Figure 6 agree in general with this trend, as the beads towards the ends of the chains have a slightly higher α for most pH values. While the results by Berghold31 were mostly limited to chains with an α of 0.25 or less, the data in Figure 6 show that increased charge at chain ends is maintained or slightly enhanced for higher α. The increase in relative charge towards the ends of the chains with increasing α can be largely explained by considering the behavior of the terminal beads of the chain. The value of α for the terminal beads can be over twice as large as the average α of the chain, resulting in an increase in the average α of the final 5 or 25 beads.
Figure 6.
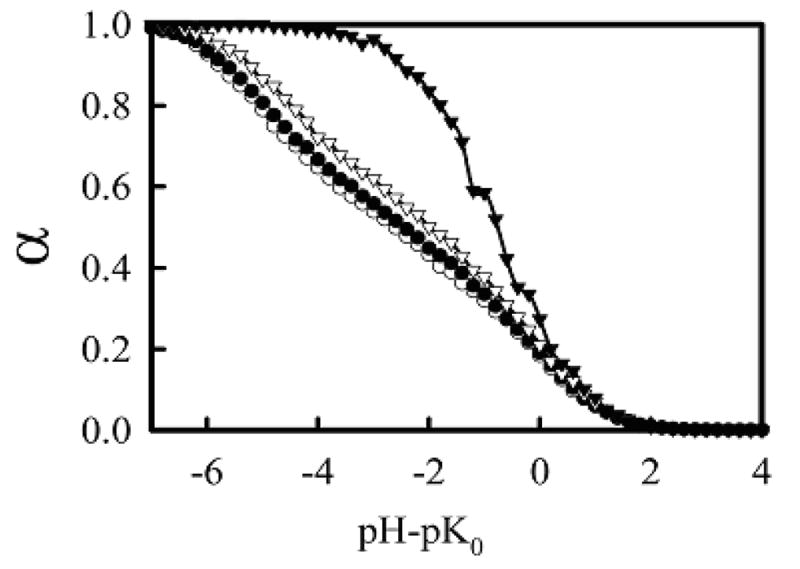
Exterior and interior bead titration curves for linear PEI using the DD model and Cs = 0.1 M. α was calculated for only the middle 50 beads of the chain (open circles), only the exterior 25 beads on each chain end (closed circles), only the 5 beads on each chain end (open triangles), and only the end beads of the chain (closed triangles).
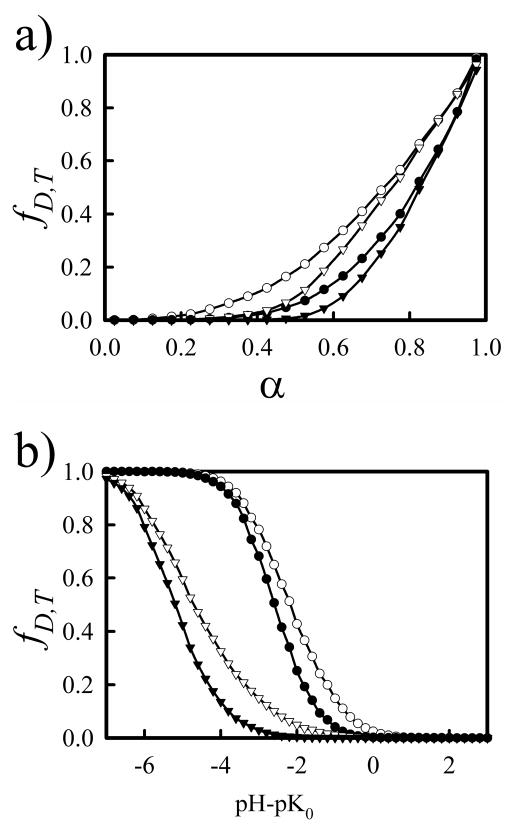
In order to gain insight into the arrangement of charges along the chains, the fraction of groups of 2 or 3 nearby amines that are entirely protonated has been calculated and is shown in Figure 7 for Cs = 0.1 M. Nearest neighbor amines that are both protonated are referred to doublets and the fraction of doublets, fD, is calculated from fD = PB/NB, where PB is the number of bonds in the chain in which both beads are protonated and NB is the total number of bonds in the chain. Groups of three amine groups that are all protonated are referred to as triplets, with the fraction of triplets, fT, is calculated from fT = PA/NA, where PA is the number of angles in the chain in which all three beads are protonated and NA is the total number of bond angles in the chain. The Ising model developed by Koper and colleagues12, 13, 19 is dependent on energy penalties associated with the formation of doublets and triplets. For chains with α < 0.5, the charges on the chain are arranged so that the formation of doublets is minimized and at α = 0.5, the chain has an ordered structure, with every other bead protonated. For α > 0.5, the formation of doublets is necessary, and the introduction of a triplet interaction energy is used to account for the asymmetry that is typical in polyelectrolyte titration curves.
Figure 7.
Fraction of protonated doublets, fD, (circles) and triplets, fT, (triangles) as a function of the degree of protonation, α, (a) or pH (b) with Cs = 0.1 M. Both CD (open symbols) and DD (closed symbols) models are shown.
Because of the higher electrostatic repulsion for nearby amines in the DD model, it is more difficult to protonate nearest neighbor amine sites using a DD in comparison with a CD, and, as expected, Figure 7(a) shows that fD and fT begin to increase at larger values of α for the DD model. In contrast with Koper’s Ising model, both models used here show that fD rises above 0 for α < 0.5. For α = 0.5, fD ≈ 0.1 and 0.2 for the DD and CD models, respectively. Figure 7(b), a plot of fD and fT as a function of pH shows that fD for the DD model begins to rise when pH – pK0 becomes negative. The difficulty in forming doublets in the DD model helps explain the difference in the titration curves for Cs = 0.1 M found in Figure 4. For pH – pK0 > 0, few doublets are formed in both models and the titration curves are similar. As pH – pK0 becomes negative, the formation of doublets in the CD model is prevalent and α increases rapidly. In the DD model, there is a high electrostatic penalty associated with the formation of doublets, limiting the α.
3.5 Effect of increasing distance between amine groups
As discussed above, titrations of diamines are greatly influenced by the number of methylene groups separating the nitrogen atoms; in particular, the presence of a third methylene in propylenediamine results in a large reduction in ΔpK in comparison with ethylenediamine. In order to study how the increasing the distance between the amine groups of a linear polyamine affected the protonation behavior of the chain, titrations of a chain with l0 = 4.8 Å were performed and are shown in Figure 8. While the parameters of the polycation in the previous titrations have been set to model PEI, increasing the bond distance to 4.8 Å creates a chain that is similar to polypropyleneimine or spermine. The additional distance between the amine groups results in a chain that is much easier to protonate, especially when using the DD model. While at low salt concentration (Cs = 0.01) for the PEI model, α for pH – pK0 = −7 is slightly less than 0.6, the corresponding α value for a chain with l0 = 4.8 Å is ~0.9. Increasing the distance between amine groups in the chain also affects protonation behavior for chains under physiological conditions, as α in the DD model for Cs = 0.15 and pH – pK0 = −2.7 is near 0.85, in contrast for α≈ 0.55 for the PEI chain model. These results are consistent with the protonation behavior of short polyamines such as spermidine and spermine, which are considered to be completely protonated at physiological pH.20
Figure 8.
Simulated titration curves for a polyamine chain with amines separated by 4.8 Å for both CD (open symbols) and DD (close symbols) models, and Cs = 0.01 (circles), 0.15 (triangles), and 1.0 (squares) M.
3.6 Titrations in the presence of a polyanion
Titrations of PEI in the presence of a simple DNA model were also performed in order to determine how the protonation of PEI changes in the DNA polyplexes, such as those that would be used for gene delivery. These simulations began with PEI chain fully protonated and placed near the center of the polyanion, and pH – pK0 = −7. During the equilibration stage, the PEI moved toward the polyanion and wrapped around or stretched out along the polyanion, with a sample configuration shown in Figure 9. As the pH of the system is increased, reducing the protonation state of the PEI, the attraction between the chains decreased, and the PEI moved away from the polyanion into the bulk solution. The exact pH and α values at which this separation occurred depended on the salt concentration and dielectric constant used in the simulation, but, due to the coarse-grained nature of the simulation and the lack of explicit counterions, the conditions under which the PEI and polyanion formed a complex were not investigated.
Figure 9.
Sample configuration PEI (white) bound to polyanion (black) with Cs = 0.15 using the DD model.
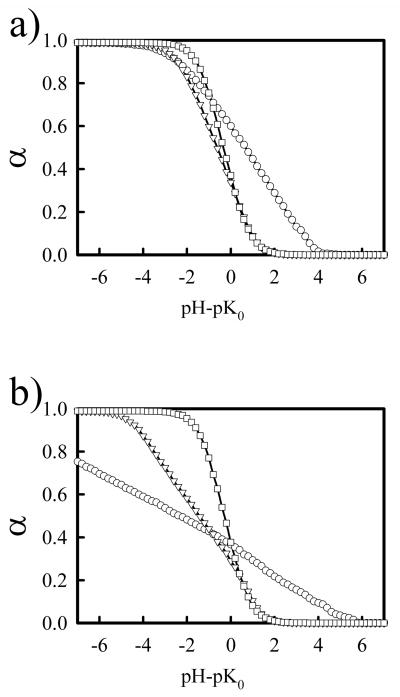
Figure 10 shows titrations curves for PEI in the presence of a polyanion using both CD and DD models. For Cs = 0.01 M, both models show interesting behavior when pH – pK0 > 0, with α not falling to zero until pH is over 4 units above pK0. This behavior is likely an artifact of the simulation, as no explicit counterions were included. At low Cs in the simulation, interactions between the polyanion and a partially protonated PEI chain would be strong, making it difficult for the PEI chain to separate from the DNA and for a given PEI amine group to deprotonate. In real systems, the polyanion would attract a significant number of counterions, reducing the energetic benefit in having protonated PEI amines at high pH, and the positive charge supplied by the PEI chain could be replaced by monovalent cations. For higher salt concentrations, the behavior at high pH is similar to that found of free PEI, with α decreasing to zero for pH – pK0 = 2. In general, Figure 10 shows that complexation with a polyanion results in a higher α value for the PEI when compared with free PEI. Under physiological conditions using the DD model, α for lPEI when bound to the polyanion is approximately 0.7, an increase of 25% compared to the protonation of free lPEI.
Figure 10.
Titration curves of linear PEI in the presence of DNA for CD (a) and DD (b) models and Cs = 0.01 (circles), 0.15 (triangles), and 1.0 (squares) M.
4. Discussion
In the above, we have focused on presenting our computational investigation on the protonation of lPEI in solution as well as when it complexed to a crude model of DNA chain. We will now compare our study against earlier experimental and theoretical studies and discuss the potential reasons that cause such wide range of protonation data reported in experiments, and also discuss the extent of reliability of our computational model.
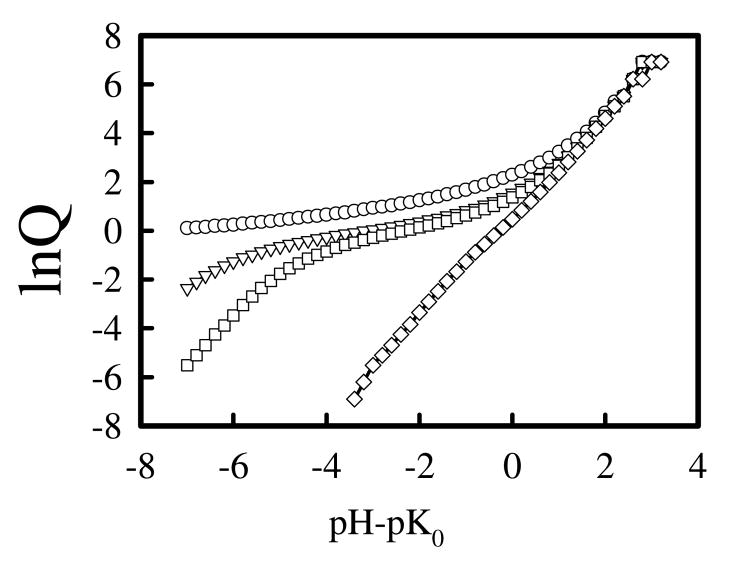
There are several difficulties encountered in experiments when determining the percent of protonated amines of PEI in experiments by potentiometric measurement. The potentiometric measurements give the change of solution pH versus the amount of titrant used. In order to convert from this raw data to the plot of pH versus percent of amine groups protonated, one needs to know exactly the total concentration of amine groups present in the solution. However, lPEI samples are very hydroscopic and may contain amounts of water of up to 20% to 40% of the total mass, which could seriously affect determination of the concentration of dissolved PEI. Secondly, lPEI is insoluble in water at room temperature48, so the usual practice is to dissolve PEI sample in acidic solution first, and then back titrate the solution with a base to reach a completely unprotonated state. Precipitation may occur during the titration. Then the sample is titrated again with the acid. By subtracting the amount of base used in the first titration and assume that all amines reached unprotonated state, one can then calculate the percent of protonated amines at different pH. Not all investigators used such an approach in determining the percent of protonated amine groups. Instead, they tried to fit the titration curve to some equations that treat the multiple protonation sites. For example, Suh et al.7 defined a reaction quotient, Q, fB/fB+, where fB and fB+ is the fraction of unprotonated and protonated amine groups, related to α in our study through Q= (1 − α)/α. They then assumed lnQ is linearly proportional to pH. This assumption is valid if the titration curve follows the standard Hendelsen-Hasselbach equation, but is not valid when the titration curve deviates from standard Hendelsen-Hasselbach equation. In Figure 11, we take our computational data, α, and re-plot it in lnQ vs. pH. The linear relationship between lnQ and pH can not be assumed for most of salt concentrations, except maybe at the highest salt 1.0 M. Indeed, there is no simple analytical equation one may use to fit the titration curve. For this reason, Koper et al. have developed a theory based on an Ising model. In their theoretical model, the energy for the formation of doublets and triplets were used as adjustable parameters to fit the experimental data. In comparison, our computational model did not contain any adjustable fitting parameters that can be used to fit experimental data.
Figure 11.
Replot of data in Figure 4(b) in the form of lnQ versus pH-pK0, where Q=(1 − α)/α, at salt concentrations Cs = 0.0M (circles), 0.05M (triangles), 0.1M (square), 1.0M (diamond).
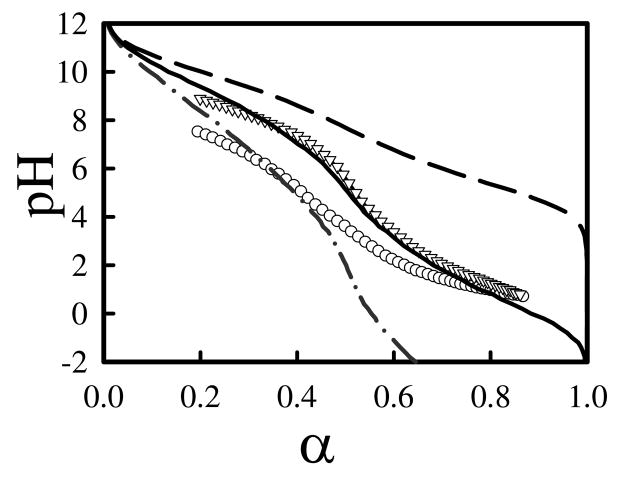
After considering these experimental facts, we feel that the most reliable experimental titration curves for lPEI were probably those reported by Smits et al.12 Comparing our computational titration curves against their experimental data reveals that computational titration curves with the DD model capture the features of the experimental titration curves, but have a too strong salt dependence. Figure 12 presents an overlay of computation titration curves with the DD model at three salt concentrations against their experimental titration curves at Cs= 0 M and 0.1 M. Here the only adjustable parameter is pK0, for which we have used pK0=10.0, a very reasonable value of intrinsic pKa for primary or secondary amine groups. Experimental titration curves at other salt concentrations lie near the curve for Cs=0.1M, only the salt-free curve lies significantly below those with salts. In comparison, the computational titration curves continually shift upward as the salt concentration increases. Interestingly, the computational titration curve at Cs=0.01M overlays with experimental data at Cs = 0.1M very well. None of the curves from the CD model could capture the features in the experimental titration curves. We note that we are simply overlaying the plots from computational titration curves with experimental titration curves; there were no fitting parameters. Ullner et al.30 have also investigated protonation behavior of weak polyacids with screened Columbic interaction and with explicit simple ions in a continuum water dielectric medium. Their computational titration curves also exhibit strong salt concentration dependence.
Figure 12.
Overlay of experimental titration curves from Smits et al.12 (shown in symbols) with computational titration curves (shown as lines) with distance dependent dielectric model. The salt concentrations for experimental curves Cs = 0M (circles) and 0.1M (triangles). Salt concentrations for computational titration curves are Cs = 0M (dot-dashed line), 0.01M (solid line), and 0.1M (dashed line). pK0 was assumed to be 10.0 in computational titration curves.
The comparison of our computational data against experimental titration curves by Smits et al.12 led us to believe that our computational titration with DD model have reasonably captured the basic features of the protonation behavior in lPEI, but is not able to account for salt concentration dependence very well. On the other hand, the CD model is inappropriate and is unable to account for protonation behavior of lPEI. We note the objective of our current study is not about developing a theory that could fit the experimental data; rather we are investigating if the continuum electrostatic interaction model could account for protonation behavior in lPEI. For this reason, we used a screened Coulomic interaction with a simple distance dependent dielectric model to account for electrostatic interaction between charged monomers. Other sophisticated distance dependent dielectric model will be tested in the future. Our study reveals that describing electrostatic interaction between charged monomers on a polyelectrolyte using a continuum solvent model is a challenging task. The most pressing need is to understand the dielectric properties in a polymer coil at microscopic scale. It would also been very helpful if one can understand the screening effect in polymer coil at different salt concentrations. It is also clear that our computational titration model for lPEI complexed with DNA is very crude. The dielectric properties and electrostatic interaction between charged monomers on lPEI near DNA should be investigated with atomistic simulations in explicit salt and water. We note that in biological modeling, a popular approach in treating electrostatic interaction in proteins is to define a dielectric medium with atomic scale feature. This approach however is too expensive to be used for investigating protonation behavior of flexible polymers like PEI, besides it also lacks theoretical justification for using discontinuous dielectric boundary.
Despite the above uncertainties, several things can still be learned from our computational investigation. Our computational investigation showed that a major factor in reducing the protonation of PEI is the high electrostatic energy caused by forming doublet interactions, supporting the assumption used by Borkovec and Koper.19 While the amine groups of the chain do not completely alternate between being charged and uncharged when α = 0.50, the formation of doublets and triplets is primarily limited to cases where α > 0.50. Additionally, we find that while the presence of a polyanion results in an increase in the protonation state of PEI at a given pH, many amines remain unprotonated under physiological conditions. This last claim however will need to be checked with more accurate models.
The computational results shown here indicate that PEI has several structural features that make it particularly well-suited to be a gene delivery vector. It offers both a high charge density and many unprotonated amine groups at physiological conditions. With approximately 55% of the amine groups being protonated under physiological conditions and the amine groups being located along the chain backbone, PEI has a relatively high charge density. If a charged-uncharged alternating structure is assumed for PEI with approximately 50% protonated, the charges of a PEI chain under physiological conditions are only separated by approximately 7 Å. In contrast, the charges of a fully protonated PLL chain, in which the amines are located on the side groups, are separated by over 10 Å. The closeness of the amine groups in PEI also allows for the PEI to not be completely protonated under physiological conditions, giving PEI the ability to act as a proton sponge in the endosomal compartments that gene therapy vectors must encounter. Increasing the distance between potential chain charges by as little as 1 Å, roughly corresponding to the addition of an extra methylene group between the amines, resulted in a large increase in the protonation state of the chain, indicating that other polyamines would not have PEI’s ability to act as a proton sponge.
5. Conclusion
The inconsistency in reported PEI protonation states in solutions led us to investigate protonation behavior of lPEI in solutions with a computational approach. We first examined the protonation behavior of model diamine compounds and found that a distance dependent dielectric constant plus a screened coulombic interaction between two charged amines could account for the shifted pKa for the model diamine compound. We then incorporated this electrostatic interaction term into a realistic coarse-grained lPEI chain derived from atomistic simulations and performed Monte Carlo titrations. This yields computational derived titration curves in terms of percent of protonated amines at a given pH. The obtained computational titration curves are found to be in best agreement with experimental results by Smits et al, but are in disagreement with other experimental studies. Potential sources of errors in the inconsistent experimental values could be traced to data analysis and concentration determinations. Our computational investigation showed that at physiological conditions, lPEI has approximately ~55% amines protonated and the charges on lPEI chain are arranged in nearly alternating fashion. This implies that the two charged amines are separated approximately by 7 Å, a distance comparable to the Bjerrum length in water. This distance between two charged amines may represent a critical structural requirement in the design of efficient non-viral gene delivery vector. Our computational investigation however also reveals that describing electrostatic interaction between charged monomers on a polyelectrolyte is a challenging task. The predicted titration curves based on our current computational model have a stronger salt dependence than that observed in experiments by Smits et al. This points to the need of a better understanding on microscopic dielectric properties of salt solutions.
Acknowledgments
We acknowledge the support provided by Oak Ridge Associated University in partner with Oak Ridge National Lab through ORAU/ORNL high performance computing grant (project BIP011). The high performance computing facility at University of Memphis is also acknowledged. Partial financial fund from NIH/NIGMS (R01GM073095-01A2) through a subcontract from Iowa State University is acknowledged.
References
- 1.Boussif O, Lezoualc’h F, Zanta MA, Mergny MD, Scherman D, Demeneix B, Behr JP. Proc Natl Acad Sci USA. 1995;92:7297–7301. doi: 10.1073/pnas.92.16.7297. [DOI] [PMC free article] [PubMed] [Google Scholar]
- 2.Neu M, Fischer D, Kissel T. J Gene Med. 2005;7:992–1009. doi: 10.1002/jgm.773. [DOI] [PubMed] [Google Scholar]
- 3.Lungwitz U, Breunig M, Blunk T, Gopferich A. Eur J Pharm Biopharm. 2005;60:247–266. doi: 10.1016/j.ejpb.2004.11.011. [DOI] [PubMed] [Google Scholar]
- 4.Godbey WT, Barry MA, Saggau P, Wu KK, Mikos AG. J Biomed Mater Res. 2000;51:321–328. doi: 10.1002/1097-4636(20000905)51:3<321::aid-jbm5>3.0.co;2-r. [DOI] [PubMed] [Google Scholar]
- 5.Merdan T, Kunath K, Fischer D, Kopecek J, Kissel T. Pharm Res. 2002;19:140–146. doi: 10.1023/a:1014212630566. [DOI] [PubMed] [Google Scholar]
- 6.Forrest ML, Pack DW. Mol Ther. 2002;6:57–66. doi: 10.1006/mthe.2002.0631. [DOI] [PubMed] [Google Scholar]
- 7.Suh J, Paik HJ, Hwang BK. Bioorg Chem. 1994;22:318–327. [Google Scholar]
- 8.Nagaya J, Homma M, Tanioka A, Minakata A. Biophys Chem. 1996;60:45–51. [Google Scholar]
- 9.von Harpe A, Petersen H, Li Y, Kissel T. J Controlled Release. 2000;69:309–322. doi: 10.1016/s0168-3659(00)00317-5. [DOI] [PubMed] [Google Scholar]
- 10.Choosakoonkriang S, Lobo BA, Koe GS, Koe JG, Middaugh CR. J Pharm Sci. 2002;92:1710–1722. doi: 10.1002/jps.10437. [DOI] [PubMed] [Google Scholar]
- 11.Jeong JH, Kim SW, Park TG. Prog Polym Sci. 2007;32:1239–1274. [Google Scholar]
- 12.Smits RG, Koper GJM, Mandel M. J Phys Chem. 1993;97:5745–5751. [Google Scholar]
- 13.Borkovec M, Koper GJM. J Phys Chem. 1994;98:6038–6045. [Google Scholar]
- 14.Borkovec M, Koper GJM. Macromolecules. 1997;30:2151–2158. [Google Scholar]
- 15.Borkovec M, Daicic J, Koper GJM. Proc Natl Acad Sci USA. 1997;94:3499–3503. doi: 10.1073/pnas.94.8.3499. [DOI] [PMC free article] [PubMed] [Google Scholar]
- 16.van Duijvenbode RC, Rajanayagam A, Koper GJM, Borkovec M, Paulus W, Steuerle U, Haussling L. Phys Chem Chem Phys. 1999;1:5649–5652. [Google Scholar]
- 17.Koper GJM, van Duijvenbode RC, Stam DDPW, Steuerle U, Borkovec M. Macromolecules. 2003;36:2500–2507. [Google Scholar]
- 18.Garces JL, Koper GJM, Borkovec M. J Phys Chem B. 2006;110:10937–10950. doi: 10.1021/jp060684i. [DOI] [PubMed] [Google Scholar]
- 19.Borkovec M, Koper GJM, Piguet C. Curr Opin Coll Int Sci. 2006;11:280–289. [Google Scholar]
- 20.Bencini A, Bianchi A, Garcia-Espana E, Micheloni M, Ramirez JA. Coord Chem Rev. 1999;188:97–156. [Google Scholar]
- 21.Erbacher P, Bettinger T, Belguise-Valladier P, Zou S, Coll JL, Behr JP, Remy JS. J Gene Med. 1999;1:210–222. doi: 10.1002/(SICI)1521-2254(199905/06)1:3<210::AID-JGM30>3.0.CO;2-U. [DOI] [PubMed] [Google Scholar]
- 22.Merdan T, Callahan J, Petersen H, Kunath K, Bakowsky U, Kopeckova P, Kissel T, Kopecek J. Bioconj Chem. 2003;14:989–996. doi: 10.1021/bc0340767. [DOI] [PubMed] [Google Scholar]
- 23.Bashford D, Karplus M. Biochem. 1990;29:10219–10225. doi: 10.1021/bi00496a010. [DOI] [PubMed] [Google Scholar]
- 24.Beroza P, Fredkin DR, Okamura MY, Feher G. Proc Natl Acad Sci USA. 1991;88:5804–5808. doi: 10.1073/pnas.88.13.5804. [DOI] [PMC free article] [PubMed] [Google Scholar]
- 25.Gilson MK. Proteins: Struct, Funct, Genet. 1993;15:266–282. doi: 10.1002/prot.340150305. [DOI] [PubMed] [Google Scholar]
- 26.Yang AS, Honig B. J Mol Biol. 1993;231:459–474. doi: 10.1006/jmbi.1993.1294. [DOI] [PubMed] [Google Scholar]
- 27.van Vlijmen HWT, Schaefer M, Karplus M. Proteins. 1998;33:145–158. doi: 10.1002/(sici)1097-0134(19981101)33:2<145::aid-prot1>3.0.co;2-i. [DOI] [PubMed] [Google Scholar]
- 28.Reed CE, Reed WF. J Chem Phys. 1992;96:1609–1620. [Google Scholar]
- 29.Ullner M, Jonsson B. Macromolecules. 1996;29:6645–6655. [Google Scholar]
- 30.Ullner M, Woodward CE. Macromolecules. 2000;33:7144–7156. [Google Scholar]
- 31.Berghold G, van der Schoot P, Seidel C. J Chem Phys. 1997;107:8083–8088. [Google Scholar]
- 32.Zito T, Seidel C. Eur Phys J A. 2002;8:339–346. doi: 10.1140/epje/i2002-10019-y. [DOI] [PubMed] [Google Scholar]
- 33.Ulrich S, Laguecir A, Stoll S. J Chem Phys. 2005;122:094911. doi: 10.1063/1.1856923. [DOI] [PubMed] [Google Scholar]
- 34.Laguecir A, Ulrich S, Labille J, Fatin-Rouge N, Stoll S, Buffle J. Eur Poly J. 2006;42:1135–1144. [Google Scholar]
- 35.Uyaver S, Seidel C. Macromolecules. 2009;42:1352–1361. [Google Scholar]
- 36.Ulrich S, Laguecir A, Stoll S. Macromolecules. 2005;38:8939–8949. [Google Scholar]
- 37.Ulrich S, Seijo M, Laguecir A, Stoll S. J Phys Chem B. 2006;110:20954–20964. doi: 10.1021/jp063671d. [DOI] [PubMed] [Google Scholar]
- 38.Laguecir A, Stoll S. Polymer. 2005;46:1359–1372. [Google Scholar]
- 39.Wang J, Cieplak P, Kollman PA. J Comput Chem. 2000;25:1049–1074. [Google Scholar]
- 40.Case DA, Darden TA, Cheatham TE, III, Simmerling CL, Wang J, Duke RE, Luo R, Merz KM, Wang B, Pearlman DA, Crowley M, Brozell S, Tsui V, Gohlke H, Mongan J, Hornak V, Cui G, Beroza P, Schafmeister C, Caldwell JW, Ross WS, Kollman PA. AMBER. Vol. 8. University of California; San Francisco: 2004. [Google Scholar]
- 41.Bayly CI, Cieplak P, Cornell WD, Kollman PA. J Phys Chem. 1993;97:10269–10280. [Google Scholar]
- 42.Frisch MJ, Trucks GW, Schlegel HB, Scuseria GE, Robb MA, Cheeseman JR, Montgomery JA, Jr, Vreven T, Kudin KN, Burant JC, Millam JM, Iyengar SS, Tomasi J, Barone V, Mennucci B, Cossi M, Scalmani G, Rega N, Petersson GA, Nakatsuji H, Hada M, Ehara M, Toyota K, Fukuda R, Hasegawa J, Ishida M, Nakajima T, Honda Y, Kitao O, Nakai H, Klene M, Li X, Knox JE, Hratchian HP, Cross JB, Bakken V, Adamo C, Jaramillo J, Gomperts R, Stratmann RE, Yazyev O, Austin AJ, Cammi R, Pomelli C, Ochterski JW, Ayala PY, Morokuma K, Voth GA, Salvador P, Dannenberg JJ, Zakrzewski VG, Dapprich S, Daniels AD, Strain MC, Farkas O, Malick DK, Rabuck AD, Raghavachari K, Foresman JB, Ortiz JV, Cui Q, Baboul AG, Clifford S, Cioslowski J, Stefanov BB, Liu G, Liashenko A, Piskorz P, Komaromi I, Martin RL, Fox DJ, Keith T, Al-Laham MA, Peng CY, Nanayakkara A, Challacombe M, Gill PMW, Johnson B, Chen W, Wong MW, Gonzalez C, Pople JA. Gaussian 03, Revision C. 02. Gaussian, Inc; Wallingford CT: 2004. [Google Scholar]
- 43.Ryckaert JP, Ciccotti G, Berendse HJC. J Comp Phys. 1997;23:327–341. [Google Scholar]
- 44.Miyamoto S, Kollman PA. J Comput Chem. 1992;13:952–962. [Google Scholar]
- 45.Darden T, York D, Pedersen L. J Phys Chem. 1993;98:10089–10092. [Google Scholar]
- 46.Ziebarth J, Wang Y. Biophys J. 2009;97:1971–1983. doi: 10.1016/j.bpj.2009.03.069. [DOI] [PMC free article] [PubMed] [Google Scholar]
- 47.Gong H, Freed KF. Phys Rev Lett. 2009;102:057603. doi: 10.1103/PhysRevLett.102.057603. [DOI] [PubMed] [Google Scholar]
- 48.Ramstein J, Lavery R. Proc Natl Acad Sci USA. 1988;85:7231–7235. doi: 10.1073/pnas.85.19.7231. [DOI] [PMC free article] [PubMed] [Google Scholar]
- 49.Mazur J, Jernigan RL. Biopolymers. 1991;31:1615–1629. doi: 10.1002/bip.360311316. [DOI] [PubMed] [Google Scholar]
- 50.Fritsch V, Westhof E. J Am Chem Soc. 1991;113:8271–8277. [Google Scholar]
- 51.David L, Luo R, Gilson MK. J Comput Chem. 2000;21:295–309. doi: 10.1002/jcc.10120. [DOI] [PubMed] [Google Scholar]
- 52.Li L, Chen R, Weng Z. Proteins. 2003;53:693–707. doi: 10.1002/prot.10460. [DOI] [PubMed] [Google Scholar]
- 53.Vasilyev V. J Comput Chem. 2002;23:1254–1265. doi: 10.1002/jcc.10131. [DOI] [PubMed] [Google Scholar]
- 54.Jameson RF, Hunter G, Kiss T. J Chem Soc, Perkin Trans. 1980;2:1105–1110. [Google Scholar]
- 55.Kitano T, Kawaguchi S, Ito K, Minakata A. Macromolecules. 1987;20:1598–1606. [Google Scholar]


