

Abstract
Morphogenesis in plants arises from the interplay of genetic and physical interactions within a growing network of cells. The physical aspects of cell proliferation and differentiation are genetically regulated, but constrained by mechanical interactions between the cells. Higher plant tissues consist of an elaborate three-dimensional matrix of active cytoplasm and extracellular matrix, where it is difficult to obtain direct measurements of geometry or cell interactions. To properly understand the workings of plant morphogenesis, it is necessary to have biological systems that allow simple and direct observation of these processes. We have adopted a highly simplified plant system to investigate how cell proliferation and expansion is coordinated during morphogenesis. Coleocheate scutata is a microscopic fresh-water green alga with simple anatomical features that allow for accurate quantification of morphogenetic processes. Image analysis techniques were used to extract precise models for cell geometry and physical parameters for growth. This allowed construction of a deformable finite element model for growth of the whole organism, which incorporated cell biophysical properties, viscous expansion of cell walls, and rules for regulation of cell behavior. The study showed that a simple set of autonomous, cell-based rules are sufficient to account for the morphological and dynamic properties of Coleochaete growth. A variety of morphogenetic behavior emerged from the application of these local rules. Cell shape sensing is sufficient to explain the patterns of cell division during growth. This simplifying principle is likely to have application in modeling and design for engineering of higher plant tissues.
Keywords: biophysics, Coleochaete, dynamics, morphogenesis microscopy
Plant cells proliferate within a semirigid cell wall matrix. Unlike animal cells, which are free to migrate to their final position within a developing tissue, plant cells are laid down, brick-like, in a sequence of cell division events. For any given cell division, a new wall is deposited and the orientation and position of the daughter cells is locked in place. The final form of a tissue or organ is due to the coordinated patterns of cell proliferation, expansion, and differentiation. Though the components required for these basic processes have become increasingly well characterized, still little is known of their precise spatial and temporal control.
Plant anatomists working in the 1800s contributed to the formulation of the Cell Theory and emphasized the importance of the polarity of cell division during plant morphogenesis. Hofmeister, Sachs, and Ererra (1 –3) established a series of empirical rules that broadly described the behavior of dividing plant cells. Hofmeister observed that if a plant tissue grows in different directions, cell divisions are generally perpendicular to the direction of fastest growth, and Sachs stated that a new cell wall meets side walls at a right angle. Further, Errera’s rule states that new cell walls follow the shortest path that will divide the parent cell, as if the nascent wall transiently possessed the surface minimization properties of a fluid. It was clear to these workers that many of the properties of dividing plant cells could have a physical underpinning, and this view was exemplified in D’Arcy Wentworth Thompson’s book On Growth and Form (4).
However, genetic, molecular, and biochemical models have come to dominate thinking in this field over the past century. In particular, genetic studies have provided large amounts of information about the components that drive plant cell processes, and have contributed greatly to our understanding of what goes on inside cells. However, our understanding of how cellular processes are integrated across a growing tissue has not advanced at a comparable rate. There is still considerable debate over the relative contribution of physical and genetic processes to the coordination of cell growth during morphogenesis (5). At one extreme, a molecular geneticist would point to DNA-regulated control of cell division, elongation and differentiation, and exchange of genetic information between cells, and suggest that this would be sufficient to regulate morphogenesis. At the other extreme, a biophysicist might point to the work of Green and others (6), suggesting that tissue buckling might provide a physical basis for organogenesis, where Lintilhac and co-workers have shown that simple application of stress to protoplasts induced cell divisions in directions constrained by the applied force (7, 8). These conflicting viewpoints represent extremes that have been formalized in cellular and organismal theories of morphogenesis (9).
Coleochaete as a Model System.
Unfortunately, experimental systems that are convenient for genetic studies are not so amenable to biophysical studies, and vice versa. Genetic screens for defects in cell division and expansion processes are made difficult by the complicated life cycle of higher plants (mutant phenotypes are likely to be lethal, obscured in the fully enclosed embryo, and masked by similar biochemical defects). In addition, the 3D architecture of higher plants makes them difficult subjects for modeling of genetic and physical interactions. There is a pressing need for a simpler experimental system that can be experimentally facile and allow a more complete, numerical description of the physics and genetics of cell growth.
The Coleochaetales form a small group of microscopic but complex algal species that are found in freshwater. C. orbicularis and C. scutata grow as discoid multicellular thalli with a simple meristem structure. The thalli adhere to a substrate, and undisturbed thalli can maintain a circular shape up to several millimeters in diameter as a result of precisely coordinated sequences of anticlinal and periclinal divisions (10). The meristematic zone is limited to a single layer of cells on the circumference of the growing disk. Many features of the algae life cycles and habit make them potentially attractive for modern scientific studies. In particular, the systems offer (i) morphological simplicity with cell divisions constrained to two dimensions and (ii) ease of culture with every cell observable during development.
Computer Models of Plant Cell Growth.
Plant morphogenesis is a dynamic process where large numbers of cells proliferate and differentiate in a precise sequence of events. Numerous molecular and physical interactions between cells are required for the control of cell behavior, and gaining a quantitative description is difficult. In previous studies, image analysis tools have been used to process microscopy images and quantify deformation in tissues (11, 12). Software models based on reaction diffusion systems have been used to describe molecular transport phenomena (13), gene regulatory networks have been employed to model the regulation of gene expression (14), and feedback-regulated models for polar auxin transport can predict canalisation of vascular tissues (15). However, the mechanics of cell expansion is central to the regulation of cell shape and division, and there has been little focus on the physics of cellular growth within tissues. The earliest models have implemented empirical expansion rules (16) and, more recently, multicellular physical interactions have been mimicked using repulsive spring forces between the centers of neighboring cells (13), or where the growth of elastic cell walls was represented by springs of varying natural lengths (17). More accurate models of cell expansion and division are needed as the base for improved modeling of morphogenesis. This requires experimental systems that allow congruence between the experimental observations and numerical model. Using the Coleochaete system, it is possible to precisely visualize cell geometry and dynamics during morphogenesis of the whole organism, to derive physical parameters for growth, and to combine these to build more accurate models for morphogenesis. We show that it is possible to formulate simple rules that underpin dynamic models of morphogenesis. These rules form a basis for modeling and engineering plant form.
Results
Simplified Morphology of Coleochaete Allows Quantification of Whole-Organism Cellular Development.
Cultured Coleochaete scutata can be grown as an adherent monolayer of cells, attached to the surface of a microscope coverslip. The growing thalli can be directly observed at high resolution using differential interference contrast optics or fluorescence microscopy techniques. Plant architecture is characterized by the presence of cell walls that encase individual cells and form a lamellar sheet between neighbors. We have developed a number of specific staining procedures for live and fixed Coleochaete specimens, adapted from work with Arabidopsis (18). The simple morphology and ease of culture of Coleochaete has allowed the development of high-throughput techniques for characterizing cellular growth. We could specifically label cell walls with propidium iodide or calcofluor white, and obtain high-contrast images of cell wall segments and intercellular junctions with ease using fluorescence microscopy (Fig. 1A). The high-contrast images are suitable for analysis by image segmentation techniques.
Fig. 1.

Quantitative analysis of cellular morphogenesis. (A) Image segmentation can be used to obtain a quantitative description of cellular architecture in live specimens. A microscope image of a Coleochaete scutata thallus is shown overlaid with an automatically extracted map of cell wall segments and intercellular junctions. (Scale bar: 50 μm.) (B) Time-lapse imaging allows quantitation of growth. Radial expansion of individual thalli is shown (dashed lines; the shaded area indicates the 95% confidence interval). The curves can be fitted to provide parameter values for a biomechanical growth model for C. scutata expansion (solid line). (C) The simple morphology of Coleochaete allows analysis of individual cell trajectories and geometric properties during growth. The cross-sectional areas of an individual cell and its daughter cells were tracked over 80 h. Gray levels indicate the generation (corresponding to the number of cell divisions during the experiment), and dashed lines indicate cell divisions (ad, anticlinal division; pd, periclinal division).
A wide-field microscope with a motorized stage was used for parallel capture of time-lapse sequences of growing thalli. Images were analyzed using an algorithm based on watershed segmentation. This allowed quantitative extraction of the geometry of cell arrangements and network of cell walls. Then, cellular architectures could be formally described as a hierarchical arrangement of different types of subunits (e.g., vertices, walls, cells, and tissues). These form hierarchical graph objects for visualization and compact data structures for storage.
Image sequences were used to measure radial expansion rate of circular thalli (6.5 10−5 μm·s−1). Using a simple biomechanical model (Eq. 1), we could derive an estimate of cell wall viscosity as a function of the radial expansion rate. In addition, we developed an image segmentation method (Fig. 1A) for extracting quantitative information about cell shape changes and patterns of division within Coleochaete thalli. All cells are visible during the course of an experiment, and we could track the expansion and division trajectories of individual cells (394 cell division events from 20 thalli) to obtain finely resolved kinematic data (Fig. 1 B and C).
Simple Rules Can Describe Cell Proliferation.
Plant cell expansion is believed to result from turgor pressure acting as a driving force on a yielding cell wall, where these factors are controlled by the genetic state of individual cells. In a population, however, the interplay of forces between cells will constrain as well as promote cell expansion. This kind of physical feedback can play an important role in regulating morphogenesis. Now, cell expansion, mitosis, and well formation can be directly observed and easily measured for every cell in a growing Coleochaete thallus, and we have used these observations to formulate simple rules that govern cell growth and division and form the basis for dynamic models of morphogenesis.
- Cell expansion and mitosis are restricted to cells on the margins of the algal thallus. Observation of growing Coleochaete indicated that cells on the interior of thalli are relatively constant in size and show little evidence of any cell expansion. Observed patterns of cell division within Coleochaete scutata are consistent with the location of mitosis exclusively within marginal cells (Fig. 2 A–D). Observations and evidence from early studies further support this hypothesis (19, 20). These experimental observations can be encapsulated in a viscous model for cell walls (21, 22), linking turgor pressure, wall viscosity, and cell size to tissue expansion (SI Text):
where
 is the thallus expansion rate, P is the turgor pressure, e is thickness of the cell wall, lr/lt are radial tangential cell dimensions, and μ is the wall viscosity coefficient. Viscosity assumes deformation is proportional to stress. Therefore, in this simple system, cell walls are maintained in tension by turgor pressure and deform at a rate proportional to tensile forces. The result is a circular-shaped tissue expanding constantly with geometrical and biophysical properties influencing expansion to a similar extent. Thickness of plant cell walls generally lies in the range of 0.1 μm to 0.3 μm, but can exceed 1 μm (23). A value of 0.25 μm was estimated from transmission electron micrographs of Coleochaete cell walls (20). Measured turgor pressures can vary from 0.2 MPa to over 1 MPa (21, 24, 25). We have assumed a turgor pressure of 0.5 MPa. The viscosity coefficient derived from these parameters was 1.2 103 GPa·s.
 A minimum cell volume is required to trigger mitosis. Cells within the interior of Coleochaete thalli have varied radial and tangential dimensions, but their cross-sectional areas remain relatively constant at around 400 μm2. Measurements of cells at division (Fig. 2E) showed that although their shape varied widely, with tangential-to-radial ratios of between half and twice the median, the cross-sectional area of cells was conserved, lying in a close interval around the median. This is consistent with the requirement for a minimum cell volume during progression through the cell cycle, as has been demonstrated in yeast (26).
The plane of cell division is correlated with cell shape. In the 1800s, Hofmeister, Errera, and Sachs (1 –3) deduced empirical rules that govern cell wall placement in plant systems (27). These rules were deduced from observation of the final arrangement of cells, after growth, in fixed tissues. Hofmeister’s rule states that new walls form normal to the axis of growth of a cell. We have investigated this relationship in growing Coleochaete, using time-lapse imaging techniques to capture dynamic cell behavior (Figs. 1C and 2 A–D). We have been able to map the orientation of each cell division and measure the size and shape of each cell at the point of nascent cell wall formation. The orientations of new cell walls in Coleochaete are either radial (periclinal) or tangential (anticlinal), and the choice is highly correlated with cell shape (Fig. 2E). Cells that are longer in the radial dimension undergo anticlinal divisions, and cells that are longer in the tangential dimension undergo periclinal divisions.
Fig. 2.

Orientation of cell division during growth. (A–D) Time-course imaging of a calcofluor white stained C. scutata thallus showing the patterns of anticlinal and periclinal cell division planes. Images corresponding to 76 h, 88 h, 100 h, and 124 h of culture are shown. (Scale bar: 50 μm.) Nascent cell walls were highlighted by creating difference maps between consecutive images taken 4 h apart [I = It + 2 × (It + 1 − It)]. (E) Individual cell-division events were identified, the radial (lr) and tangential (lt) dimensions of each cell were measured, and these were plotted. In addition, the observed plane of cell division was used to classify the data (▲, periclinal; □, anticlinal; 394 cells from 20 thalli). Bold lines correspond to constant cross-sectional areas of 0.6× and 1.4× the mean. Dashed lines indicate cell shapes with lr:lt ratios of 1:2, 1:1, and 2:1. The numbers 1 and 2 indicate the positions of periclinal cell divisions, and 3 and 4 indicate the positions of anticlinal divisions, which are illustrated in the legend. (F) Similar distributions of cell division and cell shape were obtained from software models of Coleochaete growth, as described in the text.
The sizes of daughter cells were symmetric in periclinal divisions and asymmetric in anticlinal divisions (with 0.61:0.49 radial size ratio). A simple logistic model can encapsulate this switch between anticlinal and periclinal divisions (Fig. 2F), using a coefficient of asymmetry a and a stochastic parameter s:
P(periclinal) = 1 − P(anticlinal) is the probability of periclinal division. lr and lt are the dimensions of the cell in the radial and tangential directions. The coefficient of asymmetry a (= 0.85) corresponds to the lr:lt ratio at which cells switch from anticlinal to periclinal cell division. It is less than 1 due to asymmetry of the anticlinal cell divisions. Daughter cells at the outer edge of the thallus are smaller than the inner sister cells, and anticlinal division can occur at lower lr values. The parameter s (= 0.055) describes the observed variability of this process and was obtained by fitting the model to experimental data using a downhill simplex algorithm (28) implemented in the python SciPy library (http://www.scipy.org/).
A Cell-Shape Sensing Mechanism Is Sufficient to Coordinate Cell Proliferation.
In previous sections, we described simple biomechanical and geometric rules that can be formulated to describe the division and expansion patterns of individual cells and cell walls in Coleochaete. We have tested whether these rules could explain dynamic behavior at the whole-organism level using finite element models to simulate tissue growth. Tissue cross-sections were modeled as beam structures, where deformation resulted from the interplay of intracellular turgor pressure and viscous cell walls. The cell division model (Eq. 2) was then used to check for individual cell size and determine the placement of new cell walls in the tissue. We have run various growth scenarios where constraints were imposed on the development of the thallus. In each case, simulations showed that a simple shape-sensing mechanism for cell division, embedded into a deformable extracellular matrix, is sufficient to explain a variety of morphogenetic behaviors.
Orientation of the division plane. Different values for the asymmetry coefficient a (Eq. 2; a = 0.8, 1, 1.2, with five simulations for each value of a) and cell dimensions were compared with experimental data. The differences with real cell size were lower with a = 1 (the sum of square error between experimental distribution and simulated distributions were 4.10−7, 6.10−7, and 1.10−6 with a being respectively 1, 1.2, and 0.8) and are consistent with Errera and Sach’s rules. Simulated and measured cell areas and radial-to-tangential length ratios were statistically similar, respectively, P = 0.47 and P = 0.63, two-tailed t test; n = 799). Q–Q plots (Fig. S3 and SI Text) confirmed this result and indicated that most discrepancies occurred at the tails of the distributions.
Bending stiffness. Different values for the moment of inertia of cell walls were used (1.104 μm4, 2.103 μm4, 1.103 μm4, 5.102 μm4) because bending properties can strongly influence the behavior of thin-walled structures (Fig. 3 A–C). Simulations involving gradual decrease of the moment of inertia showed that cell wall bending properties are associated with the regularity of the shape of the tissue. Larger resistance to bending (1.104 μm4) generated symmetrical and circular patterns, as local variations in radial expansion were balanced by bending forces. When the moment of inertia was the lowest (5.102 μm4), branch-like structures emerged. Similar variations in tissue shapes are observed in different Coleochaete species.
Cell ablation. A second type of outgrowth was generated by instances of cell death. Cells in the margin of a thallus could be released from tangential forces by the removal of neighboring cells, which produced a drop in turgor pressure against the side walls. As a consequence, cell expansion became locally isotropic and a secondary outgrowth was formed in computer simulations (Fig. 3 D and E). Later in the simulation, cells at the sides started to limit lateral expansion through the force of contact. Similar phenomena are seen in vivo.
Contact between algae. Contact between two growing thalli was simulated to illustrate mechanical interactions at the organism level. We obtained realistic patterns showing that a larger thallus tends to wrap a smaller specimen as found in vivo (Fig. 3 G–I).
Fig. 3.

The application of simple rules in a biophysical model generated life-like patterns of tissue growth. In a series of numerical simulations using the same set of cell-autonomous rules for cell division, we found that mechanical constraints were sufficient to explain a range of morphogenetic behaviors. (A–C) Cell wall bending properties induce gross morphological changes during simulations of Coleochaete growth. Three simulations with different cell wall bending properties are shown, with moment of inertia values of A: 2.103 μm4, B: 1.103 μm4, and C: 5.102 μm4. When the moment of inertia was high, deformation of individual cell walls was limited. Cells on the margin of the thallus were constrained by neighboring cells, and radial expansion of the tissue was uniform. When the moment of inertia was decreased, individual cells were able to expand at different rates, and irregularities appeared. (D–F) Cell ablation triggers outgrowth. In a software model of Coleochaete growth, two cells on the margin of a thallus were isolated by removal of neighboring cells (D and E). The release of lateral forces resulted in outgrowth. (F) Similar outgrowth of cells was seen in cultured thalli with damaged cells on the margin. (Scale bar: 50 μm.) (G–I) Morphological changes after collision between thalli. The growth of two closely positioned thalli was modeled. The initial condition is shown in G, and H shows the pattern after simulated growth, Competition for space results in a characteristic curved boundary between the different sized thalli. (I) similar patterns are observed among experimentally cultured thalli (Scale bar: 100 μm).
Discussion
Plant Morphogenesis.
Morphogenesis is a cellular process, where cell wall properties, membrane permeability, hydrostatic pressure, cell expansion, and proliferation rates are genetically regulated, but are physically coupled across the system. To properly understand the workings of such complex morphogenetic systems, it is necessary to construct dynamic models that contain an explicit description of these interactions. Though substantial progress has been made in the experimental description of the genetic processes that underlie plant morphogenesis (14, 29), these are often poorly integrated with physical aspects of cellular growth. Current models have focused on patterning processes in plants (13, 15), but have difficulty describing the establishment of biological shapes, because most models fail to consider the physical basis of growth adequately. Plant tissues are biphasic systems where a fluid, maintained under compression, interacts with a closed network of deformable cell walls and impermeable membranes, maintained in tension. We have set out to establish an experimental system that allows improved quantitative modeling of morphogenesis and biological experimentation.
A Simple Experimental System for Quantitative Analysis of Plant Morphogenesis.
We have investigated the use of Coleochaete as a simple system for studying cellular morphogenesis. The simple, reduced morphology of the algae, ease of culture, and ability to undergo vegetative propagation make them an ideal subject for digital imaging and quantitative analysis of morphogenesis. Unique image segmentation methods were developed to enable the extraction of quantitative information from microscopy images and facilitate representation of plant tissues for computer modeling. It was possible to build improved models that contain explicit interactions between the physical and genetic processes of plant cell growth, and that capture some of the emergent properties found during morphogenesis (13, 30).
Molecular tools to manipulate Coleocheate genetically remain limited. However, this work shows that a better integration of quantitative genetic and physical information from living tissues is achievable. The simplicity of the Coleochaete system will allow techniques for genetic marking, live microscopy, image analysis (18), and mechanical manipulation (31) to be combined simultaneously across the whole organism. This type of integrated experimental approach is required for a better understanding of the cellular and genetic dynamics of plant systems.
Improved Models for Plant Cellular Morphogenesis.
Modeling has greatly contributed to our understanding of the genetic and physical processes underlying development (32). Numerous modeling studies of animal and plant systems have been key to emphasize the role of these processes in the regulation of cell proliferation (33, 34), but few have considered the biphasic nature of plant tissues. In early work in the laboratory (17), such models were based on cell wall segments represented as a set of two parallel springs, where the elastic properties of each spring were controlled by the corresponding adjacent cell. However, walls at the junction between two cells consisted of a single subdivision, and this did not allow for cell wall bending. In addition, elasticity merely approximates the physical properties of cell walls, and model parameters cannot be derived easily from experimental data. The system described here has allowed us to overcome these shortcomings and improve the model in two different ways:
We have incorporated a different and more accurate quantitative model for cell wall physics based on a pure viscous model. Experimental observations of the ultrastructure of cell walls (35) and expansion rates after imposition of shifts in turgor (21) favor inelastic models for wall expansion. The parameterization of this model is simple, requiring a viscosity coefficient that can be measured experimentally.
A more accurate numerical description of cell wall segments was added. This allows bending of wall segments and better simulation of more complex behavior, such as bending and twisting of tissues, which are common morphological features in plant development (30). For example, tip growth, e.g., hairs and hyphae, require local changes of cell wall properties (22). In addition, it has been shown that excess growth in marginal regions causes a gradual bending of Antirrhinum leaves (36). Well-established mechanical theories can be used for the modeling of such phenomena. Beam theory (37) and 2D finite element analysis were able to reproduce a variety of morphogenetic behavior. Plate or shell theory could be used with similar techniques to simulate 3D growth (38) and could be coupled to detailed models of cell function (39).
Cell Division Patterns May Be Determined by Cell Shape.
Empirical relationships between cell shape, mechanical force, and direction of growth for the determination of the axis of cell division have been described by early cell biologists (40), but the processes that control the positioning of nascent plant cell walls remain poorly understood (41). However, there is increasingly good characterization of such mechanisms in microbes (42, 43). There is no opportunity for tissue stresses to play a role in the timing or orientation of cell division for single-cell organisms (Fig. 4). The study of minicell mutants of E. coli indicates that feedback regulated interactions between MinC, MinD, and MinE proteins can integrate the spatial properties of the cell interior and form a key for the correct positioning of the septum during cell division (44, 45). All single-cell organisms that maintain a regular morphology must possess some cell-autonomous mechanism for sensing cell shape and size, and therefore regulate division. We have implemented such a scheme in cellular models of Coleocheate. The physical forces produced as a result of cellular growth are instantaneously transmitted across a plant tissue, and this results in the coupling of cell shape and size across growing tissues. The application of simple cell-autonomous rules to govern cell division in the coupled Coleochaete system was sufficient to describe larger scale features of growth, such as coordination of division patterns, outgrowth, and thallus shape.
Fig. 4.
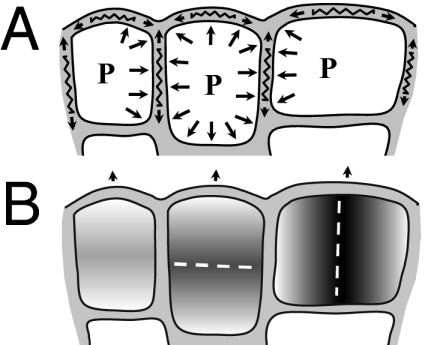
Schematic diagram of cells at the margin of a Coleochaete thallus. (A) Cell expansion is propelled by autonomous changes in turgor pressure (P) and wall softening. However, the extent and direction of growth of an individual cell is constrained by counterforces, which originate from surrounding cells and are transmitted throughout the tissue. (B) Cell-autonomous processes for regulating (i) the timing of division according to cell size and (ii) the plane of cell division according to the shape of the cell are sufficient to account for morphogenesis in Coloechaete.
In both organismal and cellular theories for morphogenesis, some degree of coupling between the genetic system of the plant and the physics of growth is inescapable, and this makes it difficult to discriminate between the two theories. The key to distinguishing between these theories must lie in understanding the precise nature of the coupling between genetic and biophysical processes in living cells. The simplicity of Coleochaete allows a systematic approach to the analysis of plant morphogenesis. We have constructed a unified cellular and biophysical model for growth of Coleochaete, and shown that simple local rules (Fig. 4) can be applied in a cellular automata-like fashion to recapitulate emergent morphogenetic properties during growth. The approach may be applied to higher plants, and simplify the rational design and engineering of plant morphogenesis.
Materials and Methods
Algal Culture and Time-Lapse Imaging.
Specimens were obtained by filtering cultures of Coleochaete scutata (UTEX LB2567) to obtain zoospores and specimens smaller than 40 μm. Specimens were inoculated on Lab-Tek chambered coverglass slides and grown in Bold’s modified basal freshwater nutrient solution (Sigma-Aldrich) at 22° C with continuous light. Thalli were examined using DIC optics on a Leica DMI 6000 B inverted microscope, with 40× dry lens. The walls of living cells were stained using calcofluor white (46) at a concentration of 0.2 μg/mL in the growth medium, and imaged using fluorescence microscopy (A4 filter block; Leica). Time-lapse sequences were captured from 20 specimens in parallel using a computer-controlled robotic stage at 4-h time intervals over several days. Images were captured using a Leica DFC350FX digital camera.
Confocal Microscopy.
Images of fixed Coleochaete scutata thalli were obtained using a Leica TCS SP1 confocal laser scanning microscope, with 40× N.A. 0.8 objective.
Image Segmentation.
We used a marked watershed algorithm (47) for the segmentation of cellular structures. The algorithm was initiated by seeding each cell in the image with a point. The topography was then flooded from below, using each seed as a source. Pixels in the image were progressively grouped into basins that correspond to cell interiors and are separated from each other by higher intensity values that correspond to the labeled cell walls. When the processing was complete, each pixel of the image was associated to at least one initial seed label. Intercellular junctions were defined by contact between at least three basins, and each was assigned a vertex. A wall was defined as a segment between two vertices sharing the same basins. A cell was bounded by walls sharing a common basin.
Finite Element Analysis.
Tissues were represented as networks of 2D Euler Bernoulli beams, defined by vertices at the extremities and midpoint (37). This assumed tissues of constant thickness. Possible effects such as the increase in bending resistance due to orthogonal walls in the third dimension (Table 1) were incorporated as structural properties (e.g., cell wall moment of inertia and cross-section) (48). At each growth increment, a forward-Euler finite difference scheme and the scaled gradient conjugate method was used to solve the system. Interior cells were considered rigid. Initial conditions for circular thalli consisted of a symmetrical arrangement of one cell surrounded by auniform distribution of eight others. Contact between thalli was simulated by production of a diffusible inhibitor that blocks expansion of adjacent specimens (see Table 1 for the input parameters used for the simulation of thallus growth). The numerical model was validated by comparing simulations to the analytical model (SI Text).
Table 1.
List of the parameter values used for simulation of growth in Coleochaete
| Cell properties | Mean |
| Wall cross-section, S | 5 μm2 |
| Moment of Inertia, I* | 5.102–104 μm4 |
| Turgor pressure, P-P0 | 0.5 MPa |
| Viscosity, μ | 12,000 GPa·s |
| Cell cross-section | 400 μm2 |
| Coefficient of asymmetry, a | 0.8–1- 1.2 |
| Stochastic parameter, s | 0.055 |
*Values of the moment of inertia were higher than the estimates based on wall geometry (≈2.10−2) to incorporate the contribution of orthogonal walls which reinforce resistance to bending, similar to reinforcement provided by I beams (48).
Software.
CellModeller software was written in C++ using OpenGL graphics. The user interface was created using the wxPython graphic library (http://www.wxpython.org/) and was bound to the C++ code using SWIG (http://www.swig.org/). The software can be downloaded at http://www.scri.ac.uk/research/epi/resourcecapture/plantmodelling.
Supplementary Material
Acknowledgments
We thank Leica (Cambridge, UK) and Joanne Fallowfield for help with providing computer-controlled inverted microscope with robotic stage, and Prof. Zhigang Zhou for help with the culture of Coleochaete. This research was supported by Biotechnology and Biological Sciences Research Council Grants BBS/B/16720 and BEP/17053.
Footnotes
This article is a PNAS Direct Submission. R.S.Q. is a guest editor invited by the Editorial Board.
The authors declare no conflict of interest.
This article contains supporting information online at www.pnas.org/cgi/content/full/0906322107/DCSupplemental.
References
- 1.Errera L. Uber zellformen und seifenblasen. Bot Centralbl. 1888;34:395–398. [Google Scholar]
- 2.Hofmeister W. Zusätze und berichtigungen zu den 1851 veröffentlichen untersuchungengen der entwicklung höherer krytogamen. Jahrb Wiss Bot. 1863;3:259–293. [Google Scholar]
- 3.Sachs J. Üeber die Anordnung der zellen in jüngsten pflanzentheilen. Arb Bot Inst Wurzburg. 1878;2:46–104. [Google Scholar]
- 4.Thompson DW. On Growth and Form. Dover, New York: 1992. [Google Scholar]
- 5.Schopfer P. 2009. Mechanical signals in Arabidopsis: Stress or strain? Science Online (April 23) Available at http://www.sciencemag.org/cgi/eletters/322/5908/1650#12208. [Google Scholar]
- 6.Green P. Organogenesis—a biophysical view. Annu Rev Plant Physiol. 1980;31:51–82. [Google Scholar]
- 7.Lintilhac PM, Vesecky TB. Stress-induced alignment of division plane in plant tissues grown in vitro. Nature. 1984;307:363–364. [Google Scholar]
- 8.Lynch TM, Lintilhac PM. Mechanical signals in plant development: A new method for single cell studies. Dev Biol. 1997;181:246–256. doi: 10.1006/dbio.1996.8462. [DOI] [PubMed] [Google Scholar]
- 9.Fleming AJ. The coordination of cell division differentiation and morphogenesis in the shoot apical meristem: A perspective. J Exp Bot. 2006;57:25–32. doi: 10.1093/jxb/eri268. [DOI] [PubMed] [Google Scholar]
- 10.Barlow PW, Brain P, Powers SJ. Estimation of directional division frequencies in vascular cambium and in marginal meristematic cells of plants. Cell Prolif. 2002;35:49–68. doi: 10.1046/j.1365-2184.2002.00225.x. [DOI] [PMC free article] [PubMed] [Google Scholar]
- 11.Dumais J, Kwiatkowska D. Analysis of surface growth in shoot apices. Plant J. 2002;31:229–241. doi: 10.1046/j.1365-313x.2001.01350.x. [DOI] [PubMed] [Google Scholar]
- 12.Barbier de Reuille P, Bohn-Courseau I, Godin C, Traas J. A protocol to analyse cellular dynamics during plant development. Plant J. 2005;44:1045–1053. doi: 10.1111/j.1365-313X.2005.02576.x. [DOI] [PubMed] [Google Scholar]
- 13.Jönsson H, Heisler MG, Shapiro BE, Meyerowitz EM, Mjolsness E. An auxin-driven polarized transport model for phyllotaxis. Proc Natl Acad Sci USA. 2006;103(5):1633–1638. doi: 10.1073/pnas.0509839103. [DOI] [PMC free article] [PubMed] [Google Scholar]
- 14.Espinosa-Soto C, Padilla-Longoria P, Alvarez-Buylla ER. A gene regulatory network model for cell-fate determination during Arabidopsis flower development that is robust and recovers experimental gene expression profiles. Plant Cell. 2004;16:2923–2939. doi: 10.1105/tpc.104.021725. [DOI] [PMC free article] [PubMed] [Google Scholar]
- 15.Roland-Lagan A-G, Prusinkiewicz P. Reviewing models of auxin canalization in the context of leaf vein pattern formation in Arabidopsis. Plant J. 2005;44:854–865. doi: 10.1111/j.1365-313X.2005.02581.x. [DOI] [PubMed] [Google Scholar]
- 16.Korn R. A stochastic approach to the development of Coleocheate. . J Theor Biol. 1969;24:147–158. doi: 10.1016/s0022-5193(69)80042-1. [DOI] [PubMed] [Google Scholar]
- 17.Rudge T, Haseloff J. European Conference on Advances in Artificial Life. Berlin: Springer; 2005. A computational model of cellular morphogenesis in plants; pp. 78–87. [Google Scholar]
- 18.Haseloff J. Old botanical techniques for new microscopes. Biotechniques. 2003;34:1174–1182. doi: 10.2144/03346bi01. [DOI] [PubMed] [Google Scholar]
- 19.Pringsheim C. Beiträge zur morphologie und systematik der algen. Jahrb Wiss Bot. 1860;2:1–38. [Google Scholar]
- 20.Cook ME. Cytokinesis in Coleochaete orbicularis (Charophyceae): An ancestral mechanism inherited by plants. Am J Bot. 2004;91:313–320. doi: 10.3732/ajb.91.3.313. [DOI] [PubMed] [Google Scholar]
- 21.Green P, B, Erickson RO, Buggy J. Metabolic and physical control of cell elongation rate. Plant Physiol. 1971;47:423–430. doi: 10.1104/pp.47.3.423. [DOI] [PMC free article] [PubMed] [Google Scholar]
- 22.Dumais J, Shaw SL, Steele CR, Long SR, Ray PM. An anisotropic-viscoplastic model of plant cell morphogenesis by tip growth. Int J Dev Biol. 2006;50:209–222. doi: 10.1387/ijdb.052066jd. [DOI] [PubMed] [Google Scholar]
- 23.Rezvani Moghaddam P, Wilman D. Cell wall thickness and cell dimensions in plant parts of eight forage species. J Agric Sci. 1998;131:59–67. [Google Scholar]
- 24.Raven JA. The energetics of freshwater algae: Energy requirements for biosynthesis and volume regulation. New Phytol. 1982;92:1–20. [Google Scholar]
- 25.Martin CE, Lin TC, Lin KC, Hsu CC, Chiou WL. Causes and consequences of high osmotic potentials in epiphytic higher plants. J Plant Physiol. 2004;161:1119–1124. doi: 10.1016/j.jplph.2004.01.008. [DOI] [PubMed] [Google Scholar]
- 26.Tyson JJ, Hannsgen KB. The distribution of cell size and generation time in a model of cell cycle incorporating size control and random transitions. J Theor Biol. 1986;113:29–62. doi: 10.1016/s0022-5193(85)80074-6. [DOI] [PubMed] [Google Scholar]
- 27.Smith LG. Plant cell division: Building walls in the right places. Nat Rev Mol Cell Biol. 2001;2:33–39. doi: 10.1038/35048050. [DOI] [PubMed] [Google Scholar]
- 28.Avriel M. Nonlinear Programming: Analysis and Methods. New York: Dover; 2003. [Google Scholar]
- 29.Kramer EM. PIN and AUX/LAC proteins: Their role in auxin accumulation. Trends Plant Sci. 2004;9:578–582. doi: 10.1016/j.tplants.2004.10.010. [DOI] [PubMed] [Google Scholar]
- 30.Coen E, Rolland-Lagan A-G, Matthews M, Bangham AJ, Prusinkiewicz P. The genetics of geometry. Proc Natl Acad Sci USA. 2004;101:4728–4735. doi: 10.1073/pnas.0306308101. [DOI] [PMC free article] [PubMed] [Google Scholar]
- 31.Geitmann A. Experimental approaches used to quantify physical parameters at cellular and subcellular levels. Am J Bot. 2006;93:1380–1390. doi: 10.3732/ajb.93.10.1380. [DOI] [PubMed] [Google Scholar]
- 32.Prusinkiewicz P, Lindenmayer A. The Algorithmic Beauty of Plants. New York: Springer; 1990. [Google Scholar]
- 33.Corson F, et al. Turning a plant tissue into a living cell froth through isotropic growth. Proc Natl Acad Sci USA. 2009;106:8453–8458. doi: 10.1073/pnas.0812493106. [DOI] [PMC free article] [PubMed] [Google Scholar]
- 34.Hufnagel L, Teleman AA, Rouault H, Cohen SM, Shraiman BI. On the mechanism of wing size determination in fly development. Proc Natl Acad Sci USA. 2007;104:3835–3840. doi: 10.1073/pnas.0607134104. [DOI] [PMC free article] [PubMed] [Google Scholar]
- 35.Taiz L. Plant cell expansion: Regulation of cell wall mechanical properties. Annu Rev Plant Physiol. 1984;35:585–657. [Google Scholar]
- 36.Nath U, Crawford BCW, Carpenter R, Coen E. Genetic control of surface curvature. Science. 2003;299:1404–1407. doi: 10.1126/science.1079354. [DOI] [PubMed] [Google Scholar]
- 37.Zienkiewicz OC, Taylor RL. The Finite Element Method. London: McGraw-Hill; 1998. [Google Scholar]
- 38.Nelson CM, et al. Emergent patterns of growth controlled by multicellular form and mechanics. Proc Natl Acad Sci USA. 2005;102:11594–11599. doi: 10.1073/pnas.0502575102. [DOI] [PMC free article] [PubMed] [Google Scholar]
- 39.Dupuy L, Mackenzie J, Rudge T, Haseloff J. A system for modelling cell–cell interactions during plant morphogenesis. Ann Bot (Lond) 2008;101:1255–1265. doi: 10.1093/aob/mcm235. [DOI] [PMC free article] [PubMed] [Google Scholar]
- 40.Théry M, Bornens M. Cell shape and cell division. Curr Opin Cell Biol. 2006;18:648–657. doi: 10.1016/j.ceb.2006.10.001. [DOI] [PubMed] [Google Scholar]
- 41.Lloyd C, Buschmann H. Plant division: Remembering where to build the wall. Curr Biol. 2007;17:R1053–R1055. doi: 10.1016/j.cub.2007.10.032. [DOI] [PubMed] [Google Scholar]
- 42.Rothfield L, Taghbalout A, Shih Y-L. Spatial control of bacterial division-site placement. Nat Rev Microbiol. 2005;3:959–968. doi: 10.1038/nrmicro1290. [DOI] [PubMed] [Google Scholar]
- 43.Loose M, Fischer-Friedrich E, Ries J, Kruse K, Schwille P. Spatial regulators for bacterial cell division self-organize into surface waves in vitro. Science. 2008;320:789–792. doi: 10.1126/science.1154413. [DOI] [PubMed] [Google Scholar]
- 44.Kerr RA, Levine H, Sejnowski TJ, Rappel W-J. Division accuracy in a stochastic model of Min oscillations in Escherichia coli . Proc Natl Acad Sci USA. 2006;103:347–352. doi: 10.1073/pnas.0505825102. [DOI] [PMC free article] [PubMed] [Google Scholar]
- 45.Meinhardt H, de Boer PAJ. Pattern formation in Escherichia coli: A model for the pole-to-pole oscillations of Min proteins and the localization of the division site. Proc Natl Acad Sci USA. 2001;98:14202–14207. doi: 10.1073/pnas.251216598. [DOI] [PMC free article] [PubMed] [Google Scholar]
- 46.Hoch HC, Galvani CD, Szarowski DH, Turner JN. Two new fluorescent dyes applicable for visualisation of fungal cell walls. Mycologia. 2005;97:580–588. doi: 10.3852/mycologia.97.3.580. [DOI] [PubMed] [Google Scholar]
- 47.Sonka M, Hlavac V, Boyle R. Image Processing, Image Analysis and Machine Vision. Boston: PWS; 1998. [Google Scholar]
- 48.Case J, Chilver H, Ross CTF. The Strength of Materials and Structures. London: Arnold; 1999. [Google Scholar]
Associated Data
This section collects any data citations, data availability statements, or supplementary materials included in this article.