

Abstract
A basic property of life is its capacity to experience Darwinian evolution. The replicator concept is at the core of genetics-first theories of the origin of life, which suggest that self-replicating oligonucleotides or their similar ancestors may have been the first “living” systems and may have led to the evolution of an RNA world. But problems with the nonenzymatic synthesis of biopolymers and the origin of template replication have spurred the alternative metabolism-first scenario, where self-reproducing and evolving proto-metabolic networks are assumed to have predated self-replicating genes. Recent theoretical work shows that “compositional genomes” (i.e., the counts of different molecular species in an assembly) are able to propagate compositional information and can provide a setup on which natural selection acts. Accordingly, if we stick to the notion of replicator as an entity that passes on its structure largely intact in successive replications, those macromolecular aggregates could be dubbed “ensemble replicators” (composomes) and quite different from the more familiar genes and memes. In sharp contrast with template-dependent replication dynamics, we demonstrate here that replication of compositional information is so inaccurate that fitter compositional genomes cannot be maintained by selection and, therefore, the system lacks evolvability (i.e., it cannot substantially depart from the asymptotic steady-state solution already built-in in the dynamical equations). We conclude that this fundamental limitation of ensemble replicators cautions against metabolism-first theories of the origin of life, although ancient metabolic systems could have provided a stable habitat within which polymer replicators later evolved.
Keywords: autocatalysis, graded autocatalysis replication domain model, units of evolution
Once beyond the abiogenic synthesis and accumulation of a variety of complex organic compounds on Earth took place (1), the conceivable paths toward life’s emergence have been dominated by two fundamentally different views in origin-of-life research: the genetics- or replication-first approach (2), and the metabolism-first scenario (3). Both schools acknowledge that a critical requirement for primitive evolvable systems (in the Darwinian sense) is to solve the problems of information storage and reliable information transmission (4, 5). Disagreement starts, however, in the way information was first stored. All present life is based on digitally encoded information in polynucleotide strings, but difficulties with the de novo appearance of oligonucleotides and clear-cut routes to an RNA world (but see ref. 6), wherein RNA molecules had the dual role of catalysts and information storage systems (7, 8), have provided continuous fuel for objections to the genetics-first scenario (9, 10).
As emphasized by Kauffman (11), metabolism-first theories suggest that life, in a deep sense, crystallized as a collective self-reproducing metabolism in a space of possible organic reactions. A critical property of such systems must be the capacity for robust self-maintenance, but problems arise when considering side reactions that may deplete certain reactants (12) and dynamical aspects of autocatalytic cycles if they are assumed to coexist in abstract space (13). Even if we ignore such hurdles, the key question still remains: Was a network of chemical reactions able to increase in complexity and eventually undergo Darwinian selection as assumed by their advocates? A basic condition for any nascent Darwinian process in a population of self-reproducing systems is that they must have a sort of hereditary transmission which requires, in turn, becoming familiar with a lesser-known and absolutely different form of replication than the well-known template-dependent replication: ensemble replication of molecular networks (12). So far, the strongest support for such a possible scenario comes from theoretical work carried out by Doron Lancet and collaborators (14 –16). They have proposed the thoughtful graded autocatalysis replication domain (GARD) model (which utilizes chemical kinetics to simulate the behavior of mutually catalytic sets) as an alternative to alphabet-based inheritance. A basic feature in GARD is that noncovalent, micelle-like molecular assemblies capable of growing homeostatically (i.e., buffered enough as to maintain stability) according to the assembly’s constitution store compositional information that can be propagated after occasional fission (i.e., assembly splitting).
Here we analyze the putative evolvability of those macromolecular aggregates dubbed “ensemble replicators.” The chief reason for our undertaking is that such compositional genomes (composomes) apparently fulfill the required conditions as to be considered units of evolution (17), thus suggesting a pathway from pre-Darwinian dynamics to a minimal protocell. The remainder of the paper is organized as follows. First, we provide the background of the GARD model. Then, we derive an Eigen equation that allows analyzing the deterministic dynamics of the growth-splitting process in GARD and investigate the mechanisms behind the observed quasistationary compositional genomes. Finally, we describe the results from computer simulations and discuss the implications of our findings in relation to the genetics- or metabolism-first scenarios of the origin of life.
Background
The GARD model was originally based on computer simulations using Gillespie’s algorithm (18, 19) for chemical reactions and intended to provide a quantitative tool for detailed analyses of inheritance without information-carrying polymers. It involves discrete stochastic changes in noncovalent assemblies dictated by the differential equations
 |
where  is an
is an 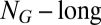 vector;
  is the molecular repertoire of environmentally available prebiotic compounds;
  is the external concentration of molecular species i;
  and
and 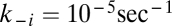 are uncatalyzed forward and backward rate constants assumed to be equal for all molecules for simplicity [they differ in their mutual rate enhancement properties (14)];
  is the assembly size given by
  , with
  indicating the count of molecular species i (i.e., the internal molecular counts of vector
  are
are 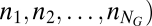 and
and  is an element of the
  positive matrix that defines the network of mutually catalytic interactions governed by a statistical formalism (see below). Given two compositional assemblies
  and
and  , their degree of similarity is defined as the scalar product
 |
where and
and  are Euclidian norms (
 represents perfect similarity, and
  indicates orthogonality). The reason for assuming
  is that information transfer becomes trivial for large assemblies (15).
At time t, a GARD assembly contains a subrepertoire of molecular types out of  , and the time-dependent trajectory of the composition vector
  is dictated by Eq. 1. At
  equilibrium sets in, and
  represents the asymptotic steady-state solution of Eq. 1 reached by an assembly that forms and expands indefinitely with unlimited supply of all molecular species
  . A nontrivial behavior is obtained when a GARD assembly goes through a growth-splitting process, somewhat mimicking the expansion of a growing vesicle that first retains spherical shape, then is distorted to a dumbbell, and eventually allocates each molecule to each of two daughter assemblies with 50% probability. Fission is assumed to happen when the size of the assembly (
 ) reaches a threshold value; this process keeps the assemblies out of equilibrium, and quasistationary compositions (composomes) may arise. Compositional information is transferred to a daughter assembly only if the elements of the
  matrix are drawn from a log-normal distribution, rather than a normal (Gaussian) distribution: In the latter case, there is no compositional inheritance (15). In contrast to Gaussian distribution, the log-normal distribution has a longer tail, representing the higher frequencies of greater mutually catalytic interactions when plotted in the original scale without taking the logarithm. The log-normal distribution is an approximation of the receptor affinity distribution (20, 21) modified for catalytic rate enhancement (15).
Results and Discussion
An Eigen Equation for the GARD Model.
The difficulty in studying the deterministic dynamics of the motivating growth-splitting process in the GARD model is that, in principle, one is faced with a vast array of possible compositions of any size from a repertoire of  environmentally available molecules. Therefore, we have limited ourselves to a small collection of
  different molecular species and considered assemblies of size
  that were allowed to grow up following Eq. 1 until their size reached
  , after which they divided exactly into two halves. But we emphasize that the mathematical construction presented here can in principle deal with assemblies of any size.
GARD assemblies were characterized as 10-long vectors and distinguished by their initial composition of  molecules. An exact solution to the replication-mutation equilibrium distribution of all possible
  assemblies (a total of 220 under our characterization) can be obtained by constructing an Eigen (4) equation,
where  (with prime for time derivation) is the density of assembly
  ;
;  is a self-reproduction term; and
  is the mutation rate from
  to
to  (i.e., the fraction of growth-splitting processes leading to the kth daughter assembly from parental l). The rate of exact self-reproduction arises as the sum of all processes that after growth and splitting give rise to the same assembly that we started with.
The overall excess productivity
is built-in so as to ensure that
In short, we are explicitly dealing here with compositional space in which for any assembly  with initial size
  all accessible daughter assemblies of the same size are calculated. Death rates were not incorporated and empty assemblies were avoided by allowing splitting of assemblies into two offspring of equal size but otherwise random composition (sampling without replacement). These assumptions do not, however, hamper the conclusions obtainable by the analysis of the system.
Eqs. 3–5 can be written in matrix form as
where the off-diagonal elements ( ) of the fitness matrix
  stand for net mutant reproduction, and the diagonal elements (
 ) are the net growth rates for exact self-reproduction; and
  is a diagonal matrix with specific entries
  . Analytical solutions to Eq. 6 are known (22, 23). A dominant quasispecies (24) emerges as a positive eigenvector (associated with the largest eigenvalue) which, in normalized form, gives the frequency distribution of the stationary population of compositional assemblies meaning coexistence of all types, the only condition being that
  is irreducible. This is guaranteed by the fact that the off-diagonal elements are necessarily greater than zero in our case because each growing assembly can eventually split and give rise (mutate) to a different daughter assembly.
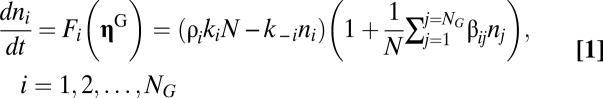
A striking feature of the fitness matrix  in Eq. 6 is that many off-diagonal elements can be as large, or even larger, than the diagonal elements (Fig. 1). This remarkable pattern is due to the directions of growth given by the log-normal distribution of mutually catalytic interactions in the
  matrix and the splitting process. Let us consider, for instance, compositional assembly 94 in Fig. 1 (i.e.,
  ), which is here the first in the rank-order distribution of replication-mutation equilibrium frequencies or, to follow the standard categorization, the most frequent composome (information on the 10-long vector assemblies ranked according to equilibrium frequency is shown in SI Section A). The values that lead to the increase in frequency of this composome tend to be very high through almost all of the range, something that can be better appreciated in the density plot of the
  matrix shown in the inset plot of Fig. 1. Thus, compositional assemblies

 , and
, and  whose ranks are, in order, third, fourth, fifth, and sixth are highly connected to
  by growth-mutation rates as to provide a large outflow toward the increasing of the equilibrium frequency of this leading composome (even larger than the self-replication inflow of
  !). In contrast, the second composome in rank
  basically receives inflow from its relatively high self-replication accuracy, even though it also provides outflow toward other compositional assemblies such as
  , which ranked seventh. The symmetrical matrix of pairwise similarities
  of the first 50 ranked compositional assemblies indicates that the first 20 in the ranking have relatively high similarity.
Fig. 1.

Three-dimensional plot of Eigen's fitness matrix  in Eq. 6. GARD assemblies were characterized as 10-long vectors and distinguished by their initial composition of
  molecules (
 ). The values for the forward and backward rate constants as described by Eq. 1 with
  were
were  and
and  (i.e., we have neglected decay of assemblies), respectively. The elements of the
  matrix for the catalytic enhancement factors were sampled from a log-normal distribution with parameters
  and
and  as in ref. 14. As a legacy, the elements in the
  matrix (
 ) have mean 18,157.3 and variance
  , and some off-diagonal elements can be as large, or even larger, than the diagonal elements. The inset plot shows the particular distribution for row 94; that is, the values that lead to the increase in frequency of the most frequent composome
  (SI Section A). The highest peaks are in the distribution range between compositional assemblies
  and
and  , which means that the outflow from these compositions to the equilibrium frequency of the leading composome is greater than the bona fide replication of the leading composome itself.
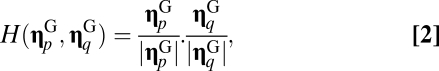
The foregoing analytical approach using Eigen’s equations helps to explain the crucial dynamical behavior of the GARD system, which was originally based on a molecular repertoire of environmentally available prebiotic compounds set to  : the emergence of the so-called compositional correlation carpet that results when plotting the time-correlation matrix of H values (Eq. 2) between compositional vectors at different points in time (14). Abrupt mutational transitions from one composome to another are observed during the time-dependent progression of a particular assembly undergoing growth-splitting processes.
The quasispecies was originally defined for macromolecular populations (24), later on extended to quasispecies of compartments with internal competition (i.e., the stochastic corrector model) (25, 26), and here we face a quasispecies of compositional assemblies as described by the GARD model. A major difference between the original quasispecies and the composome model consists of the structure of the matrix  . In the classical, sequence-based model
  , where
  is a diagonal matrix of replication rate parameters and
  is the mutation matrix. In the case of template-induced replication,
  has a definite structure imposed by sequence space in the sense that for any mutation rate
  the one-error mutants are more frequent than the two-error mutants, and so forth (27). This structure is essential for evolution and the properties of the quasispecies. Such a structure is missing in the population of compositional assemblies. We show next that GARD dynamics is a simple consequence of the hidden compartmentalization already present in the
  matrix that defines the network of mutually catalytic interactions in Eq. 1.
Hidden Compartmentalization in the  Matrix.
The emergence of quasistationary states (QSSs) in the GARD model can be easily understood from the graph-theoretical compartmentalization of the matrix of mutual rate enhance parameters (SI Section C). The  values define the incorporation of molecular species
  in the growing assembly catalyzed by the standing molecular species
  , and were drawn from a log-normal distribution (14, 15). It follows that all
  , which implies that all molecules belong to the same compartment by definition and this compartment is expected to act as one system, even if abrupt transitions between QSSs appear. We found a hidden quasicompartmentalization of the molecular interactions. The quasicompartments are formed where the few large
  values fall (Fig. 2; if sampled from a normal distribution the
  values would be more equal, which would weaken or nullify such quasicompartmentalization). We confronted this quasicompartmentalization structure with the QSSs of the dynamical simulation where three different composomes (A, B, and C) persist (Fig. 3). The molecular composition of dominant composomes follows the composition of quasicompartments: Compartments 17 and 11 dominate composomes B and C, and compartment 20 makes up composome A along with members of two other compartments (Fig. 4). We conclude that heredity is the result of hidden quasicompartmentalization, which in turn is the result of log-normal distribution of
  values. Dominant composomes frequently turn into each other and back. This is because composomes always contain members of different compartments, and random splitting determines which strongly catalyzing molecules remain in the composition.
Fig. 2.

The quasicompartmentalization of the  matrices of molecular repertoires (A)
  and (B)
  . Nodes marked with the same color belong to the same quasicompartment. The widths of links correspond to the interaction strength. For the large
  matrix (B), only interactions stronger than
  are shown for simplicity. Quasicompartments are formed where the few large
  values from a log-normal distribution fall. The figure was drawn using NetDraw (42).
Fig. 3.

The time-correlation matrix of  values (Eq. 2) along 54 generations derived from computer simulations of the GARD model using the
  matrix in Fig. 2B. Only individuals before splitting are included in the analysis. Purple squares mark QSSs where three different composomes (A, B, and C) persist.
Fig. 4.

Similarity of composomes to quasicompartments for 54 generations. Only individuals before splitting are included in the analysis. Similarity is calculated as the proportion of molecules within a composome that belong to each dominant quasicompartment. A, B, and C mark the three different composomes in Fig. 3; 8, 11, 12, 17, and 20 mark the five different quasicompartments. Similarity for the other 23 compartments remained low and therefore is not shown.
It is critically important to have a clear understanding of the hidden compartmentalization in the system because it allows extrapolating what will happen with a larger repertoire of environmentally available prebiotic compounds. With  molecular species the biggest
  value was
  (link 84–55 in Fig. 3, point B), but a simple consideration of the sampling probability of even bigger numbers with increasing
  already suggests that new dominant catalytic rates will arise; that is, the strongest links will simply shift toward the highest values without qualitatively changing the dynamics of the GARD model as long as assembly size
  is kept within the appropriate boundaries given its dependence with
  for faithful compositional inheritance (15).
(Non-)Darwinian Dynamics of Compositional Assemblies.
To study the putative Darwinian evolution of compositional assemblies (14, 28), what has to be done is to integrate selection coefficients in the GARD kinetic model for the catalyzed growth of assemblies (Eq. 1) within the Eigen framework of replication-mutation dynamics expressed by Eq. 6. The most straightforward way of doing this is to multiply the growth rate in the Eigen equation of assemblies by  , where
  symbolizes the fitness gain and
  the degree of similarity to the target as defined by Eq. 2. This formalism somewhat captures what is standard in selection experiments and basically enhances the corresponding
  parameters.
Two different situations were considered. In the first case, the frequency of the assembly chosen as the target for selection (i.e.,  ) was at low replication-mutation equilibrium in the background distribution without imposing selection in the GARD kinetic model and, therefore, it ranked 196th out of 220 (SI Section A). In the second case the target for selection was assembly
  , which ranked fifth. In both cases in point the chosen fitness gain for the target assembly was the same.
For the first scenario, the new dominant eigenvalue (i.e., the fitness of the quasispecies of compositional assemblies) associated with the dominant eigenvector in Eigen’s equations was of course larger than in the background case, but marginally so: The ratio between new and background eigenvalues or, in other words, the relative selective advantage of the new population was 1.00715. The increase in frequency of  relative to its background frequency was 20.6%. When all possible assemblies are considered, some slight relative increases and decreases in their replication-mutation equilibrium frequencies are detected, but the effects are so minor that it is hard to think of any evolutionary relevance. This is clearly concluded by analyzing the ranking changes of the new assemblies as a function of the similarity H to the target:
  (
( ) stepped forward only a few steps when compared to the background ranking and, therefore, still remained at the tail of the distribution.
The results for the second scenario, where the target is a high-ranking compositional assembly, were somewhat different. The new eigenvalue was 1.24071 times the background one. The relative increase in frequency of  was 3.6%, but the frequency of the dominant composome in the background situation (i.e.,
  ) also increased due to its dynamical coupling to the target (see above). Furthermore, the ranking positions of the first 24 compositional assemblies in the background case remained exactly the same. It seems, therefore, that imposing Darwinian selection to the GARD model has, at most, negligible effects on the background distribution defined by the asymptotic steady-state solution already built-in in the dynamical Eq. 1.
We also carried out stochastic implementations (14) mimicking the preceding analytical scenarios. After integrating selection coefficients in the GARD model by using two different assemblies as the target (i.e., at low or relatively high background equilibrium frequencies), some minor differences were observed. These were only statistically significant for the scenario where the target was a relatively high ranking compositional assembly (i.e.,  ). However, the selection effects were minor and quantitative rather than qualitative: The ranking positions of the dominant or most frequent compositional assemblies basically remained the same in all situations (SI Section B).
Population Dynamics of Compositional Assemblies.
A potential drawback of considering a small repertoire  to deterministically studying the dynamics of the growth-splitting process is that we might have explored a relatively minute range of evolvable compositional information and, therefore, our former claim that the GARD model lacks evolvability could be open to strong criticisms (but see above). Here we generalize the original GARD model with a larger repertoire of environmentally available prebiotic compounds to a population of compositions subjected to Darwinian selection.
We considered a molecular repertoire  . The problem now lies in the difficulty of assigning a rank order to all possible compositions as has been done above, so we have proceeded as follows. Following Segré et al. (14), the key property of time-dependent compositional correlation of a GARD system subjected to growth-splitting cycles was statistically investigated. An initial random vector was allowed to grow from
  to
to  before random splitting, and the process was continued for 2,000 time steps (delay time from
  to
to  was 40). From this point on, we followed the time-dependent change in the concentration of each molecular species for an additional number of 16,000 time steps, which was apparently sufficient for convergence to the late-time stationary distribution (SI Section D). A principal component analysis (PCA) (29) of the covariance matrix of molecular concentrations was performed, which allows assessing the dimensionality and main patterns of the time-dependent compositional variation. The higher eigenvalues correspond to compositions that recur in the time-dependent dynamics (the first 5 PCs explain 96.6% of the total variance), whereas eigenvalues near zero correspond to linear relationships between the compositions of the vesicles that are hard to access or are not accessible at all. In other words, the entries in the
  matrix impose strong constraints to the number of accessible dimensions in compositional space. A practical consequence is that any composition whose eigenvalue is close to 0 cannot be chosen as a target for selection because the assembly will simply not move in that direction. Not necessarily because the system lacks evolvability, but because it represents an absolute constraint.
The putative evolvability of the GARD system was now studied by comparing the time-dependent dynamics of the basic kinetic model with the time-dependent dynamics assuming a target composition. We considered a population of K = 1500 assemblies. In each time step, a randomly chosen assembly from the whole population is selected for growing proportional to fitness (i.e., similarity to the target) and the assembly is turned back to the population whenever its size is less than  and the step ends. If, however, size reaches
  then the assembly is randomly divided into two daughter assemblies. One offspring replaces the parent assembly and the other a randomly chosen one from the population. Our protocol is, therefore, based on the classical Moran (30) process. In this stochastic process, the total number of assemblies remains constant and given by K, but the assembly’s size can fluctuate between
  and
and  . The numerical results can be easily summarized as follows: No matter what composition is chosen as the target (i.e., from PC1 to PC10; amounting to 99.7% of the total variance), the characteristic time-dependent trajectory of a population of molecular assemblies is almost identical to the background dynamics defined by Eq. 1. In all cases the average similarity
  (Eq. 2) to the steady-state solution
  remained basically unchanged, and the similarity between any two coexisting assemblies was
  as an average and close to the 95% percentile (0.416) of a null distribution of
  values.
The results can be easily understood from our analysis of the hidden compartmentalization in the  matrix above. Relatively small perturbations of some elements will only have minor consequences in the quasicompartmentalization structure, although in some circumstances it could be possible to modify the widths of links corresponding to the interaction strength between compartments (Fig. 2). In such situations the GARD system might appear to somewhat respond to “natural selection,” but flipping among already predefined quasicompartments is a long way from claiming that the molecular aggregates are capable of “open-ended” evolution (31). Although dominant composomes undergo self-replication and mutation-like changes, their composition is fully dictated by the
  values, and the many interactions with intermediate strength among potentially dominant composomes ensure a high mutation rate. Therefore, compositional genomes offer an excellent example of David Hull’s remark (32): “Replication by itself is sufficient for evolution of sorts, but not evolution through natural selection.”
Our analysis has been contrasted to mimic well-known theoretical and experimental selective scenarios in studies of RNA evolution (33). There, fitness is assigned so that sequences closer to the target in Hamming distance or in phenotype space have higher values than others. For a similar analysis, we decided to do the same in compositional space. The complication is that in this space a large part of the fitness is determined by the underlying structure in a deterministic fashion with very large potential differences from assembly to assembly. Of course, one can assume that the whole population is put into a different environment, which will change by well-known chemical effects the complete  matrix and hence the equilibrium frequencies of assemblies in the population. Note that any chemical network will react in some way under such a perturbation, which is just change or nonevolutionary adaptation. Changes in reversible chemical systems, described by the Le Châtelier-Braun principle (i.e., if a chemical system at equilibrium experiences a change in concentration, temperature, volume, or partial pressure, then the equilibrium shifts to counteract the imposed change), form important aspects of homeostasis in living systems (this principle carries over to open systems as well in some form), but should not be confused by naturally selected hereditary adaptations that sit on top of these universal (freely given) mechanisms. What we show is that there is not much room for the latter, while not denying ample room for the former.
Conclusions
There is always a danger in using terms that acquire implicit theoretical content as, for example, the term evolution that in biology is normally used to mean Darwin’s theory of evolution by natural selection, usually incorporating the contributions of population genetics. Restricting ourselves to this usage of the word “evolution,” the computed population dynamics of growing noncovalent molecular assemblies that undergo splitting when a critical size is reached clearly illustrates that compositional assemblies do not evolve. Previous concerns rightly pointed to their limited hereditary potential (12). By this it was meant that the number of possible types is smaller than the number of individuals and, hence, evolution does not discover novelties in an open-ended manner: All types can be sampled and selected for or against in finite time (34). Note, however, that open-endedness is based on the appropriate combinatorial properties of the generative system in question (for the origin of life it is chemistry), which does not imply selectability: Large chemical systems may be open-ended without evolving and, conversely, systems with limited heredity could potentially evolve without being open-ended. The population (limited heredity narrative unfolds) can revisit previous states randomly or driven by a limit cycle, depending on parameters such as population size, selective values, and mutation rates. But we have shown here that even this tale can hardly be applied to compositional assemblies simply because terms like “selective values” are devoid of meaning in this context. The unfortunate usage of words with clear Darwinian connotations—such as adaptation, fitness landscape, and coevolution (28, 35, 36)—in the realm of pre-Darwinian systems cannot be overemphasized.
A relevant problem is what more complicated chemistry could do to such nonmacromolecular, potentially hereditary systems. We think that the real question is that of the organization of chemical networks. If (and what a big IF) there can be in the same environment distinct, organizationally different, alternative autocatalytic cycles/networks, as imagined for example by Gánti (37) and Wächtershäuser (38, 39), then these can also compete with each other and undergo some Darwinian evolution. But, even if such systems exist(-ed), they would in all probability have limited heredity only (cf ref. 34) and thus could not undergo open-ended evolution. Note that the conditions “distinct, organizationally different, alternative” have been shown to apply only to a very limited extent in the GARD model.
We do not know how the transition to digitally encoded information has happened in the originally inanimate world; that is, we do not know where the RNA world might have come from, but there are strong reasons to believe that it had existed. Template-free systems like composomes could only have had the limited role of accumulating prebiotic material and increasing environmental patchiness. One can enlarge by various means the chemical generativity of GARD-like systems (40) without cracking the problem of the origin of unlimited heredity. It should also be said that, although in the ordinary differential equations, infinite-size populations, both in the GARD as well as the sequential quasispecies models, naturally settle down to a unique equilibrium, in realistic scenarios the evolution of sequences is open-ended as a result of finite population size, the practically infinite size of sequence space, and the structure of the fitness landscape (see, e.g., ref. 33).
It is remarkable that in 1971 Eigen discarded the autocatalytic sets of proteins because they lack inheritance; that is, a mutant protein introduced by chance (by a production error) cannot be systematically reproduced when it is lost, whereas a polynucleotide mutant can always be replicated from the mutant template (4). We now feel compelled to abandon compositional inheritance as a jumping board toward real units of evolution. Hogeweg (41) distinguished between attractor-based and storage-based inheritance, where the latter category clearly refers to gene-based systems. We concur that this distinction is crucial in analyzing quasibiological systems. The essence of nucleic acids from the point of view of inheritance is exactly that they can store a lot of information at roughly equal energy/stability levels, exactly the property one requires from “storage.” Information in attractor-based systems crucially depends on the limited number of alternative stable states, as exemplified by our analysis of the GARD model.
Supplementary Material
Acknowledgments
We thank Doron Lancet and his group for several clarifications on the GARD model, and three anonymous reviewers for constructive comments. V.V. and E.S. are supported by the National Office for Research and Technology (NAP 2005/KCKHA005) and by the National Scientific Research Fund (OTKA 73047). M.S. is supported by grants CGL2009-12912-C03-01 from the Ministerio de Ciencia e Innovación, and 2009SGR 636 from Generalitat de Catalunya to the Grup de Biologia Evolutiva. E.S. and M.S. are supported by funding from the Integrating Cooperation Research Across Europe Project under the Sixth Research Framework Programme of the European Union. The research leading to these results has received funding from the European Community’s Seventh Framework Programme (FP7/2007-2013) under Grant Agreement 225167. Support by the COST D27 action (prebiotic chemistry and early evolution), COST CM0703 (systems chemistry), and Edward Teller Program (NAP2) are also gratefully acknowledged.
Footnotes
The authors declare no conflict of interest.
This article is a PNAS Direct Submission.
This article contains supporting information online at www.pnas.org/cgi/content/full/0912628107/DCSupplemental.
References
- 1.Chen QW, Chen CL. The role of inorganic compounds in the prebiotic synthesis of organic molecules. Curr Org Chem. 2005;9:989–998. [Google Scholar]
- 2.Orgel LE. Prebiotic chemistry and the origin of the RNA world. Crit Rev Biochem Mol Biol. 2004;39:99–123. doi: 10.1080/10409230490460765. [DOI] [PubMed] [Google Scholar]
- 3.Anet FA. The place of metabolism in the origin of life. Curr Opin Chem Biol. 2004;8:654–659. doi: 10.1016/j.cbpa.2004.10.005. [DOI] [PubMed] [Google Scholar]
- 4.Eigen M. Selforganization of matter and the evolution of biological macromolecules. Naturwissenschaften. 1971;58:465–523. doi: 10.1007/BF00623322. [DOI] [PubMed] [Google Scholar]
- 5.Kun Á, Santos M, Szathmáry E. Real ribozymes suggest a relaxed error threshold. Nat Genet. 2005;37:1008–1011. doi: 10.1038/ng1621. [DOI] [PubMed] [Google Scholar]
- 6.Powner MW, Gerland B, Sutherland JD. Synthesis of activated pyrimidine ribonucleotides in prebiotically plausible conditions. Nature. 2009;459:239–242. doi: 10.1038/nature08013. [DOI] [PubMed] [Google Scholar]
- 7.Gilbert W. Origin of life: The RNA world. Nature. 1986;319:618. [Google Scholar]
- 8.Joyce GF. The antiquity of RNA-based evolution. Nature. 2002;418:214–221. doi: 10.1038/418214a. [DOI] [PubMed] [Google Scholar]
- 9.New MH, Pohorille A. An inherited efficiencies model of non-genomic evolution. Simul Pract Theory. 2000;8:99–108. [Google Scholar]
- 10.Shapiro R. A replicator was not involved in the origin of life. IUBMB Life. 2000;49:173–176. doi: 10.1080/713803621. [DOI] [PubMed] [Google Scholar]
- 11.Kauffman SA. The Origins of Order. New York: Oxford Univ Press; 1993. [Google Scholar]
- 12.Szathmáry E. The evolution of replicators. Philos Trans R Soc Lond B Biol Sci. 2000;355:1669–1676. doi: 10.1098/rstb.2000.0730. [DOI] [PMC free article] [PubMed] [Google Scholar]
- 13.Szathmáry E. The origin of replicators and reproducers. Philos Trans R Soc Lond B Biol Sci. 2006;361:1761–1776. doi: 10.1098/rstb.2006.1912. [DOI] [PMC free article] [PubMed] [Google Scholar]
- 14.Segré D, Ben-Eli D, Lancet D. Compositional genomes: Prebiotic information transfer in mutually catalytic noncovalent assemblies. Proc Natl Acad Sci USA. 2000;97:4112–4117. doi: 10.1073/pnas.97.8.4112. [DOI] [PMC free article] [PubMed] [Google Scholar]
- 15.Segré D, Shenhav B, Kafri R, Lancet D. The molecular roots of compositional inheritance. J Theor Biol. 2001;213:481–491. doi: 10.1006/jtbi.2001.2440. [DOI] [PubMed] [Google Scholar]
- 16.Segré D, Ben-Eli D, Deamer DW, Lancet D. The lipid world. Orig Life Evol Biosph. 2001;31:119–145. doi: 10.1023/a:1006746807104. [DOI] [PubMed] [Google Scholar]
- 17.Maynard Smith J. The Problems of Biology. Oxford: Oxford Univ Press; 1986. [Google Scholar]
- 18.Gillespie DT. A general method for numerically simulating the stochastic time evolution of coupled chemical reactions. J Comput Phys. 1976;22:403–434. [Google Scholar]
- 19.Gillespie DT. Exact stochastic simulation of coupled chemical reactions. J Phys Chem. 1977;81:2340–2361. [Google Scholar]
- 20.Lancet D, Sadovsky E, Seidemann E. Probability model for molecular recognition in biological receptor repertoires—Significance to the olfactory system. Proc Natl Acad Sci USA. 1993;90:3715–3719. doi: 10.1073/pnas.90.8.3715. [DOI] [PMC free article] [PubMed] [Google Scholar]
- 21.Rosenwald S, Kafri R, Lancet D. Test of a statistical model for molecular recognition in biological repertoires. J Theor Biol. 2002;216:327–336. doi: 10.1006/jtbi.2002.2538. [DOI] [PubMed] [Google Scholar]
- 22.Thompson CJ, McBride JL. On Eigen’s theory of the self-organization of matter and the evolution of biological macromolecules. Math Biosci. 1974;21:127–142. [Google Scholar]
- 23.Jones BJ, Enns RH, Rangnekar SS. On the theory of selection of coupled macromolecular systems. Bull Math Biol. 1976;38:15–28. [Google Scholar]
- 24.Eigen M, Schuster P. The hypercycle. A principle of natural self-organization. Part A: Emergence of the hypercycle. Naturwissenschaften. 1977;64:541–565. doi: 10.1007/BF00450633. [DOI] [PubMed] [Google Scholar]
- 25.Szathmáry E, Demeter L. Group selection of early replicators and the origin of life. J Theor Biol. 1987;128:463–486. doi: 10.1016/s0022-5193(87)80191-1. [DOI] [PubMed] [Google Scholar]
- 26.Zintzaras E, Santos M, Szathmáry E. ‘Living’ under the challenge of information decay: The stochastic corrector model vs. hypercycles. J Theor Biol. 2002;217:167–181. doi: 10.1006/jtbi.2002.3026. [DOI] [PubMed] [Google Scholar]
- 27.Eigen M, McCaskill J, Schuster P. Molecular quasi-species. J Phys Chem. 1988;92:6881–6891. [Google Scholar]
- 28.Hunding A, et al. Compositional complementarity and prebiotic ecology in the origin of life. Bioessays. 2006;28:399–412. doi: 10.1002/bies.20389. [DOI] [PubMed] [Google Scholar]
- 29.Jollife IT. Principal Component Analysis. 2nd Ed. New York: Springer; 2004. [Google Scholar]
- 30.Moran PAP. Random processes in genetics. Proc Camb Philos Soc. 1958;54:60–71. [Google Scholar]
- 31.Bedau M, et al. Open problems in artificial life. Artif Life. 2000;6:363–376. doi: 10.1162/106454600300103683. [DOI] [PubMed] [Google Scholar]
- 32.Hull DL. Individuality and selection. Annu Rev Ecol Syst. 1980;11:311–332. [Google Scholar]
- 33.Fontana W, Schuster P. Continuity in evolution: On the nature of transitions. Science. 1998;280:1451–1455. doi: 10.1126/science.280.5368.1451. [DOI] [PubMed] [Google Scholar]
- 34.Maynard Smith J, Szathmáry E. The Major Transitions in Evolution. Oxford: Oxford Univ Press; 1995. [Google Scholar]
- 35.Norris V, Rained DJ. A fission-fusion origin for life. Orig Life Evol Biosph. 1998;28:523–537. doi: 10.1023/a:1006568226145. [DOI] [PubMed] [Google Scholar]
- 36.Shapiro R. A simpler origin for life. Sci Am. 2007;296:46–53. doi: 10.1038/scientificamerican0607-46. [DOI] [PubMed] [Google Scholar]
- 37.Gánti T. The Principles of Life. Oxford: Oxford Univ Press; 2003. [Google Scholar]
- 38.Wächtershäuser G. Before enzymes and templates: Theory of surface metabolism. Microbiol Rev. 1988;52:452–484. doi: 10.1128/mr.52.4.452-484.1988. [DOI] [PMC free article] [PubMed] [Google Scholar]
- 39.Wächtershäuser G. Groundworks for an evolutionary biochemistry: The iron-sulphur world. Prog Biophys Mol Biol. 1992;58:85–201. doi: 10.1016/0079-6107(92)90022-x. [DOI] [PubMed] [Google Scholar]
- 40.Shenhav B, Oz A, Lancet D. Coevolution of compositional protocells and their environment. Philos Trans R Soc Lond B Biol Sci. 2007;362:1813–1819. doi: 10.1098/rstb.2007.2073. [DOI] [PMC free article] [PubMed] [Google Scholar]
- 41.Hogeweg P. On searching generic properties of non-generic phenomena: An approach to bioinformatics theory formation. In: Adami C, Belew RK, Kitano H, Taylor CE, editors. Proceedings of the Sixth International Conference on Artificial Life. Cambridge, MA: MIT Press; 1998. pp. 285–294. [Google Scholar]
- 42.Borgatti SP. NetDraw: Graph Visualization Software. Cambridge, MA: Analytic Technologies; 2002. Version 2.081. [Google Scholar]
Associated Data
This section collects any data citations, data availability statements, or supplementary materials included in this article.