

Abstract
Cell fate decisions are regulated by the coordinated activation of signalling pathways such as the extracellular signal-regulated kinase (ERK) cascade, but contributions of individual kinase isoforms are mostly unknown. By combining quantitative data from erythropoietin-induced pathway activation in primary erythroid progenitor (colony-forming unit erythroid stage, CFU-E) cells with mathematical modelling, we predicted and experimentally confirmed a distributive ERK phosphorylation mechanism in CFU-E cells. Model analysis showed bow-tie-shaped signal processing and inherently transient signalling for cytokine-induced ERK signalling. Sensitivity analysis predicted that, through a feedback-mediated process, increasing one ERK isoform reduces activation of the other isoform, which was verified by protein over-expression. We calculated ERK activation for biochemically not addressable but physiologically relevant ligand concentrations showing that double-phosphorylated ERK1 attenuates proliferation beyond a certain activation level, whereas activated ERK2 enhances proliferation with saturation kinetics. Thus, we provide a quantitative link between earlier unobservable signalling dynamics and cell fate decisions.
Keywords: cytokine receptor, ERK, information processing, proliferation, sensitivity analysis
Introduction
Cell proliferation, differentiation, and survival are controlled by the time, duration, and amplitude of signalling network activation, a paradigm of which is the extracellular signal-regulated kinase (ERK) signalling cascade (Chang and Karin, 2001). This three-tiered kinase array (Raf, MEK1/2, and ERK1/2) transduces signals from cell surface receptors such as receptor tyrosine kinases (RTKs) and cytokine receptors. Despite the wealth of knowledge regarding the components involved, their particular contribution to controlling dynamic properties of the pathway and links to specific biological responses are still enigmatic.
Experimental analysis is complicated by the existence of multiple isoforms at each level of the mammalian cascade. Two highly related isoforms, MEK1/2 and ERK1/2, respectively, act similarly in most experimental settings suggesting that they are functionally redundant (Kolch, 2000). However, recent results indicate that isoforms may have different functions. Although MEK1 (Giroux et al, 1999) and ERK2 (Saba-El-Leil et al, 2003) knockout mice are embryonic lethal, MEK2 (Belanger et al, 2003) and ERK1 (Nekrasova et al, 2005) knockout mice are viable. The mechanisms underlying these differences are not understood.
Signal transmission through this pathway involves activation by dual phosphorylation of MEK and ERK, respectively. This process may proceed by a processive or distributive mechanism. In a processive mechanism a single molecule of MEK binds ERK, catalyses phosphorylation of both threonine and tyrosine of the conserved TEY motif in the ERK activation loop, and subsequently dissociates. The processive mechanism implies that there is one major and rate-limiting event—forming of the complex—followed by relatively fast phosphorylation events (Burack and Sturgill, 1997). A processive mechanism is more efficient in fully activating ERK with only one association reaction with MEK and thereby shortening the time lag for activation to permit rapid signalling. On the other hand, in a distributive mechanism, MEK binds ERK, phosphorylates one residue, and then dissociates. Thus, each phosphorylation step requires a separate binding event between kinase and substrate (Patwardhan and Miller, 2007). In a distributive mechanism the concentration of active MEK is more important for the rate of ERK activation providing (i) greater sensitivity to small changes in the concentration of active MEK, which results in more efficient signal amplification; and (ii) a kinetic proofreading mechanism by which the necessity for a dual binding increases the specificity of the reaction (Ubersax and Ferrell, 2007). In vitro evidence indicated that ERK phosphorylation proceeds in a distributive manner (Burack and Sturgill, 1997), but in vivo scaffolding proteins could pre-assemble complexes facilitating processive ERK activation (Levchenko et al, 2000).
To examine the dynamic properties of ERK signalling, several kinetic simulation models for RTK-mediated activation have been developed (Orton et al, 2005). These models propose mechanisms to explain the diverse responses of the phaeochromocytoma cell line PC12 to EGF and NGF stimulation (Sasagawa et al, 2005), ultrasensitivity (Huang and Ferrell, 1996), and the different effects of kinase and phosphatase inhibition (Heinrich et al, 2002; Hornberg et al, 2005b).
In contrast to RTKs that elicit strong and nearly complete phosphorylation of ERK, cytokine receptors that have a major role in the haematopoietic system induce only weak phosphorylation of ERK suggesting major differences in system properties. The ERK pathway induced by cytokines such as erythropoietin (Epo) has been shown to have important functions in cell proliferation and the prevention of apoptosis (Chang and Karin, 2001). The cognate receptor, the erythropoietin receptor (EpoR), is the key regulator of red blood cell formation (Wu et al, 1995). The unliganded EpoR exists as a preformed homodimer at the cell surface (Livnah et al, 1999) pre-associated with its cognate kinase JAK2 (Huang et al, 2001). Different from the interleukin-6 receptor (gp130) that forms a stable complex with JAK1 (Giese et al, 2003; Behrmann et al, 2004) and therefore is considered RTK-like, the EpoR and JAK2 form a dynamic complex with rapid intermolecular exchange (Blake et al, 2002).
Binding of Epo induces a conformational change that activates JAK2 leading to the phosphorylation of tyrosine residues in JAK2 and in the cytoplasmic tail of the EpoR that act as docking sites for Src-homology 2 (SH2) domain-containing proteins (Richmond et al, 2005). A major mediator of termination of signalling through the EpoR is tyrosine phosphatase SHP1 that is recruited to the phosphorylated receptor and dephosphorylates JAK2 (Klingmüller et al, 1995).
So far, the majority of the data used for modelling has been generated using tumour-derived cell lines that are genetically unstable and harbour major alterations in signalling networks. One of the most frequently altered signalling pathways in tumour cells is the ERK signalling cascade (Bos, 1989). Therefore, to identify dynamic properties of the pathway regulating cell fate decisions it is important to examine pathway behaviour in primary cells. Reliable data generation for dynamic pathway modelling requires standardisation of preparation as well as cultivation of primary cells (Schilling et al, 2008). To monitor the dynamics of pathway activation, time-resolved data can be established by quantitative immunoblotting (Schilling et al, 2005a), but for accurate quantification of the ratio of mono- versus double-phosphorylated ERK1/ERK2 advancements in quantitative mass spectrometry would be desired.
Here, we present the first data-based mathematical model of a cytokine receptor-activated ERK signalling network in the context of primary cells. We show a distributive mode of ERK activation facilitating strong signal amplification and inherently short signal duration properties because of negative feedback regulation. The model enables us to identify the parameters that control signalling behaviour and to validate the results by over-expression of signalling components in primary cells. We calculate ERK activation for biochemically not addressable Epo concentrations and quantitatively link these results to proliferation of colony-forming unit erythroid stage (CFU-E) cells, showing isoform-specific and dose-dependent cell fate decision responses.
Results
A data-based mathematical model of cytokine receptor-mediated ERK signalling
We developed a mathematical mass action model of the Epo-induced ERK signalling network (Figure 1A; Supplementary Figure 1). Our model is divided into a submodule describing events at the plasma membrane and two alternative submodules representing processive or distributive phosphorylation of the TEY motif in the activation loop of ERK by MEK. The mathematical models are depicted as process diagrams (Kitano et al, 2005), showing mass action, delay, and enzymatic reactions without considering transient complex formations. To capture events at the plasma membrane a dynamic complex model (Figure 1A; Supplementary Figure 4A) was developed assuming constant Epo concentration as input and describing activation of JAK2 in dependence of ligand binding to the EpoR with subsequent receptor phosphorylation. Ligand-dependent downmodulation, for example through receptor endocytosis, as well as dephosphorylation were summarised in the dynamic complex model by describing SHP1-mediated dephosphorylation of the receptor-associated kinase and the receptor with a time delay. We used the linear chain trick (MacDonald, 1976) to model a soft delay with a standard deviation of 33% (Maiwald and Timmer, 2008). To represent the experimentally observed transient activation, it was necessary to include a time delay because an immediate dephosphorylation mechanism without delay would result in a new steady state. Furthermore, the delay steps reflect the sequential dephosphorylation of the EpoR and JAK2 at multiple phosphorylation sites. Immunoprecipitation studies showed that only a small fraction of intercellular JAK2 and SHP1 are associated (Wu et al, 2000). This suggested a rapid on-off binding rate of SHP1 that allows for flexible fine-tuning of SHP1 activity. In addition, as a simplified alternative to represent receptor activation and deactivation, a stable complex model (Supplementary Figure 4B) and a stable complex and subcompartment model (Supplementary Figure 4C) were tested assuming stable complex formation of the receptor and JAK2 and unimolecular conversion to a desensitised state.
Figure 1.

Mathematical modelling of the erythropoietin-induced ERK signalling network. (A) Process diagram of the dynamic signalling network model consisting of reactions (arrows) with enzymatic, mass action, or delay kinetics. Round-headed arrows indicate enzymes catalysing the particular reaction. Erythropoietin (Epo) is used as input function of the system. Binding of Epo to its receptor (EpoR) leads to a conformational change in the receptor, which results in phosphorylation of JAK2. Grey shading indicates components of biological complexes that were not directly represented in the model. ERK activation is modelled using a processive or distributive mechanism, the connection to the submodule describing events at the plasma membrane indicated by a question mark. (B) Trajectories of the fitted model variables for processive (dashed line) or distributive ERK activation (solid line). Experimental data are depicted as open circles. Source data is available for this figure at http://www.nature.com/msb.
Ras activation was modelled by treating SOS and its adaptor proteins as a single entity that is recruited to the membrane by phosphorylated EpoR. Ras and Raf activation is summarised as a single step from SOS to Raf. For subsequent ERK activation, a single-step processive model and a two-step distributive model were compared considering both MEK1/2 and ERK1/2 isoforms. Isoform-specific parameters were used for substrate phosphorylation, whereas phosphatases were assumed to remain constant in the analysed timeframe and not discriminating between the two ERK isoforms. Several forms of negative feedback have been proposed, including inhibitory phosphorylation of SOS (Buday et al, 1995). In line with results obtained with related cytokine receptors, for example the growth hormone receptor (Vanderkuur et al, 1997), the main negative feedback loop activated by the EpoR was assumed to be ERK-mediated inhibitory phosphorylation of SOS (Supplementary Figure 2). Thus, a negative feedback from ERK resulting in phosphorylation and displacement of SOS from the membrane and dephosphorylation by a constant phosphatase was incorporated.
To calibrate the model and estimate kinetic parameters densely sampled time-resolved data were acquired from primary murine erythroid progenitor (CFU-E) cells continuously stimulated with Epo (Figure 1B). The amount of phosphorylated and total EpoR, JAK2, MEK2, MEK1, ERK1, ERK2, and SOS in these cells were determined by quantitative immunoblotting (Supplementary Figure 2), normalised using calibrator or normaliser proteins and merged as described earlier (Schilling et al, 2005a). The specificity of the polyclonal antibodies to monitor double-phosphorylated MEK and double-phosphorylated ERK was confirmed by using residue-specific monoclonal antibodies (Supplementary Figure 3).
Total protein levels remained constant during the time investigated, thus justifying application of mass conservation in the model. As for phosphorylated proteins only relative and not absolute amounts could be determined, scaling factors were included in the observation function for each species. As the sum of mono- and double-phosphorylated ERK could be directly determined by analysing the fraction with retarded migration in the SDS–polyacrylamide gel, constraints were introduced to define the maximum amount of the sum of mono- and double-phosphorylated ERK as 30% of total ERK. The number of EpoR on the cell surface was determined by a saturation-binding assay with [125I]-labelled Epo.
The parameters were estimated using the MATLAB® toolbox PottersWheel (Maiwald and Timmer, 2008) by a trust-region optimisation approach, minimising χ2, the sum of weighted and squared residuals between our measurements and the model trajectory. Standard deviations of the measured data were estimated with a smoothing spline approach (similar to Rice, 1984).
To decide which receptor model is most suited for our studies, we estimated parameters for the three receptor models connected to the distributive ERK module using 1000 fits to experimental data (Figure 1B) with random initial parameter guesses and analysed the trajectories of pJAK2 and pEpoR for the best fit (Supplementary Figure 4). The dynamic complex model and the stable complex and subcompartment model were sufficient in describing the data, with the dynamic complex model having the lowest χ2-value and being ranked best by the Akaike information criterion (AIC). To examine the ability of the two models to predict signalling responses for higher and lower Epo concentrations, model simulations were compared with experimental data obtained from CFU-E cells stimulated with Epo concentrations ranging from 0.1 to 1000 U/ml, analysing the phosphorylation of JAK2 by quantitative immunoblotting (Supplementary Figure 5A). Again the dynamic complex model was in line with the experimental data (Supplementary Figure 5C), whereas the stable complex and subcompartment model failed to describe the experimental data (P<0.05 based on the χ2 distribution). Therefore, we used the dynamic complex model for subsequent analyses.
We next compared the goodness-of-fit to the experimental data using the model describing a processive versus a distributive mechanism for ERK phosphorylation after parameter estimation. The χ2-value for the distributive ERK activation model was significantly lower than the χ2-value for the processive ERK activation model and a log-likelihood-ratio test showed that the distributive model describes the data best with a P-value <10−6 (Figure 1B). Furthermore, we calculated an AIC of 679.1 and 878.7 for the distributive and the processive model, respectively. By using enzymatic reactions with the reaction rate proportional to the product of substrate and enzyme concentration, we assume in our modelling approach that all enzymes are far from being saturated by their substrate. To verify that this assumption does not influence our results, we created additional models by adding complex formation to the phosphorylation reactions of MEK and ERK (Supplementary Figure 6) and show that saturation of the kinases does not explain the signalling behaviour.
As the processive model cannot explain our quantitative data, the hypothesis ‘can both MEK and ERK phosphorylation be described by a processive mechanism' is rejected. Detailed analysis of the determined kinetic rate constants (Supplementary Figure 7B) showed that MEK activation in vivo is catalysed by a processive mechanism whereby the second phosphorylation occurs much faster than the first, whereas ERK activation uses a distributive mechanism in which both phosphorylations take place at similar rates. As a distributive mechanism with the first rate much smaller than the second would mimic a processive mechanism, analysis of the parameters showed that MEK phosphorylation can be regarded as a processive mechanism modelled with a slow first and a fast second step, whereas this does not apply to the ERK phosphorylation. These results obtained by mathematical modelling of MEK and ERK phosphorylation in primary CFU-E cells are in line with earlier described in vitro studies that suggest that MEK activation is processive (Alessi et al, 1994), whereas ERK phosphorylation is distributive (Burack and Sturgill, 1997). In vivo, scaffolding proteins could convert an underlying distributive mechanism into processive phosphorylation of ERK. However, our results indicate that in primary cells ERK phosphorylation is distributive.
Validation of the model-predicted distributive mechanism for ERK phosphorylation
To verify the ERK phosphorylation mechanism indicated by the model, we calculated the theoretical fraction of non-, mono-, and double-phosphorylated ERK1 and ERK2 predicted for a processive or distributive mechanism of ERK phosphorylation (Figure 2A). These calculations predicted that for processive ERK phosphorylation only double-phosphorylated ERK1 and ERK2 should be detectable, representing approximately 30% of the total ERK1 and ERK2 pool at maximal activation of the pathway, as defined by the model constraints. On the other hand, distributive ERK phosphorylation would results in the presence of mono- and double-phosphorylated ERK1 and ERK2, with only 10% of total ERK being double phosphorylated.
Figure 2.

Mass spectrometric validation of theoretically predicted distributive ERK activation. (A) Predicted fractions of non-phosphorylated (light grey), mono-phosphorylated (grey), and double-phosphorylated (dark grey) ERK1 and ERK2 are compared for the processive and distributive ERK activation model. Shaded areas indicate standard deviations of the predictions. (B) UPLC-MS analysis of ERK1 and ERK2 phosphorylation status in CFU-E cells before and after 7-min stimulation with 50 U/ml Epo. The extracted ion chromatograms for the [M+3H]3+ ions of the non-, mono-, and double-phosphorylated tryptic peptides are shown as indicated. (C) Molar abundances of the non-, mono-, and double-phosphorylated peptide species derived from ERK1 and ERK2 before and after stimulation with Epo determined by UPLC-ESI-MS. Source data is available for this figure at http://www.nature.com/msb.
To experimentally determine the fraction of mono- and double-phosphorylated ERK in CFU-E cells at maximum stimulation, we established a label-free quantitative mass spectrometric (MS) approach. In ERK1 and ERK2, the two regulatory phosphorylation sites are located in a single tryptic peptide that differs between ERK1 and ERK2 by two homologous amino acid exchanges and therefore can be distinguished by MS analysis. To establish a strategy to reliably detect phosphorylation at the two closely adjacent sites we examined synthetic ERK phosphopeptides by MS in nano-electrospray ionisation (ESI) mode. First, synthetic ERK phosphopeptides were analysed by MS, reliably identifying non-phosphorylated (-TEY-), mono-phosphorylated on Thr (-pTEY-) or Tyr (-TEpY-), and double-phosphorylated (-pTEpY-) peptides (Supplementary Figures 8 and 9A). Second, we used ultra-performance liquid chromatography (UPLC) of these synthetic reference peptides to determine the elution order for the ERK tryptic activation loop peptides (Supplementary Figure 9B). From this analysis we derived correction factors for converting ion intensities into relative protein concentrations. The correction factors compensate for differences in the individual recoveries of the non-, mono-, and double-phosphopeptides by the UPLC separation and for differences in ionisation efficiency during ESI (Supplementary Figure 9C). Thus, we were able to discriminate non-, mono-, and double-phosphorylated ERK1 and ERK2 in a reliable and quantitative manner. By our quantitative MS analysis, we detected both mono- and double-phosphopeptides for ERK1 and ERK2 on Epo stimulation (Figure 2B). The mono-phosphorylated peptides detected were modified at Tyr, in line with the finding that Tyr is phosphorylated before Thr (Ferrell and Bhatt, 1997). In CFU-E cells more ERK2 than ERK1 is observed, and approximately 30% of total ERK (Supplementary Table S1) is phosphorylated on maximal Epo stimulation confirming that cytokine receptors are weak activators of ERK signalling. Both mono- and double-phosphorylated ERK are contained in the band with retarded migration in SDS–polyacrylamide gel observed on stimulation of the pathway. The mono-phosphorylated form is present in excess with only approximately one-third representing the double-phosphorylated form. These experimentally observed ratios (Figure 2C) correspond directly to the theoretical values predicted by the model of distributive ERK phosphorylation (Figure 2A). Furthermore, earlier reports that the first dephosphorylation step of ERK by a dual-specific phosphatase is on Tyr (Zhao and Zhang, 2001) argue against a selective dephosphorylation of double-phosphorylated ERK on Thr as an explanation for the experimentally observed peptides mono-phosphorylated on Tyr. We therefore could refine our model constraints, defining the maximum amount of mono- and double-phosphorylated ERK as 20 and 10% of total ERK, respectively. Thus, by combining model prediction with label-free quantitative MS analysis we show that in primary cells ERK phosphorylation involves a distributive mechanism. Although distributive ERK phosphorylation was shown earlier in vitro with recombinant enzymes using constitutively active MEK (Burack and Sturgill, 1997), to our knowledge this is the first evidence that ERK phosphorylation in mammalian cells also occurs through a distributive mechanism, and that scaffolds that could mimic a processive mechanism apparently do not have a major role in primary erythroid progenitor cells.
Establishment of an identifiable ERK model
To evaluate possible further model improvements we tested the necessity to include additional feedback mechanisms that have been identified for the MAPK signalling pathway in other systems (Kholodenko, 2007; Santos et al, 2007). Our model contains the negative feedback from activated ERK to SOS that leads to a disruption of the SOS complex at the cell membrane and termination of Ras activation by SOS (Langlois et al, 1995). However, several positive and negative feedback loops within the core kinase module (Raf, MEK, and ERK) triggered by active MEK or ERK, respectively, were reported (Alessandrini et al, 1996; Eblen et al, 2004; Dougherty et al, 2005). To evaluate the effects of these additional feedbacks, we systematically incorporated them into our model by considering additional negative feedback (ppERK enhancing dephosphorylation of ppMEK or pRaf; ppMEK enhancing dephosphorylation of pRaf) or positive feedback (ppERK enhancing phosphorylation of MEK or Raf; ppMEK enhancing phosphorylation of Raf). The χ2-values of these six extended models were compared statistically with the value of the original model based on likelihood-ratio tests. The results (Supplementary Table 2) showed that the inclusion of neither positive nor negative feedbacks in the kinase module yielded a significant improvement of the fitting result, and therefore they were not included in our final ERK model.
To analyse system properties by using a mathematical model it is important to identify the values of all relevant parameters. Thus, we developed strategies to reduce our model to be identifiable. Often, partially observed reaction-based dynamic models such as our ERK model are not identifiable, that is parameter values cannot be determined unambiguously. Groups of parameters may exist that can compensate each other resulting in the same goodness-of-fit and leading to measurement-compliant multi-dimensional manifolds in the parameter space (Hengl et al, 2007). Thus, we performed iterative cycles of parameter estimation and detection of non-identifiable, dependent parameters (Supplementary Figure 10). We identified nine groups of parameter doublets, triplets, or quadruplets that were dependent (Supplementary Figure 11) and fixed subsets of the parameter groups. Ultimately, we succeeded in identifying 21 parameters with a standard deviation of 15% or less. These strategies enabled us to generate fit trajectories that adequately represent the time courses of the quantitative experimental data for the eight measured observables. The χ2-values are comparable to the number of data points, indicating good agreement of the model with the data. On the basis of a goodness-of-fit test relating the χ2-value to the χ2-distribution with N=236 degrees of freedom given by the number of data points, we calculated a P-value >0.05 that our ERK model with 32 parameters is sufficient for describing the quantitative experimental data.
Information processing through bow-tie structure
To identify mechanisms regulating information processing in the ERK cascade, we analysed system properties of our signalling network. ERK activation in response to Epo stimulation is transient, as model trajectories (Supplementary Figure 12A) and quantitative experimental data (Supplementary Figure 2) show rapid activation and a return to basal levels after 30–40 min. Remarkably, activation and deactivation of MEK and ERK follow a much sharper peak than phosphorylation and dephosphorylation at the receptor level. Similar observations have been reported in a computational model of EGF-induced ERK activation in HeLa cells (Schoeberl et al, 2002). Plotting the trajectories for the variables (Supplementary Figure 12A) indicates that this effect is caused by the negative feedback of double-phosphorylated ERK to SOS, leaving a very narrow time window for activation of Raf, that is the first 10 min. On the other hand, receptor downmodulation is delayed, requiring about 20–30 min. To investigate information processing through the signalling cascade, we theoretically calculated signal amplification and attenuation for each step (Supplementary Figure 12B) by plotting the model trajectories for the number of activated molecules and determining the amplitude of the curve. As expected, EpoR activates the ERK pathway only weakly, leading to substantial signal attenuation between EpoR and the membrane-associated factors SOS and Raf. However, this weak signal is massively amplified by MEK and ERK. Although the total protein concentrations of MEK and ERK only differ by a factor of 3.5, the concentrations of activated proteins are increased by a factor of 5000. In line with theoretical considerations (Heinrich et al, 2002), strong signal amplification is observed for activation of ERK signalling by a receptor that weakly activates the pathway such as the EpoR. Thus, signal processing in the Epo-triggered ERK pathway represents a bow-tie architecture (Figure 3A). This phosphorylation bow tie is shaped by signal attenuation and signal amplification between membrane-associated and cytoplasmic kinases. The phosphorylation bow tie resembles a regulatory bow tie, an organisational theme that has been proposed to occur commonly in biology based on theoretical considerations (Csete and Doyle, 2004). One of the common features is that the main source of fragility is the knot in the bow tie, therefore indicating that activation of Ras by SOS and Raf by Ras represents a sensitive step in the signalling cascade.
Figure 3.

Sensitivity analysis shows isoform repression by negative feedback and signal amplification. (A) Bow-tie architecture of the signalling network. Abundance of activated molecules is shown in grey; standard deviations of the model predictions are indicated as dashed solid lines. (B) Control coefficients of the initial protein concentrations for amplitude, integrated response, peak time, and duration of double-phosphorylated ERK1 and ERK2 were calculated. Positive control is indicated by shades of red; negative control is shown by shades of blue, whereas green fields represent no control. (C) The impact of over-expressing ERK1 on the activation of upstream molecules by the negative feedback. Elevated ERK1 levels enhance the negative feedback on membrane-associated SOS. The slight reduction in activation of SOS and Raf (see insets) is propagated and amplified to MEK and ERK, thus reducing double-phosphorylated ERK2 levels.
Identification of proteins controlling amplitude and duration of ERK activation
To systematically identify proteins and reactions that control ERK activation, we performed a sensitivity analysis. We analysed the target quantities peak amplitude (maximum activation), integrated response (area under the activation curve), peak time (time of maximum activation), and duration (time until signal drops down to 10% of its maximum activation) of double-phosphorylated ERK1 and ERK2 as exemplified in Supplementary Figure 13A. We calculated control coefficients for the kinetic rate constants of our model (Supplementary Figure 13B). As can be shown by summation theorems, the sum of all control coefficients for the kinetic rates is equal to 0 for peak amplitude and to −1 for the other quantities analysed (Peletier et al, 2003; Hornberg et al, 2005b). Positive control over the peak amplitude and integrated response of double-phosphorylated ERK1 and ERK2 were distributed among the parameters associated with activation of SOS and Raf, whereas highest negative control was associated with dephosphorylation of Raf. Dephosphorylation of Raf and MEK was also the only parameters significantly controlling peak time and duration of double-phosphorylated ERK1 and ERK2, supporting the theory that phosphatases have the strongest influence on duration of signalling (Heinrich et al, 2002).
To calculate control coefficients for protein amounts, we varied the initial concentrations of the signalling molecules in our model (Figure 3B), which were determined experimentally or by parameter estimation and are in physiologically meaningful ranges and consistent with concentrations reported in the literature (Fujioka et al, 2006). Initial concentrations of EpoR, SOS, and Raf controlled the peak amplitude of double-phosphorylated ERK1 and ERK2. Consistent with the different time scales of the negative feedback acting on SOS and at the receptor level, SHP1 levels and other receptor downregulating events did not control these quantities. Our model indicated that because of the strong negative feedback loop from ERK to SOS, ERK signalling is terminated before downregulation of the EpoR becomes apparent. Varying the initial concentrations of signalling molecules in silico had a major impact on amplitude and integrated response, but virtually no influence on peak time and duration of ERK activation, indicating that the negative feedbacks prevent sustained signalling. Interestingly, ERK1 exerted major positive control over the peak amplitude of double-phosphorylated ERK1 and minor negative control over double-phosphorylated ERK2, whereas the control coefficients of ERK2 were reciprocal. To analyse the underlying cause for this behaviour, we simulated the theoretical trajectories for the activated pathway components for control cells and cells over-expressing ERK1 (Figure 3C). When ERK1 is elevated, the negative feedback of activated ERK to SOS slightly reduces SOS activation. Consequently, activation of Raf and MEK is further reduced, and the effect is intensified on signal amplification, ultimately reducing ERK2 activation. As the phosphorylation reactions were considered to happen very fast and we did not consider enzyme–substrate complexes in the model, this is not caused by competition for the substrate. Thus, the negative feedback from ERK to SOS is responsible for reciprocal control of phosphorylated ERK1 and ERK2.
Experimental validation of the model-predicted reciprocal control of phosphorylated ERK1 and ERK2
To experimentally address that the two ERK isoforms cross-regulate each other's activation through a feedback mechanism, we performed optimal experimental design using our mathematical model. We determined at which time point the largest difference in ERK phosphorylation could be expected between over-expressing versus control cells. The in silico investigations showed that, as only a minor fraction of SOS is recruited to the membrane, a threefold increase in ERK1 or ERK2 is predicted to only result in an approximately 1% increase in pSOS levels, which is below the detection limit of quantitative immunoblotting with an average standard deviation of about 20%. However, major differences are expected for the phosphorylation patterns of ERK1 and ERK2, the most informative time point being 7 min after stimulation. Thus, we over-expressed ERK1 or ERK2 in CFU-E cells and analysed total as well as phospho-levels of ERK by quantitative immunoblotting. As shown in Figures 4A and B, a tenfold increase in ERK1 and a threefold increase in ERK2 expression were achieved. These over-expression levels were used for model simulations to predict the effects on the time course of double-phosphorylated ERK1 and ERK2 (Figure 4C, solid lines). In line with the sensitivity analysis, raising the ERK1 concentration is predicted to increase the amplitude of double-phosphorylated ERK1 but to reduce the amplitude of double-phosphorylated ERK2. On the other hand, raising the ERK2 concentration would increase the amplitude of double-phosphorylated ERK2 but reduce the amplitude of double-phosphorylated ERK1. The experimentally observed ERK activation in response to Epo stimulation (Figure 4C, open symbols) is in good agreement with the in silico predictions, showing that over-expression of an ERK isoform reduces activation of its counterpart and thus validating the predictive power of our model.
Figure 4.

Prediction and validation of ERK signalling control by protein levels. (A) Murine CFU-E cells retrovirally transduced with ERK1, ERK2, or vector control were stimulated with Epo for 7 min or left untreated and subjected to quantitative immunoblotting. (B) Total ERK1 and ERK2 levels in (A) were quantified and over-expression levels compared to control were calculated. Error bars represent standard deviations of six replicates. (C) The effect of elevated concentrations of ERK1 and ERK2 was simulated in silico and trajectories of double-phosphorylated ERK1 and ERK2 were plotted (solid lines). The phosphorylation levels of ERK depicted in (A) were quantified and scaled to the predicted values (open symbols). Error bars represent standard deviations of three replicates. Source data is available for this figure at http://www.nature.com/msb.
Linking pathway activation to cell fate decisions
Next, we addressed correlation of the extent of ERK activation as a function of initial protein concentrations as well as different Epo levels and biological responses such as cellular proliferation. We focused on the integrated response of double-phosphorylated ERK1 and ERK2, that is the area under the activation curve, rather than steady state or amplitude. Owing to the strong negative feedbacks, phosphorylation levels at steady state are indistinguishable for different initial protein concentrations (compare late time points in Figure 4C). Cell proliferation could also be linked to the peak amplitude of ERK activation; however, as peak amplitude and integrated response are highly correlated (compare Figure 3B), we concentrated on the integrated response, which has been linked to DNA synthesis earlier (Asthagiri et al, 2000).
To predict the integrated signalling response for different Epo concentrations, we made use of the capacity of the model to predict the sigmoidal dose–response curve experimentally observed for the amplitude of JAK2 phosphorylation (Figure 5A, solid line). Therefore, the model that was calibrated as described earlier using experimental data obtained from cells stimulated with 50 U/ml Epo (Figure 1B) allowed us to calculate the integrated response of double-phosphorylated ERK1 and ERK2 for different initial concentrations of ERK1 and ERK2 and for Epo concentrations ranging from 10−3 to 104 U/ml (Figure 5B). Low Epo concentrations are biochemically not addressable, as ERK phosphorylation levels elicited by Epo concentrations lower than 0.1 U/ml are below the detection limit of immunoblotting or MS analyses. However, these values are of important physiological significance as Epo plasma levels can vary between 1.5 × 10⁻³ and 10 U/ml in healthy persons (Jelkmann, 2004). Furthermore, the simulations showed that over-expression of ERK isoforms affected primarily the saturation amplitude and predicted that over-expression of double-phosphorylated ERK1 increased the integrated response of ERK1 while reducing the integrated response of double-phosphorylated ERK2, and vice versa.
Figure 5.

Over-expression of ERK1 and ERK2 in CFU-E cells leads to reduced proliferation in an Epo-dependent and isoform-specific manner. (A) Phosphorylation levels of JAK2 at 7 min after stimulation for Epo concentrations ranging from 0.1 to 1000 U/ml were simulated in silico (solid line). CFU-E cells were stimulated with the indicated Epo concentrations for 7 min and phosphorylation levels (open circles) were determined by quantitative immunoblotting and scaled to the predicted values. Error bars represent standard deviations of three biological replicates. The Epo concentration that was used for model calibration is indicated by a dashed vertical line. (B) Integrated responses of double-phosphorylated ERK1 and ERK2 were calculated for different Epo concentrations for the original model as well as for models with elevated ERK1 or ERK2 levels. Dashed vertical lines indicate the Epo concentration that was used for model calibration. (C) Retrovirally transduced CFU-E cells were incubated with increasing Epo concentrations for 14 h and proliferation was measured by [3H]-thymidine incorporation. The Epo concentration that was used for model calibration is indicated by a dashed vertical line. Error bars represent standard deviations of four replicates. Lines depict sigmoidal regression curves. Source data is available for this figure at http://www.nature.com/msb.
To analyse the effect of changes in protein concentrations on Epo-dependent proliferation, we transduced CFU-E cells with ERK1, ERK2, vector control, and AKT and measured Epo-dependent proliferation at the cell population level by thymidine incorporation (Figure 5C). Different Epo concentrations resulted in a sigmoidal dose–response curve. However, over-expression of ERK1 or ERK2 reduced the saturation amplitude of proliferation and increased differentiation (Supplementary Figure 14), with ERK1 having a stronger effect. This suggests that ERK hyperactivation has a negative impact on proliferation of CFU-E cells whereas apoptotic responses were not altered (data not shown). To control for general non-specific inhibition of cell proliferation because of over-expression of signalling components in primary cells we over-expressed AKT, another component of EpoR-mediated signalling (Bouscary et al, 2003; Ghaffari et al, 2006) and could show that proliferation was not affected (Figure 5C). We showed in two ways that the differential effects of ERK1 and ERK2 are highly significant: in a two-factorial analysis of variance with the null hypothesis ‘over-expression of ERK1 and ERK2 has the same effect on proliferation', the null hypothesis is dismissed with a P-value of 2.3 × 10⁻⁹. Additionally, in a likelihood-ratio test with the null hypothesis ‘cells over-expressing ERK1 and ERK2 have the same maximum proliferation as determined by a four-parameter Hill regression' the null hypothesis is dismissed with a P-value of 9.7 × 10⁻¹¹. Both analyses show that over-expression of ERK1 and ERK2 has a distinct effect on Epo-dependent proliferation of primary cells. Thus, we could show that the over-expression of ERK2 and to an even larger extent the over-expression of ERK1 inhibited cell proliferation. These results were unexpected, because by intuition one would rather expect an increase in proliferation as a consequence of over-expression of components of the MAP-kinase signalling cascade.
To link these effects on proliferation to the extent of pathway activation described by our mathematical model, we statistically analysed the impact of the integrated response of double-phosphorylated ERK1 and ERK2 on proliferation. We therefore formulated a nonlinear regression model in which proliferation additively depended on a spline-estimated integrated response of ERK1 or ERK2. Thus, proliferation is considered as a function of activated ERK1 and activated ERK2. To visualise our result, we plotted the integrated response of ERK1 and ERK2 (derived from Figure 5B) on the x- and y axes, respectively, and depicted the proliferation rates predicted by the nonlinear regression model by a heat map (Figure 6A). The red circles correspond to the integrated response of double-phosphorylated ERK1 and ERK2 for control CFU-E cells stimulated with 0.001 (bottom left corner of the graph) to 50 U/ml Epo (middle of the graph). As proliferation levelled at 50 U/ml Epo, we assumed constant proliferation for higher Epo doses in control cells. Additionally, the respective integrated responses for CFU-E cells subjected to elevated levels of ERK1 (light green triangles) or ERK2 (dark green triangles) are indicated. The regression model accurately represents our measured proliferation rates (shown in Figure 5C); with the best predictive power close to the measured data points. Extrapolating the contribution of the ERK isoforms to proliferation (Figure 6B) predicted that phosphorylated ERK1 supports proliferation up to a certain level, after which high levels of activated ERK become detrimental for proliferation. On the other hand, phosphorylated ERK2 stimulates proliferation with a saturation kinetics response. Taken together these results suggest that ERK2 drives proliferation, whereas ERK1 prevents proliferation in case of ERK hyperactivation.
Figure 6.

Cellular proliferation is controlled and confined by the integrated response of ERK1 and ERK2. (A) Integrated responses of double-phosphorylated ERK1 and ERK2 calculated in Figure 5B are depicted with symbols for control cells and cells over-expressing ERK1 or ERK2. The values correspond to CFU-E cells stimulated with Epo concentrations ranging from 0.001 to 50 U/ml. Assumed constant proliferation for very high doses of Epo is depicted by grey circles. The data points corresponding to the Epo concentration that was used for model calibration are indicated by dashed squares. Predicted proliferation by a nonlinear regression model is shown by a blue to red colour map, based on the measured CFU-E proliferation for these Epo concentrations as shown in Figure 5C. (B) Positive and negative contribution to average proliferation of double-phosphorylated ERK1 and ERK2 is depicted by a black line. Dashed lines indicate confidence intervals.
Discussion
By combining experimental analysis and mathematical modelling, we show that ERK signalling contributes to cell fate decisions in a dose-dependent and isoform-specific manner. With our ERK model we were able to dissect the contributions of activated ERK1 and ERK2, which provided us with a predictable quantitative model for cellular proliferation. So far, previous simulation models focused on ERK that is strongly activated by RTKs in cell lines (Orton et al, 2005). Theoretical calculations (Heinrich et al, 2002) predicted that signal amplification is less pronounced if a pathway is strongly activated. Cytokine receptors such as the EpoR are weak activators of the ERK pathway, as we show by quantitative mass spectrometry that only 10% of the ERK molecules are converted to the double-phosphorylated, active form. In line with the theoretical predictions (Heinrich et al, 2002), we show that this facilitates strong signal amplification. Furthermore, we show inherently transient signalling by strong feedback control.
A major challenge in mathematical modelling is the discrepancy between the number of parameters and experimentally measured data points, leading to remarkable variation in model parameters (Fujioka et al, 2006) and thus preventing quantitative predictions. To address this issue, we used recently developed methods for data normalisation and integration (Schilling et al, 2005a, 2005b) and improved identifiability analysis (Hengl et al, 2007). Thereby, we could establish a mathematical model with identifiable parameters quantitatively describing Epo-induced ERK activation and feedback-mediated deactivation.
It has been suggested that under physiological conditions only a minor pool of MEK and ERK is engaged by scaffolds (Kortum and Lewis, 2004). Here, we show in primary mammalian cells that ERK activation proceeds through a distributive, two-collision mechanism that appears not to be affected by scaffolding proteins. Therefore, although they may have important roles in determining particular responses by reducing threshold properties (Levchenko et al, 2000), scaffolds have limited impact on shaping the overall response of the ERK population in primary cells. The distributive ERK activation mechanism results in strong signal amplification and directly provides a strategy to protect cellular proteins against unspecific phosphorylation by kinetic proofreading. Conceptually, this strong signal amplification to ERK resembles observations reported for T-cell receptor (TCR) signalling whereby the final biological response to antigen stimulation is determined by integrating the TCR signal versus downstream propagation (Stefanova et al, 2003). A mathematical model for the signalling cascade downstream of TCR engagement showed that this is caused by a digital positive feedback based on ERK activation and a analogue negative feedback involving SHP1 (Altan-Bonnet and Germain, 2005).
Our model showed a bow-tie architecture of the information processing through the Epo-induced ERK pathway. Bow-tie structures have been predicted to dominate complex mammalian physiology, metabolism, and signalling (Csete and Doyle, 2004), but so far lacking solid experimental proof. Input from EpoR on the plasma membrane converges into a small number of activated Raf-1 molecules, which represent the knot in the bow tie. From there, the signals fan out to produce a large amount of activated ERK to elicit cell fate decisions. In a bow tie, the major source of fragility is the knot, which in our system is Raf. This is consistent with the dominant role of Raf in oncogenic pathways (Hornberg et al, 2005a; Dhillon et al, 2007). As we treated the activation steps leading from SOS to Ras-GTP to Raf as one step for simplification, the same argument holds true for Ras, which is another oncogene involved in various human cancers (Bos, 1989). The theoretical prediction (Nakabayashi and Sasaki, 2005) that the optimal number of reaction steps should be similar to the order of magnitude of the response amplification was experimentally confirmed by our analysis of the stoichiometry of activated and total protein levels. In our model, the number of activated molecules is increased by three orders of magnitude from Raf to ERK. As this module comprises three kinases, the theoretical prediction is verified. By theoretical sensitivity analysis based on the mathematical model, we discovered that over-expression of an ERK isoform leads to feedback-mediated inhibition of upstream components and reduced activation of the other isoform. Rather than by competition of ERK isoforms for the same upstream kinase, that is, MEK, we show both theoretically and experimentally that this effect is caused by the negative feedback from double-phosphorylated ERK to SOS. Thus, we provide further evidence that signalling systems are composed of multiple feedback functions that generate the input–output behaviour of a cell (Brandman and Meyer, 2008).
A major problem in connecting results derived from signalling studies to physiological events such as cellular responses is the different ligand concentrations applied for these assays. For example, IFN-α reduces the amount of HCV RNAs in a human hepatoblastoma cell line with a 50% inhibitory concentration of about 5 to 10 IU/ml (Windisch et al, 2005), which does not result in detectable STAT1 phosphorylation that is required for signalling. In our study, the parameters of the model were established for Epo concentrations that allow biochemical analysis of protein phosphorylation states. By using the mathematical model we could calculate the integrated response of ERK1 and ERK2 for lower doses of Epo. We predicted the extent of ERK activation for a wide variety of stimulus concentrations that cannot be investigated experimentally. Thus, mathematical modelling facilitates to bridge the large discrepancy of ligand concentrations used in physiological (e.g. proliferation) and biochemical (e.g. signalling) assays.
By linking the calculated integrated responses of ERK1 and ERK2 to measured proliferation rates by a nonlinear regression model, we derived a proliferation graph for every possible combination of the integrated responses of double-phosphorylated ERK1 and ERK2. Proliferation of erythroid progenitor cells is strictly dependent on Epo. Besides the ERK cascade, other pathways such as the JAK2-STAT5 and the PI3K/AKT pathway are also regulating proliferation and preventing apoptosis in CFU-E cells. Although activation of JAK2-STAT5 signalling has been primarily associated with survival signalling (Yoon and Watowich, 2003), it has been shown that for differentiation PI3K/AKT signalling (Ghaffari et al, 2006) and ERK signalling (Zhang and Lodish, 2007) are important. Likewise, an essential role of PI3K/AKT (Bouscary et al, 2003) and ERK signalling (Sakamoto et al, 2000) for proliferative responses has been shown. In our experiments, we could show that though over-expression of AKT had no effect on proliferation of erythroid progenitor cells, over-expression of ERK1 and ERK2 had a highly reproducible differential effect and reduced proliferation of erythroid progenitor cells in a dose-dependent manner. On the contrary, differentiation of erythroid progenitor cells (Supplementary Figure 14) was enhanced with over-expression of ERK1, once more having a stronger effect compared with over-expression of ERK2. No effect was detected on survival signalling in response to ERK1 and ERK2 over-expression in erythroid progenitor cells. Thus, though it does not exclude the contribution of other pathways, our studies show that the level of ERK activation has a profound and isoform-specific influence on proliferation of CFU-E cells.
The results showed that (i) as quantified by our dynamical pathway model the integrated response of double-phosphorylated ERK1 and ERK2 is a function of Epo and (ii) that proliferation of primary cells can be described by a generalised additive model as a function of double-phosphorylated ERK1 and ERK2 (all other pathways being unchanged) using the experimentally determined integrated response for double-phosphorylated ERK1 and ERK2 as input and the corresponding extent of proliferation as output. Both phosphorylation levels and proliferation values are averages for cell populations. By linking the average integrated response with the average proliferative response, we predicted the individual contributions of ppERK1 and ppERK2 to proliferation for integrated responses observed in wild-type cells, cells over-expressing ERK1, and cells over-expressing ERK2. Recent studies using siRNA-mediated knock down of ERK1 and ERK2 in cell lines (Lefloch et al, 2008) suggested that the overall ERK activation level correlates with proliferation. By our mathematical modelling approach based on data derived from primary cells, we could pinpoint the individual contribution of each isoform to proliferation. We show that the proliferative response curve supported by activated ERK1 is negative beyond a certain activation level, but that activated ERK2 favours proliferation, even for maximum stimulation. Thus, ERK2 promotes proliferation of CFU-E cells, whereas ERK1 limits it. This is consistent with distinct phenotypes of knockout mice, with ERK2 knockout being lethal, whereas ERK1 knockout mice are viable. As our nonlinear regression model enables us to predict proliferation rates in areas that at present cannot be analysed experimentally, it provides means to guide future experiments. For example, the proliferation values at the origin of the graph where the integrated response of double-phosphorylated ERK is close to zero are in line with genetic studies in mice. Raf-1 deficiency accelerates erythroblast differentiation that depletes the foetal liver of erythroid precursors (Kolbus et al, 2002). Reconstitution with kinase-defective Raf-1 also accelerates differentiation whereas activated Raf-1 delays it (Rubiolo et al, 2006). These results are captured in our model in which removal of Raf-1 sets ERK responses to zero and favours differentiation instead of proliferation.
In summary, our computational model gives new insights into how Epo regulates cell fate decisions in the erythroid lineage. We dissect the roles of the isoforms ERK1 and ERK2 and therefore provide an important basis for systems-oriented drug design (Kitano, 2007), opening new possibilities for interventions against cancer.
Materials and methods
Primary cell cultures and time-course experiments
Primary erythroid progenitor cells of the CFU-E were prepared from foetal livers of 13.5-day-old Balb/c mouse embryos as described earlier (Ketteler et al, 2002). For one experiment, timed matings were performed with 60 male and 120 female Balb/c mice resulting in approximately 20 pregnant mice. Of these approximately 70 × 106 CFU-E cells were obtained sufficient for about 14 time points in a quantitative immunoblotting experiment. Briefly, isolated foetal livers were resuspended in ice-cold phosphate-buffered saline (PBS) supplemented with 0.3% bovine serum albumin (BSA) and passed through a 40 μm cell strainer (BD Biosciences), treated with Red Blood Cell Lysing Buffer (Sigma-Aldrich) to remove erythrocytes and washed by centrifugation through 0.3% BSA/PBS. For negative depletion, foetal liver cells were incubated with rat antibodies against the following surface markers: GR1, CD41, CD11b, CD14, CD45, CD45R/B220, CD4, CD8 (all purchased from BD Pharmingen), Ter119 (gift from Albrecht Müller, Julius-Maximilians-University, Würzburg, Germany), and with the rat monoclonal antibody YBM/42 (gift from Suzanne M Watt, University of Oxford, Oxford, UK) for 30 min at 4°C. Cells were washed three times in 0.3% BSA/PBS and were incubated for 30 min at 4°C with anti-rat antibody-coupled magnetic beads and negative sorted with magnetic activated cell sorting (MACS) columns according to the manufacturer's instructions (Miltenyi Biotech). For highly sampled time-course experiments, isolated CFU-E cells were frozen in liquid nitrogen in 90% FCS/10% DMSO and several isolations were pooled before cultivation. CFU-E cells were cultivated for 16 h in Iscove's Modified Dulbecco's Medium (IMDM; Invitrogen), 30% foetal calf serum, and 50 μM β-mercaptoethanol supplemented with 0.5 U/ml Epo (Cilag-Jansen). CFU-E cells cultivated for 16 h were starved in Panserin 401 (PAN Biotech) supplemented with 1 mg/ml BSA (Sigma-Aldrich) for 1 h and were stimulated with 50 U/ml Epo (Cilag-Jansen). For each time point, 8 × 10⁶ cells were taken from the pool of cells and lysed by adding 2 × Nonidet P-40 lysis buffer, thereby terminating the reaction. For over-expression experiments, retroviral transduction (10–30% efficiency) was combined with MACS of transduced cells resulting in cellular material for one or two time points.
Quantitative immunoblotting and computational data processing
For immunoprecipitation, 2 ng of GST-EpoR and 18 ng of GST-JAK2 were added as calibrator to each cytosolic lysate. The lysates were incubated with anti-EpoR antibodies (Santa Cruz) and anti-JAK2 serum (Upstate Millipore). For cellular lysates, protein concentrations were measured using BCA assay (Pierce). Immunoprecipitated proteins and 50 μg of cellular lysates were loaded in a randomised manner on an SDS–polyacrylamide gel as described elsewhere (Schilling et al, 2005b), separated by electrophoresis and transferred to PVDF or nitrocellulose membranes. Proteins were immobilised with Ponceau S solution (Sigma-Aldrich) followed by immunoblotting analysis using the anti-phosphotyrosine monoclonal antibody 4G10 (Upstate Biotechnology), the anti-double-phosphorylated MEK1/2 antibody (Cell Signalling Technologies), or the anti-SOS-1 antibody (Santa Cruz). Antibodies were removed by treating the blots with β-mercaptoethanol and SDS as described earlier (Klingmüller et al, 1995). Reprobes were performed using anti-EpoR antibody (Santa Cruz), anti-JAK2 serum (Upstate), anti-double-phosphorylated p44/42 MAPK, anti-p44/42 MAPK, and anti-MEK1/2 antibodies (all Cell Signalling). For normalisation, antibodies against β-actin (Sigma-Aldrich) and Clathrin HC (Santa Cruz) were used. The antibodies used to confirm specificity of the polyclonal antibodies were monoclonal antibodies that specifically only recognise the double-phosphorylated MEK (Cell Signaling #9154, rabbit monoclonal antibody, clone 41G9) or the double-phosphorylated ERK (Sigma M9692, mouse monoclonal antibody, clone MAPK-YT) and do not cross-react with single-phosphorylated species according to the manufacturers. Secondary horseradish peroxidase-coupled antibodies (anti-rabbit HRP, anti-goat HRP, protein A HRP) were purchased from Amersham Biosciences. Immunoblots were incubated with ECL substrate (Amersham) for 1 min and exposed for 10 min on a LumiImager (Roche Diagnostics) or with ECL Advance substrate (Amersham) for 2 min and exposed for 1 min on a LumiImager. Data were quantified using LumiAnalyst software (Roche Diagnostics).
To analyse whether a possible cross-reaction with single-phosphorylated MEK/ERK would affect our results, we stimulated primary CFU-E cells for different times and loaded the cellular lysates on two gels in triplicates. The first blot was analysed with the polyclonal antibodies that were used in this study, the second blot with monoclonal antibodies that specifically only recognise double-phosphorylated MEK or double-phosphorylated ERK and do not cross-react with the single-phosphorylated species (Supplementary Figure 3A). Quantification of the results showed that both types of antibodies result in comparable dynamics (Supplementary Figure 3B) and we show that a strong and linear correlation of the results is obtained with the polyclonal antibodies and the monoclonal antibodies (Supplementary Figure 3C).
Quantitative immunoblotting data were processed using GelInspector software (Schilling et al, 2005a). The following normalisers were used: GST-JAK2 for pJAK2 and JAK2, GST-EpoR for pEpoR and EpoR, β-actin for ppERK1, ppERK2, ERK1 and ERK2, and Clathrin HC for pSOS and SOS. For first estimates, MATLAB csaps-splines were used with a smoothness of 0.2 for pJAK2, JAK2, pEpoR, and EpoR; 0.5 for ppERK1, ppERK2, ERK1, and ERK2, and 0.3 for pSOS and SOS. As the values for pSOS had a rather high background, the lowest value of the time course was subtracted from all data points. In case of biological replicates (Figure 5A), the mean values of the respective replicates were used as first estimate. To calculate phosphorylation levels after over-expression of ERK1 and ERK2, we subtracted the lowest value of the time course from each technical replicate (N=3). The values of double-phosphorylated ERK1 and ERK2 of each replicate were scaled to the theoretically predicted number of phosphorylated molecules per cell using the two highest values as reference followed by calculation of mean values and standard deviations. Similarly, the measured phosphorylation levels of JAK2 (mean value and standard deviations of three biological replicates) were background corrected and scaled to the theoretically predicted number of phosphorylated molecules per cell using the three highest values as reference.
Mathematical modelling, parameter estimation, and simulations
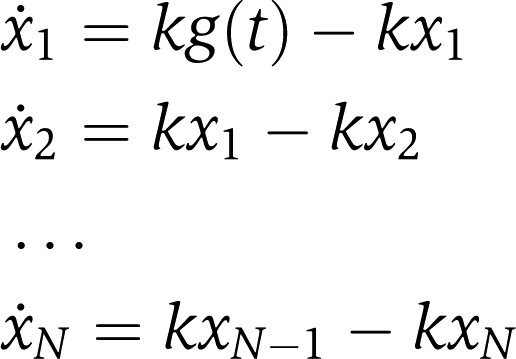
The model was developed and calibrated using the Matlab toolbox PottersWheel (Maiwald and Timmer, 2008). The linear chain trick method (MacDonald 1976) was used to model a soft delay. In delay differential equations a system variable depends on an earlier time point, that is x(t)=g(t−τ). It was proven earlier (supplement of Maiwald and Timmer, 2008) using Laplace transformations that the delay can be approximated by setting x(t)=xN(t) and determining xN(t) by an additional set of reactions, referred to as linear chain:
 |
Error bars for model calibration were estimated using a smoothing spline approach. In highly sampled time-series experiments, the standard deviation of a data point can be estimated either based on repeated measurements for the same time point or by a sliding window approach, using the information that the true signal is time continuous and therefore ‘smooth'. The latter case was applied for the data depicted in Figure 1B. The mean deviation between the measurements y and an approximation of the true signal  based on a smoothing spline was determined as
The window size was set to 5, that is h=2. As a spline algorithm, csaps from the Matlab spline toolbox has been used with stiffness 0.05. See Supplementary Figure 6B for estimated standard deviations.
Parameters were estimated in logarithmic parameter space, based on a deterministic trust-region algorithm. For each fit up to 100 iterations were performed with a χ2 tolerance of 10−7 and fit parameters tolerance of 10−7. Using the best fit as starting value, 1000 fits were carried out, each time varying all parameters with a disturbance strength s of 0.4 corresponding to pnew=pold × 10(s × ɛ), with ɛ being normally distributed with mean 0 and variance 1. Initial values for EpoR, JAK2, MEK1, and MEK2 were fixed to the values determined by saturation binding or quantitative immunoblotting divided by 104. By analysing the fraction of shifted ERK1 and ERK2 on the immunoblot, we calculated a maximum fraction of 30% being in either the mono- or double-phosphorylated state. Thus, we included the following constraints in the model: (pERK1+ppERK1)max/ERK1max=0.3 and (pERK2+ppERK2)max/ERK2max=0.3. We determined by mass spectrometry that a maximum fraction of 20% is in the mono- and 10% is in the double-phosphorylated state. We therefore refined the constraints accordingly (Supplementary Figure 1).
The effect of enzyme saturation was analysed by establishing two additional models by adding complex formation to the phosphorylation reactions of MEK and ERK as shown in Supplementary Figure 6A. Parameters for these models were estimated using PottersWheel and the best fit of each model was analysed (Supplementary Figure 6B). The χ2-value and the AIC were calculated and a log-likelihood-ratio test was performed (Supplementary Figure 6C). As AIC favoured the distributive model and the log-likelihood-ratio test rejected the complex distributive model, we focused subsequent analyses on the distributive model.
Model simulations of over-expressing ERK1 and ERK2 were performed using PottersWheel by multiplying the initial values of ERK1 and ERK2 by the determined over-expression levels and plotting the dynamics of double-phosphorylated ERK1 and ERK2.
The mathematical model presented here will be made available to the public on the BioModels Database (http://www.ebi.ac.uk/biomodels).
Label-free quantitative mass spectrometry
The regulatory phosphorylation sites of ERK1 and ERK2 are located in a single tryptic peptide of about 2 kDa in size. The corresponding sequences of these peptides are IADPEHDHTGFLTEYVATR for ERK1 and VADPDHDHTGFLTEYVATR for ERK2 (phosphorylated residues are underscored). The two peptides differ only by two homologous amino acid exchanges (ERK1 → ERK2; I → V and E → D) at and near their N-terminus. As a result, the molecular weight of the ERK2 peptide is reduced by 28 Da relative to that of the ERK1 peptide. The two phosphorylated positions are T202/Y204 for ERK1 and T182/Y184 for ERK2 (counted without the N-terminal Met residue). As a basis for the safe identification of the in vivo phosphorylation status of ERK, four synthetic tryptic ERK2 peptides were generated, representing the non-phosphorylated species (-TEY-) and all possible phosphorylation states (-TEpY-, -pTEY-, -pTEpY-). These peptides were investigated with respect to their UPLC elution, collision-induced dissociation, and relative ionisation efficiency. The MS/MS spectra for the phosphorylated peptides are shown in Supplementary Figures 8 and 9A. According to the MS/MS spectra, all three phosphopeptides could be reliably identified because of the clear sequence information covering the phosphorylated region (Supplementary Figure 8A) and because of reporter fragmentations for pT and pY, respectively (Supplementary Figures 8B and 9A). The neutral loss of phosphoric acid is visible for the pT-containing peptides (Supplementary Figure 8B upper and lower panels), whereas it is absent for the pY-mono-phosphopeptide (Supplementary Figure 8B, middle panel). The pY immonium ion is visible for the pY-containing peptides (Supplementary Figure 9A, middle and lower panel), whereas it is absent for the pT-mono-phosphopeptide (Supplementary Figure 9A, upper panel). Using UPLC-MS, detection of the differently phosphorylated forms is facilitated because the ERK-derived tryptic phosphopeptides are separated, including the two structural isomers of the mono-phosphosphorylated species (Supplementary Figure 9B). The elution order observed for both the ERK1 and ERK2 tryptic peptides was -TEpY-, -pTEpY-, -TEY-, -pTEY-.
Following these basic investigations using synthetic peptides, ERK isolated from foetal mouse liver by a combination of immunoprecipitation and 1D gel electrophoresis was analysed by UPLC-MS. Gel-isolated proteins were reduced in the gel, alkylated with iodoacetamide, and digested with trypsin as recommended by the manufacturer (Roche). Samples were prepared according to standard protocols (Shevchenko et al, 2006) and citrate was added to a final concentration of 50 mM (Winter et al, 2009). Analysis was performed by UPLC (nanoAcquity, Waters) coupled to a Q-TOF-2 mass spectrometer (Waters). The chromatographic column used was of the type nanoACQUITY UPLC BEH 130-C18, 1.7 μm (particle size), 100 μm (i.d.) × 100 mm (length). Solvent A: water, 0.1% formic acid; B: acetonitrile, 0.1% formic acid. No trap column was used. After injection, 1% B was delivered for 24 min at a flow rate of 400 nl/min; then a linear gradient from 1% B to 30% B in 30 min was started. Data were evaluated by MassLynx 4.1 and MASCOT 2.2.
The results are displayed in Figure 2C, in which the data of ERK1 and ERK2 are combined so that the changes in the phosphorylation status following stimulation are visualised. First, it was recognised that mono-phosphorylation almost exclusively exists on tyrosine, as the species carrying only the pT residue was undetectable. The second finding was that after stimulation, single and double phosphorylation increases both in ERK1 and ERK2. The third observed detail was that the mono-phosphorylated species prevails over the double-phosphorylated species both before and after stimulation. Finally, the data in Figure 2C show that before stimulation the non-phosphorylated species prevail, whereas their abundances are reduced to about 70% after stimulation. For the conversion of the relative ion intensities as given in Figure 2B to relative molar abundances, correction factors are required to compensate for the individual recoveries of the non-, mono(pY)-, and double-phosphopeptides by the UPLC separation and for an individual ionisation efficiency during ESI. The UPLC correction factors were determined by recording the ion intensities of a mixture of the non-, mono(pY)-, and double-phosphopeptide by nanoESI-MS and by UPLC-MS separation. A set of the tryptic ERK2 peptides VADPDHDHTGFLTEYVATR, VADPDHDHTGFLTEpYVATR, and VADPDHDHTGFLpTEpYVATR were used. Two correction factors were determined, compensating the individual UPLC recovery and the individual ESI efficiency, respectively. In each case, the signal intensity of the phospho-species was normalised to that of the non-phosphorylated analogue. The relative UPLC recovery was determined by comparing the signal intensities of a roughly equimolar three-component mixture measured by nanoESI-MS and by UPLC-MS. The relative ionisation efficiencies of the three compounds were determined by analysing an equimolar two-component mixture containing the mono- or double-phosphorylated peptide and the non-phosphorylated analogue. The correction factors were summarised into a combined correction factor (see Supplementary Figure 9C), which was used to convert the experimental data. The correction factor determined on the basis of synthetic ERK2 peptides was also applied for correcting the ERK1 data, as the two peptides differ only by two homologous exchanges (I → V and E → D). In this way, a somewhat higher recovery for the two phosphopeptides relative to the non-phosphorylated species was observed. The corresponding relative ESI efficiencies were determined by analysing an equimolar mixture of the non-phosphorylated peptide with the corresponding single or double-phosphorylated analogue, respectively. The ionisation efficiency of both phosphorylated species was found to be in excess of the non-phosphorylated peptide. This finding is in agreement with earlier observations on peptides carrying several basic groups (Steen et al, 2005). In this way, combined correction factors of 1.67 and 1.51 were obtained for the -TEpY- and -pTEpY- peptide, respectively, normalised to the behaviour of the non-phosphorylated analogue. Supplementary Table 1 summarises the relative molar abundances of the differently phosphorylated species of ERK1 and ERK2 as calculated from the experimental data using these correction factors.
It would be useful to analyse the phosphorylation status of MEK by a similar strategy, however, in primary erythroid progenitor cells only about 1.5% of MEK is phosphorylated at maximum stimulation (Supplementary Figure 12B), cf. with 5% in HeLa cells stimulated with excess EGF (Fujioka et al, 2006). Unfortunately, this results in a concentration that was below the detection limit of our quantitative MS methods.
Non-identifiability analysis
Most models are non-identifiable, that is model parameters exist that cannot be determined unambiguously. Often, non-identifiability manifests itself in functionally related parameters (see linear relationships, hyperbolas, and two-dimensional surfaces in Supplementary Figure 11). However, sensitivity analysis is a local approach because derivations are evaluated at a certain point in parameter space. Thus, without prior knowledge, it can in principle not be determined statistically at which point in parameter space sensitivity analysis has to be performed. To deal with this problem, we took the following approach: The model was fitted 1000 times to the experimental data. Each fit yielded different estimates for the non-identifiable parameters. Non-identifiabilities were detected by non-parametric bootstrap-based identifiability testing with the mean optimal transformation approach (Hengl et al, 2007), and sensitivies were calculated at the actual point along the non-identifiability, here the linear relationships, the hyperbolas, and the two-dimensional surfaces. As the derived system variables are invariant to changes along the non-identifiabilities, the results of the sensitivity analysis for identifiable parameters do not depend on the values we chose for the non-identifiable parameters. Another strategy would be to calculate derived parameters (e.g. the ratio between two parameters that are linearly dependent). These parameters are identifiable and can be used for sensitivity analysis.
Sensitivity analysis
Sensitivity analysis was used to investigate relative changes of derived system quantities K as a result of relative changes in parameter values pi
We analysed: peak amplitude (the concentration at the maximum); integrated response (area under the curve from stimulation start to the time when the curve drops to 10% of its maximum); peak time (time at the maximum); and duration (distance between the time when the curve first reaches 10% of its maximum and the time it drops to 10% of its maximum). Hornberg et al (2005a) derived summation laws for sensitivies of derived system quantities such as signal amplitude, signal duration, and integrated response. The proofs for the summation laws (Hornberg et al, 2005b) can be extended to show the existence of summation laws for the system quantities investigated in our approach:
Plasmids and retroviral transduction
ERK1, ERK2, and AKT1 cDNAs were cloned into the retroviral expression vector pMOWSnrMCS, which is a derivative of pMOWS (Ketteler et al, 2002), in which the puromycin resistance gene was replaced by the LNGFR cDNA (Miltenyi Biotech) that allows magnetic bead selection of transduced cells. To generate retroviral expression vectors, a multiple cloning site with the restriction sites BamHI, PacI, PmlI, EcoRI, NdeI, and BclI was introduced into the BamHI EcoRI locus of pMOWS (Ketteler et al, 2002). Furthermore, the puromycin resistance cassette was replaced by HindIII AfeI digestion with the LNGFR cDNA (Miltenyi Biotech), resulting in the vector pMOWSnrMCS (vector control). The cDNA of ERK1 was cloned into pMOWSnrMCS by digesting pGEX-ERK1 (Klingmüller et al, 1997) with BamHI and EcoRI, resulting in pMOWSnr-ERK1 (ERK1). The cDNA of ERK2 was cloned into pMOWSnrMCS by PCR amplification of pcDNA3-HA-ERK2 (kind gift of John Blenis, Harvard Medical School, Boston, MA) and digestion with BamHI and NdeI resulting in pMOWSnr-ERK2 (ERK2). ERK cDNAs are of rat origin, with 100% amino acid identity to mouse. The cDNA of murine AKT1 was cloned into pMOWSnrMCS by PCR amplification of pCMV-AKT1 (kind gift of Thomas F Franke, New York University School of Medicine, New York, NY) and digestion with BamHI and EcoRI resulting in pMOWSnr-AKT1 (AKT). Retroviral expression vectors were transiently transfected into Phoenix-eco cells using the calcium-phosphate method (Ketteler et al, 2002). Six hours after transfection of Phoenix cells, the medium was changed to IMDM containing 50 μM β-mercaptoethanol and 30% foetal calf serum. Twenty-four hours after transfection, the virus-containing supernatant was collected and filtered through a 0.45-μm filter. For over-expression experiments, spin infection was performed by adding 4.5 ml of supernatant containing 8 μg/ml Polybrene (Sigma-Aldrich) to 5 × 10⁶ CFU-E cells in 500 μl Panserin 401 (PAN Biotech) and centrifuging for 2 h in a Heraeus centrifuge with 2500 r.p.m. at room temperature. The cells were washed three times with Panserin 401 and seeded in Panserin 401 supplemented with 0.5 U/ml Epo and cultured for 16 h. Positive selection was performed using MACSelect LNGFR selection kit (Miltenyi Biotech) according to the manufacturer's instructions.
Thymidine incorporation
IMDM/sct was prepared by supplementing IMDM (Invitrogen) with 15% foetal calf serum, 1% BSA (Sigma-Aldrich), 200 μg/ml hHolo-Transferrin, 10 μg/ml insulin, 50 ng/μl rmSCF, 10 ng/ml rmIL-3, 10 ng/ml rhIL-6 (all from R&D), and 10 U/ml Epo (Cilag-Jansen). Spin infection was performed by adding 4.5 ml of supernatant containing 8 μg/ml Polybrene (Sigma-Aldrich) to cells isolated from three foetal livers in 500 μl IMDM/sct (PAN Biotech, Aidenbach, Germany) and centrifuging for 2 h in a Heraeus centrifuge with 2500 r.p.m. at room temperature. The cells were seeded in IMDM/sct and cultured for 18 h. CFU-E cells were sorted by negative selection as described above. Positive selection was performed using MACSelect LNGFR selection kit (Miltenyi Biotech, Bergisch-Gladbach, Germany) according to the manufacturer's instructions. 2 × 10⁴ LNGFR-positive cells were cultivated in Panserin 401 supplemented with 0.001, 0.005, 0.01, 0.05, 0.1, 0.5, 1, 5, 10, or 50 U/ml Epo for 4 h. [3H]-thymidine was added and cells were cultivated for 14 h. Cells were collected and the incorporated radioactivity was measured using a scintillation counter. Regression lines are calculated with a four-parameter Hill regression (y=y0+(axb/cb/xb). As the logarithmic transformation is a monotonic transformation, the sigmoidality of the curve is also true for a linear axis.
FACS analysis of transduced erythroid progenitor cells
For FACS analysis, transduced CFU-E cells cultivated for 24 h were positive selected using MACSelect LNGFR selection kit (Miltenyi Biotechy) according to the manufacturer's instructions. LNGFR-positive cells were cultivated in Panserin 401 for another 24 h. Cells were stained with APC-conjugated anti-Ter119 antibody (eBioscience) and a Biotin-conjugated anti-CD71 antibody (BD Pharmingen) in combination with PerCP-conjugated streptavidin (BD Pharmingen). For haemoglobin content, cells were permeabilised and stained with an anti-haemoglobin α antibody (Santa Cruz) in combination with a FITC-conjugated anti-goat secondary antibody (DakoCytomation). Gated cells were analysed for haemoglobin α and CD71/Ter119 surface marker expression by a FACSCalibur (BD Biosciences) and analysed with CellQuest Software (BD Biosciences).
Link of ERK responses to erythroid progenitor proliferation
Different input scenarios were simulated by changing the input function of the model accordingly and calculating the integrated response of double-phosphorylated ERK1 and ERK2. Similarly, the initial values of ERK1 or ERK2 were multiplied threefold and integrated responses were obtained. To link these integrated responses of double-phosphorylated ERK1 and ERK2 to erythroid progenitor proliferation, we used the following quasi-non-parametric, generalised additive model:
thy denotes incorporated [3H]-thymidine ( × 104 c.p.m.), ir.ppERK1 and ir.ppERK2 denote integrated response of double-phosphorylated ERK1 and ERK2, respectively (min × 104 molecules/cell), and s denotes a spline function that has to be estimated (Wood, 2003). The model includes an offset that has to be estimated, too. We chose a thin-plate regression spline. As both splines may only be estimated up to a constant, an additional identifiability constraint—the offset of one of the spline functions is set to zero—is imposed on the model before fitting. The problem can then be formulated as a linear model, the (basis) parameters are estimated by minimising least squares penalised with the wiggliness of the curves. Statistical and graphical analysis of the model was performed with R (R-project, http://www.r-project.org).
Supplementary Material
Supplementary Tables S1–2, Supplementary Figures S1–14
SBML Model File
Acknowledgments
We thank John Blenis, Melanie Cobb, and Jacques Pouysségur for the generous gifts of cDNAs and Véronique Lefebvre for providing the protocols for haemoglobinisation assays. We also thank Ute Baumann and Sandra Manthey for excellent technical assistance. We acknowledge funding by the EU FP6 project ‘Computational Systems Biology of Cell Signalling' (LSHG-CT-2004-512060), the SBCancer network in the Helmholtz Alliance on Systems Biology, Cancer Research UK, the cooperation program in cancer research of the German Cancer Research Center (DKFZ) and Israel's Ministry of Science and Technology (MOST) and the Excellence Initiative of the German Federal and State Governments.
Footnotes
The authors declare that they have no conflict of interest.
References
- Alessandrini A, Greulich H, Huang W, Erikson RL (1996) Mek1 phosphorylation site mutants activate Raf-1 in NIH 3T3 cells. J Biol Chem 271: 31612–31618 [DOI] [PubMed] [Google Scholar]
- Alessi DR, Saito Y, Campbell DG, Cohen P, Sithanandam G, Rapp U, Ashworth A, Marshall CJ, Cowley S (1994) Identification of the sites in MAP kinase kinase-1 phosphorylated by p74raf-1. EMBO J 13: 1610–1619 [DOI] [PMC free article] [PubMed] [Google Scholar]
- Altan-Bonnet G, Germain RN (2005) Modeling T cell antigen discrimination based on feedback control of digital ERK responses. PLoS Biol 3: e356. [DOI] [PMC free article] [PubMed] [Google Scholar]
- Asthagiri AR, Reinhart CA, Horwitz AF, Lauffenburger DA (2000) The role of transient ERK2 signals in fibronectin- and insulin-mediated DNA synthesis. J Cell Sci 113: 4499–4510 [DOI] [PubMed] [Google Scholar]
- Behrmann I, Smyczek T, Heinrich PC, Schmitz-Van de Leur H, Komyod W, Giese B, Muller-Newen G, Haan S, Haan C (2004) Janus kinase (Jak) subcellular localization revisited: the exclusive membrane localization of endogenous Janus kinase 1 by cytokine receptor interaction uncovers the Jak.receptor complex to be equivalent to a receptor tyrosine kinase. J Biol Chem 279: 35486–35493 [DOI] [PubMed] [Google Scholar]
- Belanger LF, Roy S, Tremblay M, Brott B, Steff AM, Mourad W, Hugo P, Erikson R, Charron J (2003) Mek2 is dispensable for mouse growth and development. Mol Cell Biol 23: 4778–4787 [DOI] [PMC free article] [PubMed] [Google Scholar]
- Blake TJ, Jenkins BJ, D'Andrea RJ, Gonda TJ (2002) Functional cross-talk between cytokine receptors revealed by activating mutations in the extracellular domain of the beta-subunit of the GM-CSF receptor. J Leukoc Biol 72: 1246–1255 [PubMed] [Google Scholar]
- Bos JL (1989) Ras oncogenes in human cancer: a review. Cancer Res 49: 4682–4689 [PubMed] [Google Scholar]
- Bouscary D, Pene F, Claessens YE, Muller O, Chretien S, Fontenay-Roupie M, Gisselbrecht S, Mayeux P, Lacombe C (2003) Critical role for PI 3-kinase in the control of erythropoietin-induced erythroid progenitor proliferation. Blood 101: 3436–3443 [DOI] [PubMed] [Google Scholar]
- Brandman O, Meyer T (2008) Feedback loops shape cellular signals in space and time. Science 322: 390–395 [DOI] [PMC free article] [PubMed] [Google Scholar]
- Buday L, Warne PH, Downward J (1995) Downregulation of the Ras activation pathway by MAP kinase phosphorylation of Sos. Oncogene 11: 1327–1331 [PubMed] [Google Scholar]
- Burack WR, Sturgill TW (1997) The activating dual phosphorylation of MAPK by MEK is nonprocessive. Biochemistry 36: 5929–5933 [DOI] [PubMed] [Google Scholar]
- Chang L, Karin M (2001) Mammalian MAP kinase signalling cascades. Nature 410: 37–40 [DOI] [PubMed] [Google Scholar]
- Csete M, Doyle J (2004) Bow ties, metabolism and disease. Trends Biotechnol 22: 446–450 [DOI] [PubMed] [Google Scholar]
- Dhillon AS, Hagan S, Rath O, Kolch W (2007) MAP kinase signalling pathways in cancer. Oncogene 26: 3279–3290 [DOI] [PubMed] [Google Scholar]
- Dougherty MK, Muller J, Ritt DA, Zhou M, Zhou XZ, Copeland TD, Conrads TP, Veenstra TD, Lu KP, Morrison DK (2005) Regulation of Raf-1 by direct feedback phosphorylation. Mol Cell 17: 215–224 [DOI] [PubMed] [Google Scholar]
- Eblen ST, Slack-Davis JK, Tarcsafalvi A, Parsons JT, Weber MJ, Catling AD (2004) Mitogen-activated protein kinase feedback phosphorylation regulates MEK1 complex formation and activation during cellular adhesion. Mol Cell Biol 24: 2308–2317 [DOI] [PMC free article] [PubMed] [Google Scholar]
- Ferrell JE Jr, Bhatt RR (1997) Mechanistic studies of the dual phosphorylation of mitogen-activated protein kinase. J Biol Chem 272: 19008–19016 [DOI] [PubMed] [Google Scholar]
- Fujioka A, Terai K, Itoh RE, Aoki K, Nakamura T, Kuroda S, Nishida E, Matsuda M (2006) Dynamics of the Ras/ERK MAPK cascade as monitored by fluorescent probes. J Biol Chem 281: 8917–8926 [DOI] [PubMed] [Google Scholar]
- Ghaffari S, Kitidis C, Zhao W, Marinkovic D, Fleming MD, Luo B, Marszalek J, Lodish HF (2006) AKT induces erythroid-cell maturation of JAK2-deficient fetal liver progenitor cells and is required for Epo regulation of erythroid-cell differentiation. Blood 107: 1888–1891 [DOI] [PMC free article] [PubMed] [Google Scholar]
- Giese B, Au-Yeung CK, Herrmann A, Diefenbach S, Haan C, Kuster A, Wortmann SB, Roderburg C, Heinrich PC, Behrmann I, Muller-Newen G (2003) Long term association of the cytokine receptor gp130 and the Janus kinase Jak1 revealed by FRAP analysis. J Biol Chem 278: 39205–39213 [DOI] [PubMed] [Google Scholar]
- Giroux S, Tremblay M, Bernard D, Cardin-Girard JF, Aubry S, Larouche L, Rousseau S, Huot J, Landry J, Jeannotte L, Charron J (1999) Embryonic death of Mek1-deficient mice reveals a role for this kinase in angiogenesis in the labyrinthine region of the placenta. Curr Biol 9: 369–372 [DOI] [PubMed] [Google Scholar]
- Heinrich R, Neel BG, Rapoport TA (2002) Mathematical models of protein kinase signal transduction. Mol Cell 9: 957–970 [DOI] [PubMed] [Google Scholar]
- Hengl S, Kreutz C, Timmer J, Maiwald T (2007) Data-based identifiability analysis of non-linear dynamical models. Bioinformatics 23: 2612–2618 [DOI] [PubMed] [Google Scholar]
- Hornberg JJ, Binder B, Bruggeman FJ, Schoeberl B, Heinrich R, Westerhoff HV (2005a) Control of MAPK signalling: from complexity to what really matters. Oncogene 24: 5533–5542 [DOI] [PubMed] [Google Scholar]
- Hornberg JJ, Bruggeman FJ, Binder B, Geest CR, de Vaate AJ, Lankelma J, Heinrich R, Westerhoff HV (2005b) Principles behind the multifarious control of signal transduction. ERK phosphorylation and kinase/phosphatase control. FEBS J 272: 244–258 [DOI] [PubMed] [Google Scholar]
- Huang CY, Ferrell JE Jr (1996) Ultrasensitivity in the mitogen-activated protein kinase cascade. Proc Natl Acad Sci USA 93: 10078–10083 [DOI] [PMC free article] [PubMed] [Google Scholar]
- Huang LJ, Constantinescu SN, Lodish HF (2001) The N-terminal domain of Janus kinase 2 is required for Golgi processing and cell surface expression of erythropoietin receptor. Mol Cell 8: 1327–1338 [DOI] [PubMed] [Google Scholar]
- Jelkmann W (2004) Molecular biology of erythropoietin. Intern Med 43: 649–659 [DOI] [PubMed] [Google Scholar]
- Ketteler R, Glaser S, Sandra O, Martens UM, Klingmüller U (2002) Enhanced transgene expression in primitive hematopoietic progenitor cells and embryonic stem cells efficiently transduced by optimized retroviral hybrid vectors. Gene Ther 9: 477–487 [DOI] [PubMed] [Google Scholar]
- Kholodenko BN (2007) Untangling the signalling wires. Nat Cell Biol 9: 247–249 [DOI] [PMC free article] [PubMed] [Google Scholar]
- Kitano H (2007) A robustness-based approach to systems-oriented drug design. Nat Rev Drug Discov 6: 202–210 [DOI] [PubMed] [Google Scholar]
- Kitano H, Funahashi A, Matsuoka Y, Oda K (2005) Using process diagrams for the graphical representation of biological networks. Nat Biotechnol 23: 961–966 [DOI] [PubMed] [Google Scholar]
- Klingmüller U, Lorenz U, Cantley LC, Neel BG, Lodish HF (1995) Specific recruitment of SH-PTP1 to the erythropoietin receptor causes inactivation of JAK2 and termination of proliferative signals. Cell 80: 729–738 [DOI] [PubMed] [Google Scholar]
- Klingmüller U, Wu H, Hsiao JG, Toker A, Duckworth BC, Cantley LC, Lodish HF (1997) Identification of a novel pathway important for proliferation and differentiation of primary erythroid progenitors. Proc Natl Acad Sci USA 94: 3016–3021 [DOI] [PMC free article] [PubMed] [Google Scholar]
- Kolbus A, Pilat S, Husak Z, Deiner EM, Stengl G, Beug H, Baccarini M (2002) Raf-1 antagonizes erythroid differentiation by restraining caspase activation. J Exp Med 196: 1347–1353 [DOI] [PMC free article] [PubMed] [Google Scholar]
- Kolch W (2000) Meaningful relationships: the regulation of the Ras/Raf/MEK/ERK pathway by protein interactions. Biochem J 351: 289–305 [PMC free article] [PubMed] [Google Scholar]
- Kortum RL, Lewis RE (2004) The molecular scaffold KSR1 regulates the proliferative and oncogenic potential of cells. Mol Cell Biol 24: 4407–4416 [DOI] [PMC free article] [PubMed] [Google Scholar]
- Langlois WJ, Sasaoka T, Saltiel AR, Olefsky JM (1995) Negative feedback regulation and desensitization of insulin- and epidermal growth factor-stimulated p21ras activation. J Biol Chem 270: 25320–25323 [DOI] [PubMed] [Google Scholar]
- Lefloch R, Pouyssegur J, Lenormand P (2008) Single and combined silencing of ERK1 and ERK2 reveals their positive contribution to growth signaling depending on their expression levels. Mol Cell Biol 28: 511–527 [DOI] [PMC free article] [PubMed] [Google Scholar]
- Levchenko A, Bruck J, Sternberg PW (2000) Scaffold proteins may biphasically affect the levels of mitogen-activated protein kinase signaling and reduce its threshold properties. Proc Natl Acad Sci USA 97: 5818–5823 [DOI] [PMC free article] [PubMed] [Google Scholar]
- Livnah O, Stura EA, Middleton SA, Johnson DL, Jolliffe LK, Wilson IA (1999) Crystallographic evidence for preformed dimers of erythropoietin receptor before ligand activation. Science 283: 987–990 [DOI] [PubMed] [Google Scholar]
- MacDonald N (1976) Time delay in simple chemostat models. Biotechnol Bioeng 18: 805–812 [DOI] [PubMed] [Google Scholar]
- Maiwald T, Timmer J (2008) Dynamical modeling and multi-experiment fitting with PottersWheel. Bioinformatics 24: 2037–2043 [DOI] [PMC free article] [PubMed] [Google Scholar]
- Nakabayashi J, Sasaki A (2005) Optimal phosphorylation step number of intracellular signal-transduction pathway. J Theor Biol 233: 413–421 [DOI] [PubMed] [Google Scholar]
- Nekrasova T, Shive C, Gao Y, Kawamura K, Guardia R, Landreth G, Forsthuber TG (2005) ERK1-deficient mice show normal T cell effector function and are highly susceptible to experimental autoimmune encephalomyelitis. J Immunol 175: 2374–2380 [DOI] [PubMed] [Google Scholar]
- Orton RJ, Sturm OE, Vyshemirsky V, Calder M, Gilbert DR, Kolch W (2005) Computational modelling of the receptor-tyrosine-kinase-activated MAPK pathway. Biochem J 392: 249–261 [DOI] [PMC free article] [PubMed] [Google Scholar]
- Patwardhan P, Miller WT (2007) Processive phosphorylation: mechanism and biological importance. Cell Signal 19: 2218–2226 [DOI] [PMC free article] [PubMed] [Google Scholar]
- Peletier MA, Westerhoff HV, Kholodenko BN (2003) Control of spatially heterogeneous and time-varying cellular reaction networks: a new summation law. J Theor Biol 225: 477–487 [DOI] [PubMed] [Google Scholar]
- Rice J (1984) Bandwidth choice for nonparametric regression. Ann Stat 12: 1215–1230 [Google Scholar]
- Richmond TD, Chohan M, Barber DL (2005) Turning cells red: signal transduction mediated by erythropoietin. Trends Cell Biol 15: 146–155 [DOI] [PubMed] [Google Scholar]
- Rubiolo C, Piazzolla D, Meissl K, Beug H, Huber JC, Kolbus A, Baccarini M (2006) A balance between Raf-1 and Fas expression sets the pace of erythroid differentiation. Blood 108: 152–159 [DOI] [PubMed] [Google Scholar]
- Saba-El-Leil MK, Vella FD, Vernay B, Voisin L, Chen L, Labrecque N, Ang SL, Meloche S (2003) An essential function of the mitogen-activated protein kinase Erk2 in mouse trophoblast development. EMBO Rep 4: 964–968 [DOI] [PMC free article] [PubMed] [Google Scholar]
- Sakamoto H, Kitamura T, Yoshimura A (2000) Mitogen-activated protein kinase plays an essential role in the erythropoietin-dependent proliferation of CTLL-2 cells. J Biol Chem 275: 35857–35862 [DOI] [PubMed] [Google Scholar]
- Santos SD, Verveer PJ, Bastiaens PI (2007) Growth factor-induced MAPK network topology shapes Erk response determining PC-12 cell fate. Nat Cell Biol 9: 324–330 [DOI] [PubMed] [Google Scholar]
- Sasagawa S, Ozaki Y, Fujita K, Kuroda S (2005) Prediction and validation of the distinct dynamics of transient and sustained ERK activation. Nat Cell Biol 7: 365–373 [DOI] [PubMed] [Google Scholar]
- Schilling M, Maiwald T, Bohl S, Kollmann M, Kreutz C, Timmer J, Klingmüller U (2005a) Computational processing and error reduction strategies for standardized quantitative data in biological networks. FEBS J 272: 6400–6411 [DOI] [PubMed] [Google Scholar]
- Schilling M, Maiwald T, Bohl S, Kollmann M, Kreutz C, Timmer J, Klingmüller U (2005b) Quantitative data generation for systems biology: the impact of randomisation, calibrators and normalisers. IEE Proc Syst Biol 152: 193–200 [DOI] [PubMed] [Google Scholar]
- Schilling M, Pfeifer AC, Bohl S, Klingmuller U (2008) Standardizing experimental protocols. Curr Opin Biotechnol 19: 354–359 [DOI] [PubMed] [Google Scholar]
- Schoeberl B, Eichler-Jonsson C, Gilles ED, Muller G (2002) Computational modeling of the dynamics of the MAP kinase cascade activated by surface and internalized EGF receptors. Nat Biotechnol 20: 370–375 [DOI] [PubMed] [Google Scholar]
- Shevchenko A, Tomas H, Havlis J, Olsen JV, Mann M (2006) In-gel digestion for mass spectrometric characterization of proteins and proteomes. Nat Protoc 1: 2856–2860 [DOI] [PubMed] [Google Scholar]
- Steen H, Jebanathirajah JA, Springer M, Kirschner MW (2005) Stable isotope-free relative and absolute quantitation of protein phosphorylation stoichiometry by MS. Proc Natl Acad Sci USA 102: 3948–3953 [DOI] [PMC free article] [PubMed] [Google Scholar]
- Stefanova I, Hemmer B, Vergelli M, Martin R, Biddison WE, Germain RN (2003) TCR ligand discrimination is enforced by competing ERK positive and SHP-1 negative feedback pathways. Nat Immunol 4: 248–254 [DOI] [PubMed] [Google Scholar]
- Ubersax JA, Ferrell JE Jr (2007) Mechanisms of specificity in protein phosphorylation. Nat Rev Mol Cell Biol 8: 530–541 [DOI] [PubMed] [Google Scholar]
- Vanderkuur JA, Butch ER, Waters SB, Pessin JE, Guan KL, Carter-Su C (1997) Signaling molecules involved in coupling growth hormone receptor to mitogen-activated protein kinase activation. Endocrinology 138: 4301–4307 [DOI] [PubMed] [Google Scholar]
- Windisch MP, Frese M, Kaul A, Trippler M, Lohmann V, Bartenschlager R (2005) Dissecting the interferon-induced inhibition of hepatitis C virus replication by using a novel host cell line. J Virol 79: 13778–13793 [DOI] [PMC free article] [PubMed] [Google Scholar]
- Winter D, Seidler J, Ziv Y, Shiloh Y, Lehmann WD (2009) Citrate boosts the performance of phosphopeptide analysis by UPLC-ESI-MS/MS. J Proteome Res 8: 418–424 [DOI] [PubMed] [Google Scholar]
- Wood SN (2003) Thin plate regression splines. J R Stat Soc B 65: 95–114 [Google Scholar]
- Wu DW, Stark KC, Dunnington D, Dillon SB, Yi T, Jones C, Pelus LM (2000) SH2-Containing protein tyrosine phosphatase-1 (SHP-1) association with Jak2 in UT-7/Epo cells. Blood Cells Mol Dis 26: 15–24 [DOI] [PubMed] [Google Scholar]
- Wu H, Liu X, Jaenisch R, Lodish HF (1995) Generation of committed erythroid BFU-E and CFU-E progenitors does not require erythropoietin or the erythropoietin receptor. Cell 83: 59–67 [DOI] [PubMed] [Google Scholar]
- Yoon D, Watowich SS (2003) Hematopoietic cell survival signals are elicited through non-tyrosine-containing sequences in the membrane-proximal region of the erythropoietin receptor (EPOR) by a Stat5-dependent pathway. Exp Hematol 31: 1310–1316 [DOI] [PMC free article] [PubMed] [Google Scholar]
- Zhang J, Lodish HF (2007) Endogenous K-ras signaling in erythroid differentiation. Cell Cycle 6: 1970–1973 [DOI] [PubMed] [Google Scholar]
- Zhao Y, Zhang ZY (2001) The mechanism of dephosphorylation of extracellular signal-regulated kinase 2 by mitogen-activated protein kinase phosphatase 3. J Biol Chem 276: 32382–32391 [DOI] [PubMed] [Google Scholar]
Associated Data
This section collects any data citations, data availability statements, or supplementary materials included in this article.
Supplementary Materials
Supplementary Tables S1–2, Supplementary Figures S1–14
SBML Model File