

Chemically L10-ordered face-centered tetragonal (fct) FePt nanocrystals are of great interest because of their large magnetocrystalline anisotropy,[1,2] which makes them excellent candidates for applications in ultrahigh-density recording media and for use in biological separation.[3–5] There have been considerable efforts to organize FePt nanocrystals for such applications by nanocrystal self-assembly[3] and polymer templating.[6] It has been predicted that fct FePt particles as small as 2.8 nm exhibit sufficiently high ferromagnetic stability against superparamagnetism at room temperature.[7] These ultrasmall ferromagnetic particles could be useful for various high-density applications.
Typical synthetic methods for fct FePt nanocrystals involve the initial formation of chemically disordered face-centered cubic (fcc) FePt nanocrystals grown in solution, followed by annealing at temperatures above 550 °C to convert the fcc into the ordered fct phase.[8,9] The heat treatment, however, causes aggregation and an increase in particle size and size dispersion. Recently, Rong et al. developed a salt-matrix annealing technique to decrease the sintering effects.[10,11] Several direct synthetic methods to fct FePt nanocrystals in solution were reported.[12–14] However, these nanocrystals are only partially ordered in the fct phase with small coercivity. Wellons et al. reported a one-step synthesis of fct FePt nanocrystals by reductive decomposition of a precursor on a water-soluble support (Na2CO3).[15] The size distribution of the synthesized fct FePt nanocrystals was large and broad (5–55 nm). Qiu and Wang prepared ordered fct FePt nanocrystals (size ≈6–7 nm based on TEM data in the paper) by using a gas-phase condensation technique.[16]
Herein we present a simple one-step chemical-vapor-deposition (CVD) method to synthesize ultrasmall (mostly 2–3 nm) L10-ordered fct FePt nanocrystals encapsulated with single- or few-layer carbon shells. The FePt/graphitic carbon nanocrystals exhibit ferromagnetism with relatively high coercivity up to 2.5 kOe at room temperature. This leads to fct FePt nanocrystals at the 2–3-nm size range with useful coercivity. The ultrasmall fct FePt nanocrystals are chemically stable against acid etching and oxidation over long periods of time owing to protection by the encapsulating graphite shell. The graphitic carbon shells are multifunctional in protecting the 2–3-nm fct FePt nanocrystal core (similar to our recently reported FeCo–graphite shell nanocrystals)[17] and in presenting a graphite surface for chemical functionalization to impart biocompatibility and biological functionalities.[17]
Our synthetic procedure for fct FePt-graphite nanocrystals is as follows. The metal precursors Fe(NO3)3 · 9H2O and H2PtCl6 · 9H2O (1:1 molar ratio) were loaded onto high-surface-area silica powder by impregnation in solution in methanol. The metal-loaded silica was dried and heated to 800 °C under H2 and then subjected to methane CVD for carbon deposition on the FePt nanoalloy formed on silica (see Experimental Section for details). Once cooled to room temperature, the powder materials were treated with HF to dissolve the silica support, followed by washing with ethanol and water to obtain pure FePt/graphitic carbon nanocrystals (Figure 1a). The Raman spectrum recorded with a large amount of nanocrystals deposited on the substrate (Figure 1b) provided evidence for graphite shells on the nanocrystals, exhibiting a characteristic graphitic carbon G peak at ≈1600 cm−1 and a disordered D peak at ≈1300 cm−1.
Figure 1.
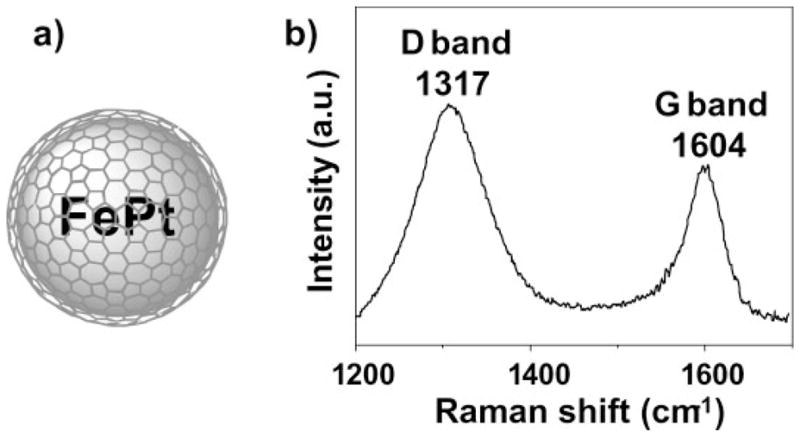
a) Schematic representation of a FePt/graphitic carbon nanocrystal. b) Raman spectrum (laser excitation 785 nm) of ≈2.8-nm FePt/graphitic carbon nanocrystals with the G and D bands of graphitic carbon.
Figure 2a and 2d show the transmission electron microscopy (TEM) images of FePt nanocrystals with average diameters 2.8 ± 0.9 nm and 1.9 ± 0.7 nm, respectively. The average size of the FePt nanocrystals was varied by changing the metal loading on the silica support (see Experimental Section). The mean and standard deviation of the particle sizes were measured by TEM for ≈550 nanocrystals in each sample (see Supporting Information). TEM showed that one or two graphite shells were present on most of the nanocrystals, which resulted from our carbon-deficient CVD synthesis conditions.[17] Such conditions produced few-layer graphite coatings rather than multilayered coatings or carbon nanotubes. It is notable that the low contrast of the carbon shells made it difficult to obtain high-quality high-resolution images of the shells. Evidence for the existence of graphite shells on the fct FePt nanocrystals is provided by the fact that the nanocrystals survived HF etching and by Raman data of graphitic carbon recorded with the nanocrystals (Figure 1b). The high D peak of the Raman spectrum reflects the high strain of the graphite shells due to the small size of the nanocrystals. TEM imaging showed no other form of graphitic carbon in our samples.
Figure 2.

Structural characterization of FePt–graphite shell nanocrystals: a) TEM image. b) Selected-area electron diffraction (SAED) pattern. c) High-resolution TEM image of nanocrystals with an average size of ≈2.8 nm. d) TEM image of nanocrystals with an average size of ≈1.9 nm. e) X-ray diffraction patterns of FePt nanocrystals with average sizes of ≈2.8 and ≈1.9 nm.
We identified a L10-ordered fct FePt core for the nanocrystals with average size ≈2.8 nm by electron diffraction (Figure 2b) and powder X-ray diffraction (XRD, Figure 2e). High-resolution TEM (Figure 2c) clearly showed the lattice fringes of the fct FePt core (d spacing = 2.20 Å and 1.93 Å for (111) and (200) reflections, respectively). The lattice constants for the ≈2.8-nm nanocrystals, c = 3.73 Å and a = 3.85 Å, were calculated from the XRD pattern, which gives a c/a ratio of 0.969. The c/a ratio of the fully L10-ordered FePt is 0.964 and that of the disordered fcc FePt is 1. The c/a ratio of 0.969 is very close to that of the fully L10-ordered FePt and indicates the high degree of ordering of the ≈2.8-nm FePt nanocrystals to the L10 structure. The crystal structure of the FePt nanocrystals with an average size of ≈1.9 nm was not as clear as that of the ≈2.8-nm nanocrystals owing to the broad peaks in the XRD pattern (Figure 2e) and the weak characteristics corresponding to fct FePt structures such as the (110), (201), and (112) features in the electron diffraction pattern (see Supporting Information).
The crystallite sizes determined for the (111) reflections of the XRD data by using the Debye–Scherrer equation[18] are 2.9 ± 0.2 nm and 1.9 ± 0.1 nm for the ≈2.8-nm and ≈1.9-nm nanocrystals, respectively. These XRD-estimated sizes of nanocrystals are in good agreement with mean diameters determined from the TEM images, indicating the single-crystalline and spherical nature of individual nanocrystals.
Energy-dispersive X-ray (EDX) analysis of the samples showed Fe/Pt ratios of 40:60 for the ≈2.8-nm nanocrystals and 25:75 for the ≈1.9-nm nanocrystals (see Supporting Information), suggesting Pt richness in these particles. The difference between the Fe/Pt ratios of the precursors and of the products was due to the different decomposition characteristics of the former, which eventually offer different molar concentrations of the growth species. Fe-rich FexPt1−x (x≈0.52–0.60) nanocrystals are known to have the largest coercivity.[3] We expect to adjust the composition by controlling the molar ratio of the metal precursors[3] or by using a single bimetallic precursor consisting of Fe and Pt in a 1:1 molar ratio.[9]
The formation of the fct FePt phase of our FePt–graphite core–shell nanocrystal is attributed to the high growth temperature of 800 °C, well above the temperature needed for ordered fct phase formation. The high-surface-area silica support provides a bed for dispersion of the metal species and alloying of Fe and Pt into nanoclusters without aggregation. The graphite shell formation is attributed to supersaturation of the surface of the metal particles by carbon and subsequent precipitation.[17]
We investigated the chemical stability of the ≈2.8-nm FePt/graphitic carbon nanocrystals in a 35% HCl solution and compared it with that of FePt nanocrystals with partially broken carbon shells, which were prepared by heating at 350 °C for 10 min under an air atmosphere. FePt/graphitic carbon nanocrystals exhibited stability against HCl etching over a monitoring period of a week. However, FePt nanocrystals with partially broken carbon shells turned the color of the solution in HCl to yellow right after the addition owing to the Fe etching (see Supporting Information). This means that only FePt/graphitic carbon is stable against chemical attacks in the liquid phase, although FePt is known to be a stable material for a long time in air.[3]
Magnetic hysteresis loops recorded for FePt nanocrystal samples at 5 and 300 K are shown in Figure 3. The 2.8-nm FePt sample has coercivities of 2.47 kOe at 300 K and 7.74 kOe at 5 K. The kink at low field represents a coexistence of disordered and ordered nanocrystals.[19] The nanocrystals smaller than 2 nm may be too small to be ordered in the fct structure. The relatively high coercivities for such small particle sizes, however, suggest a high portion of fct-ordered nanocrystals.[11,12] No degradation of magnetic properties was observed over long periods of time (months), suggesting no chemical changes to the fct FePt core owing to protection by the graphite shell. Our result is the first demonstration of the preparation of highly magnetic FePt nanocrystals as small as 2.8 nm. Rong et al. recently demonstrated ≈3-nm FePt nanoparticles annealed at 700 °C in L10-ordered fct phase and with ferromagnetism at room temperature.[11] Although no room-temperature coercivity data were reported, a coercivity of ≈10 kOe at 5 K was observed. Our FePt nanocrystals with an average size of ≈1.9 nm showed small coercivities of 0.4 kOe at 300 K and 5.64 kOe at 5 K, suggesting that many nanocrystals in this sample were superparamagnetic at 300 K owing to the ultrasmall sizes. The synthesis of fct FePt nanocrystals of ≈2–3 nm with narrow size distributions will be a significant challenge to overcome for applications in magnetic recording because the switching field will vary considerably with particle size. Nevertheless, we recently made progress in size separation of metal–graphite core–shell nanocrystals by using a step-density-gradient centrifugation method developed for carbon nanotubes.[20] The results will be presented in a separate communication.
Figure 3.
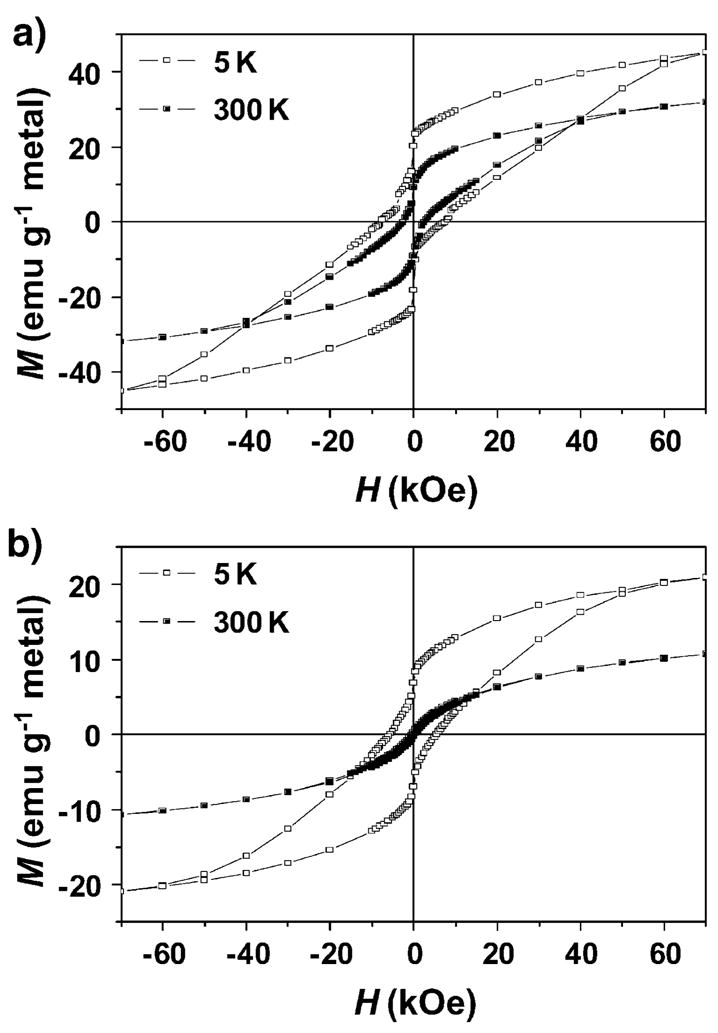
Magnetization versus field data at 5 K and 300 K for FePt–graphite shell nanocrystals with average sizes of a) ≈2.8 nm and b) ≈1.9 nm.
In conclusion, we synthesized ultrasmall FePt–graphite shell nanocrystals by a simple one-step CVD process. Particles of size between 1 and 3 nm can be readily obtained by varying the amount of metal precursors loaded in the silica support. Our CVD synthesis method is scalable to the gram level. We demonstrated the preparation of FePt nanocrystals with mean diameter ≈2.8 nm with high coercivity at room temperature and superior chemical stability against etching and oxidation. FePt nanocrystals with mean diameter of ≈1.9 nm appear mostly superparamagnetic at room temperature. Our method may offer an opportunity for obtaining advanced materials for ultrahigh-density magnetic data storage. The synthesis method can be readily extended for the preparation of a number of metal alloy nanocrystals with graphite shell coating.
Experimental Section
Materials
Fe(NO3)3 · 9H2O (99.999%, Alfa Aesar) and H2PtCl6 · 9H2O (99.999%, Alfa Aesar) were used without further purification. All other reagents purchased from commercial sources were used as obtained without further purification.
Synthesis of FePt/graphitic carbon nanocrystals
For 2.8 ± 0.9-nm FePt/graphitic carbon nanocrystals, fumed silica (1.00 g, Degussa) was impregnated with Fe(NO3)3 · 9H2O (0.145 g) and H2PtCl6 · 9H2O (0.186 g) in methanol (50 mL) and sonicated for 1 h. For 1.9 ± 0.7-nm FePt/graphitic carbon nanocrystals, a four-fold-lower metal loading was employed. The methanol was removed by drying at 80 °C, and the powder was ground; typically 0.50 g was used for methane CVD in a tube furnace. The sample was heated in a H2 flow to reach 800 °C and then subjected to a methane flow of 400 cm3 min−1 for 5 min. The sample was cooled and etched with 10% HF in H2O (80%) and ethanol (10%) to dissolve the silica. The FePt/graphitic carbon nanocrystals were collected by centrifugation and thoroughly washed. Notably, the fct FePt metal cores remained intact during the HF etching step because of the tight protection by the graphite shell coating over the core.
Characterization of the FePt/graphitic carbon nanocrystals
The nanocrystals were characterized by TEM (low resolution: Philips CM20 operated at 200 kV; high resolution: JEM-ARM1300S operated at 1250 kV), selected area electron diffraction (SAED) patterns attached to a CM20 (Figure S2 shows the data for FePt nanocrystals with an average size of ≈1.9 nm), energy-dispersive X-ray analysis (EDX) attached to a CM20, XRD (Philips X’Pert Pro diffractometer using CuKα radiation at 45 kV and 40 mA), Raman spectroscopy (Renishaw 1000 micro-Raman spectrometer with a laser excitation of λ = 785 nm), and with a SQUID magnetometer (Quantum Design MPMS-XL). Samples for TEM investigations were prepared by putting an aliquot of an aqueous suspension of phospholipid–poly(ethyleneglycol) (PL-PEG)-functionalized FePt/graphitic carbon nanocrystals onto an amorphous carbon substrate supported on a copper grid. The grid was allowed to dry at room temperature. PL-PEG-functionalized FePt/graphitic carbon nanocrystal suspensions were prepared by sonicating the nanocrystals for 1 h in an aqueous solution of PL-PEG, followed by centrifugation at 24,000 g for 5 min to remove any aggregates (see reference [17] for details for making the suspensions). Samples for Raman characterization were prepared by dropping ≈20 μL of a thick suspension of FePt/graphitic carbon nanocrystals on a Si wafer with a 500-nm SiO2 surface layer and drying at 80 °C in an oven. A thick nanocrystal film thus formed on the Si wafer was used for Raman measurements. After focusing on a big agglomerate of nanocrystals, we recorded the Raman spectra (25 mW, 50× objective, 1 s collection time, 100× accumulation.). Spectra were also taken at the same setting on a bare Si wafer to measure the background. The spectra shown in Figure 1b were obtained by subtracting the background from the nanocrystal spectrum.
Measurement of the metal content of the FePt/graphitic carbon nanocrystals
The iron content was measured by a calcination–HCl–UV/Vis method. An HCl solution was used to dissolve a known amount of Fe2O3 (Aldrich, 99.8%). The resulting solution was used to calibrate a characteristic UV/Vis absorbance peak and a molar extinction coefficient of Fe3+ at 362 nm. The iron content of FePt/graphitic carbon nanocrystals was determined by calcination of the graphite shells at 500 °C in air, dissolution of the metal species in HCl solution, and measurement of the UV/Vis absorbance at 362 nm. EDX data were used to determine the Fe/Pt ratios (Figure S3). The Pt content of FePt/graphitic carbon nanocrystals was determined on the basis of the ratios.
Supplementary Material
Footnotes
This work was supported by a Bio-X Initiative grant at Stanford University. W.S.S. acknowledges the Sogang University Research Grant of 2007.
Supporting Information is available on the WWW under http://www.small-journal.com or from the author.
Contributor Information
Won Seok Seo, Email: wsseo@sogang.ac.kr.
Hongjie Dai, Email: hdai@stanford.edu.
References
- 1.Sun S. Adv Mater. 2006;18:393–403. [Google Scholar]
- 2.Weller D, Moser A. IEEE Trans Magn. 1999;35:4423–4439. [Google Scholar]
- 3.Sun S, Murray CB, Weller D, Folks L, Moser A. Science. 2000;287:1989–1992. doi: 10.1126/science.287.5460.1989. [DOI] [PubMed] [Google Scholar]
- 4.Zeng H, Li J, Liu JP, Wang ZL, Sun S. Nature. 2002;420:395–398. doi: 10.1038/nature01208. [DOI] [PubMed] [Google Scholar]
- 5.Gu H, Ho PL, Tsang KWT, Wang L, Xu B. J Am Chem Soc. 2003;125:15702–15703. doi: 10.1021/ja0359310. [DOI] [PubMed] [Google Scholar]
- 6.Darling SB, Yufa NA, Cisse AL, Bader SD, Sibener SJ. Adv Mater. 2005;17:2446–2450. [Google Scholar]
- 7.Sun S, Fullerton EE, Weller D, Murray CB. IEEE Trans Magn. 2001;37:1239–1243. [Google Scholar]
- 8.Dai ZR, Sun S, Wang ZL. Nano Lett. 2001;1:443–447. [Google Scholar]
- 9.Song HM, Hong JH, Lee YB, Kim WS, Kim Y, Kim SJ, Hur NH. Chem Commun. 2006:1292–1294. doi: 10.1039/b516831g. [DOI] [PubMed] [Google Scholar]
- 10.Rong C-b, Li D, Nandwana V, Poudyal N, Ding Y, Wang ZL, Zeng H, Liu JP. Adv Mater. 2006;18:2984–2988. [Google Scholar]
- 11.Rong C-b, Poudyal N, Chaubey GS, Nandwana V, Skomski R, Wu YQ, Kramer MJ, Liu JP. J Appl Phys. 2007;102:043913. [Google Scholar]
- 12.Howard LEM, Nguyen HL, Giblin SR, Tanner BK, Terry I, Hughes AK, Evans JSO. J Am Chem Soc. 2005;127:10140–10141. doi: 10.1021/ja051669e. [DOI] [PubMed] [Google Scholar]
- 13.Jeyadevan B, Urakawa K, Hobo A, Chinnasamy N, Shinoda K, Tohji K, Djayaprawira DDJ, Tsunoda M, Takahashi M. Jpn J Appl Phys. 2003;42:L350–L352. [Google Scholar]
- 14.Kang S, Jia Z, Shi S, Nikles DE, Harrell JW. Appl Phys Lett. 2005;86:062503. [Google Scholar]
- 15.Wellons MS, Morris WH, III, Gai Z, Shen J, Bentley J, Wittig JE, Lukehart CM. Chem Mater. 2007;19:2483–2488. [Google Scholar]
- 16.Qiu JM, Wang JP. Adv Mater. 2007;19:1703–1706. [Google Scholar]
- 17.Seo WS, Lee JH, Sun X, Suzuki Y, Mann D, Liu Z, Terashima M, Yang PC, McConnell MV, Nishimura DG, Dai H. Nat Mater. 2006;5:971–976. doi: 10.1038/nmat1775. [DOI] [PubMed] [Google Scholar]
- 18.Cullity BD. Elements of X-ray Diffraction. Addison-Wesley; Reading, MA: 1978. [Google Scholar]
- 19.Tamada Y, Yamamoto S, Takano M, Nasu S, Ono T. Applied Physics Letters. 2007;90:162509. [Google Scholar]
- 20.Sun X, Zaric S, Daranciang D, Welsher K, Lu Y, Li X, Dai H. J Am Chem Soc. 2008;130:6551–6555. doi: 10.1021/ja8006929. [DOI] [PubMed] [Google Scholar]
Associated Data
This section collects any data citations, data availability statements, or supplementary materials included in this article.