

Abstract
Controlled intracellular disassembly of polyelectrolyte complexes of polycations and DNA (polyplexes) is a crucial step for the success of non-viral gene delivery. Motivated by our previous observation of different gene delivery performance among multiblock reducible copolypeptide vectors [Bioconjugate Chem. 2006, 17, 1395], atomic force microscopy is used to visualize plasmid DNA in various decondensed states from reducible polypeptide polyplexes under simulated physiological reducing conditions. DNA decondensation is triggered by reductive degradation of disulfide-containing cationic polypeptides. Striking differences in DNA release dynamics between polyplexes based on polypeptides of histidine-rich peptide HRP (CKHHHKHHHKC) and nuclear localization signal NLS (CGAGPKKKRKVC) peptide are presented. The HRP and NLS polyplexes are similar to each other in their initial morphology with a majority of them containing only one DNA plasmid. Upon reductive degradation by dithiothreitol, DNA is released from NLS abruptly regardless of the initial polyplex morphology, while DNA release from HRP polyplexes displays a gradual decondensation that is dependent on the size of polyplexes. The release rate is higher for larger HRP polyplexes. The smaller HRP polyplexes become unstable when they are in contact with expanding chains nearby. The results reveal potentially rich DNA release dynamics that can be controlled by subtle variation in multivalent counterion binding to DNA as well as the cellular matrix.
INTRODUCTION
DNA condensation by polycations has been studied in the context of polyelectrolyte complexes, phase transitions, DNA packing in human sperms, viral capsids, chromosomes, and gene therapy.1–5 DNA condensation is driven by an entropy increase associated with the release of counterions upon the formation of DNA/polycation complexes, or polyplexes. Manning’s counterion condensation theory predicts that 90% of the DNA charges must be neutralized for condensation to occur.6 When condensed in an aqueous environment, semi-flexible DNA chains with persistence length ~ 50 nm tend to display well-defined toroid or rod structures.
Atomic force microscopy (AFM) is used in this study to probe the disassembly dynamics of polyplexes in order to better understand the molecular origin of the difference in in vitro gene delivery performance of polypeptide vectors revealed by a previous study.7 AFM is an effective tool for the understanding of DNA condensate nanostructures and dynamics.8–17 AFM is capable of revealing the degree of heterogeneity among individual condensates that often eludes the more traditional methods such as gel electrophoresis,18 light scattering,19,20 fluorescence microscopy,21–23 circular dichroism, and absorption spectroscopy.24 While the bulk methods are necessary for providing structure and dynamics without the influence of a surface, the bulk data are averaged over a large number of molecular ensembles. AFM as a direct imaging tool of biochemical processes has several advantages: 1) it is label-free, 2) it can be conducted under near-physiological conditions, and 3) it provides near single-molecule resolution. Specific to this study, the topographical data from AFM consist overwhelmingly of individual non-aggregated polyplexes. Therefore, the common problems associated with aggregation and excess free polycations are largely avoided. In addition, polyplex dynamics on a 2-D surface may resemble more closely its in vivo movement in intracellular protein scaffolds, the nuclear matrix, and at the biomembrane surface.
Similar to DNA condensation, the understanding of DNA decondensation and release dynamics is important for gene delivery since DNA decondensation and release constitute a critical step along the gene delivery pathways. In addition to the effect of particle size,25,26 the timing and the degree of DNA release were shown to affect transgene expression efficiency.27–30 While polyplexes are thought to enter the nucleus most efficiently during cell division when the nuclear membrane is compromised,31 during interphases the polyplexes are expected to disintegrate into small enough structures in order to diffuse through the nuclear pore via random-walk diffusion.32 But if the release event occurs more upstream, it is difficult for the free DNA to reach the target nucleus because of cytoplasmic nuclease degradation and low cytoplasmic mobility. Therefore, the timing and extent of polyplex decondensation in the cytosol is critical to gene delivery.
Polycations capable of condensing DNA are the core component of multicomponent gene delivery strategies.33–36 The recent study by Manickam and Oupicky has shown that the use of polycations containing both nuclear localization signal (NLS, CGAGPKKKRKVC) and histidine-rich peptide (HRP, CKHHHKHHHKC) blocks is effective in lowering the toxicity while maintaining high gene expression efficiency.7 HRP contains histidyl residues capable of buffering in the endo/lysosomal pH, while NLS, derived from the importin α binding SV40 T antigen sequence, provides the polyplexes with potential nuclear localization capability. The polypeptides synthesized from α, ω-dithiol-oligopeptides also embody another strategy for gene delivery, namely the bio-reversible bond strategy. High molecular weight polycations bind DNA quasi-irreversibly but exhibit high in vivo toxicity. Low molecular weight polycations allow reversible condensation and decondensation of DNA, but their condensates suffer in vivo instability. The degradation of disulfide-containing polycations to short α, ω-dithiol-oligocations can be triggered by the redox potential gradient between extracellular environment and various subcellular organelles in normal or pathogenic state so that the genetic payload is fully protected up to that point and released only upon reaching the target intracellular space.37–42 The degradation proceeds via a thiol/disulfide exchange reaction mechanism. This paper reports a first in situ AFM study of DNA decondensation in controlled reducing environments. The AFM results will be discussed in the context of the physicochemical and transfection properties of the redox active polyplexes. We apply dynamic AFM imaging protocols to observe DNA decondensation and release from polyplexes triggered by dithiothreitol (DTT). DTT concentration of 20 mM is used to simulate the effect of reducing agents such as glutathione in vivo. The concentration of glutathione has been reported to be ~ 4 mM in the cytoplasm and ~ 20 mM in the nucleus.43 The thiol/disulfide exchange reaction between DTT and the disulfide bonds in the polypeptides cleaves the high molecular weight polypeptides into smaller oligopeptides. Consequently, the oligopeptides unbind from the DNA chain. Continuous AFM scanning captures DNA undergoing decondensation within minutes in the DTT solution. We report different DNA release dynamics between NLS and HRP polyplexes in the rate and degree of DNA release and DNA conformational transition pathways.
EXPERIMENTAL
Materials
Plasmid DNA vector, gWiz™ High-Expression Luciferase, containing luciferase reporter gene was purchased from Aldevron. Polypeptides containing disulfide bonds in the backbone were synthesized as described previously7,44 by oxidative polymerization of two peptides: a nuclear localization signal (NLS, CGAGPKKKRKVC) sequence or a histidine-rich peptide (HRP, CKHHHKHHHKC) sequence to yield poly(NLS) (Mw ~ 100,000) and poly(HRP) (Mw ~ 200,000), respectively. The polypeptides show minimal cytotoxicity and transfection activity comparable to or better than control polyethyleneimine (PEI) polyplexes.7 All other chemicals were purchased from Sigma-Aldrich. Water was deionized to 18 MΩ • cm resistivity using Nanopure System from Barnstead. Grade V5 muscovite mica was purchased from Ted Pella and hand cleaved just before use.
Sample preparation
The structure of polyplexes has been found to be sensitive to preparation conditions.45,46 Here, DNA solution (20 mg/L) in 30 mM sodium acetate buffer (pH 5) was used to prepare polyplexes at the desired basic amino acid (K, H, R) residue-to-DNA phosphate molar ratio (N/P). Acetate buffer (pH 5) was used to increase the protonation of histidine residues in poly(HRP). The polypeptide was added to the DNA solution and they were mixed by vortexing at 3,200 rpm (Fisher Scientific Vortex Mixer) for 10 s and the polyplexes were incubated at room temperature for 30 min. Twenty μL of polyplex solution was placed on 1 cm2 freshly cleaved mica. Excess of solution was removed after 2 min, and surface was rinsed with deionized water.
AFM characterization
AFM imaging was conducted using a Nanoscope III MultiMode AFM from Digital Instruments. In order to image pure DNA, Tapping Mode in air was conducted on mica. DNA binding to negatively charged mica is enhanced by divalent metal ions, e.g. see work by Allen et al.9 Here 20 μL 10−6 M MnCl2 solution was placed on 1 cm2 freshly cleaved mica. After 10 s, the droplet was gently removed by blowing N2. Then 10 μL 20 mg/L DNA solution was added and the mica substrate was rinsed with deionized water and dried with N2 after 30 s. In order to image the DNA release dynamics from polyplexes, Tapping Mode was performed in liquid using silicon nitride probes (NP type, VEECO) with a nominal radius of curvature of 20 nm and cantilever spring constant of 0.38 N/m as provided by the manufacturer. We adopted dynamic AFM imaging protocols previously used to follow crystallization and phase transitions at the solid-liquid interface to this study.47–49 A procedure was adopted to always image the adsorbed polyplexes in the same buffer (30 mM pH 5 sodium acetate buffer) and at the same ionic strength as the reductive solution prior to reduction. This will determine the polyplex stability in non-reductive environments and minimize tip disturbance. Usually, the polyplexes were imaged in 40 μL buffer solutions before 10 μL DTT solution was injected. The DTT concentration in the liquid cell (VEECO) was maintained at 20 mM. While maintaining the tip and substrate separation to a minimum distance, the DTT solution was injected through silicone rubber tubing into the liquid cell, which was sealed by an O-ring. AFM imaging ensued immediately after solution injection. The surface was imaged continuously at an average rate of 1.5–2 Hz on a 2 × 2 μm2 area until no significant changes occurring at the surface. The ranges of frequency, amplitude, integral, and proportional gains used are 8 kHz, 0.5–1 V, 0.5–2, and 0.75–3 respectively. The AFM images were analyzed using Nanoscope Software Version 5.12b by Veeco. We used both sectional height and bearing image analysis commands to determine particle size. The lateral dimension of a particle was determined at the full-width at half-maximum height in order to minimize tip convolution.50 The bearing analysis command in the Nanoscope software was used to measure the particle volume and area in which the substrate was used as the threshold bearing plane. The particle volume above the threshold plane is calculated by integrating the depth histogram over the entire area above the threshold plane. The DNA contour length was measured using the WS×M 4.0 software. The dynamic results are reproducible with particle size data exhibiting a typical error of 30%.
Light scattering characterization
The static light scattering measurements were performed with a DAWN EOS (Wyatt Technology) equipped with a 30 mW linearly polarized GaAs laser. The analysis of the polyplex solutions was conducted at an angular range θ = 22.5°–147° in 20 mL glass scintillation vials at 25°C. The static light scattering data were analyzed by the second-order Debye fit, , to obtain polyplexes particle density and z-average of the root mean square radius (radius of gyration, Rg) of the DNA polyplexes. K is the optical constant, which includes the square of the refractive index increment ν; R(θ) is the Rayleigh ratio, which is proportional to the intensity of the light scattered from solutions; and the polyplex concentration c is in g/mL. Extrapolation to zero concentration was not performed due to very low concentrations of the polyplexes (< 10−5 g/mL). To determine polyplex concentration for Mw determination required to calculate particle density, complete complexation between DNA and polycations was assumed at N/P < 1 and 1:1 stoichiometry at N/P > 1. The refractive index increments of the DNA polyplexes were calculated as weight-average values using the same assumptions about the polyplex stoichiometry (νDNA = 0.185 and νpolypeptides = 0.188).
Salt dissociation assay
Polyplexes at N/P ratio 4 were formed by adding pre-determined amount of polypeptide to 20 mg/L solution of gWiz-luciferase plasmid DNA in 30 mM sodium acetate (pH 5). Polyplexes were then incubated in 20 mM DTT for 30 min at 37°C, following which NaCl was added at the indicated concentrations. Samples were then loaded onto 0.8% agarose gel containing 0.5 mg/L ethidium bromide and run for 75 min at 120 V in 0.5× TRIS-boric acid-EDTA (TBE) buffer. The gel was visualized under UV illumination on a Gel Logic 100 Imaging System.
RESULTS
In order to avoid confusion, we define depolymerization as the process of converting a polymer into a monomer. In this paper, it specifically describes the degradation of the reducible polypeptides into their oligopeptide building blocks by breaking disulfide bonds. Decondensation is defined as the alteration of DNA structure from the condensed form to a relaxed disperse form. In AFM imaging, it appears as the transition from spherical/rodlike particles to supercoiled DNA chains. Desorption describes the process of removing an adsorbed material from the solid on which it is adsorbed. In this paper, it means that the decondensed DNA molecules (or fragments) detach from the substrate and thus are “invisible” to AFM. Disassembly describes both decondensation and dissociation of the polycations from DNA.
Firstly, static light scattering was used to follow changes in Rg and structural density (calculated as 3Mw/(4πNARg3)) of the polyplexes in 20 mM DTT (Figure 1). NA is the Avogadro’s number. Abrupt changes for poly(NLS) polyplexes in solution were observed by static light scattering (Figure 1a). There was an initial period after addition of DTT, when no changes in particle density (~ 650 s) and in Rg (~ 730 s) were observed. This initial period is then followed by rapid increase of both of the measured parameters, suggesting aggregation of the polyplexes and internal rearrangement leading to the increased structural density. The increase in particle density suggests that the initial degradation stage tends to compact the polyplexes prior to the DNA release stage. It is possible that better packing is achieved by rearrangement of shorter polymer chains. The earlier onset of the changes in particle density compared to particle size suggests that in the first phase of the reduction, internal rearrangement of polyplexes takes place. The observed aggregation is consistent with the removal of the surface loops of free polycations that otherwise stabilize the polyplexes against aggregation. Poly(HRP) formed polyplexes with lower structural density than poly(NLS) and unlike poly(NLS), changes in Rg were observed almost immediately after DTT addition (Figure 1b). The initial decrease in size of poly(HRP)/DNA is followed by aggregation similar to the poly(NLS) polyplexes. The light scattering data show that while it is valuable for the study of polyplex dynamics in solution, it is not suitable to follow the polyplex dissociation dynamics above the minimum salt concentration required for polyplex dissociation, cd. This is due to extensive aggregation of the polyplexes above cd even under oxidizing conditions before DTT addition. The limitation of the light scattering technique is a motivation for carrying out the in situ AFM study above cd.
Figure 1.
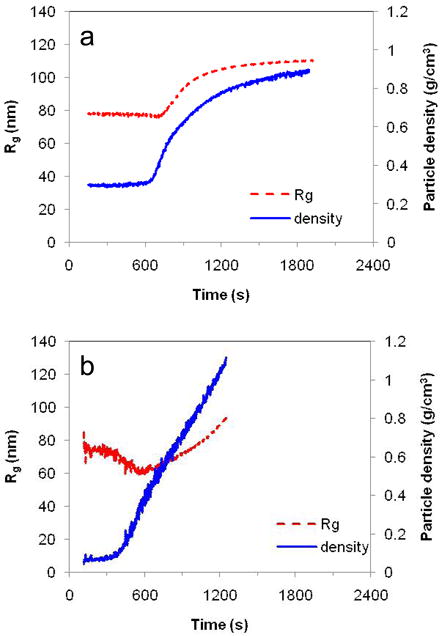
Static light scattering measurements of Rg and particle density variations in solutions of (a) poly(NLS)/DNA (N/P = 4) and (b) poly(HRP)/DNA (N/P = 4) as functions of time in 20 mM DTT. Data were acquired every 5 s.
Secondly, gel electrophoresis was used to follow DNA release in the reducing and non-reducing environments. Representative results for poly(NLS) polyplexes are shown in Figure 2. The results confirm the stability of the polyplexes to dissociation in a range of increasing salt concentrations (lanes 5–8). In the presence of DTT, reduction of disulfide bonds results in an almost complete release of DNA as expected from the polyplexes (lanes 9–12). However, the fact that the DNA mobility is not completely restored to that of control non-complexed DNA (lane 2–4) suggests the possibility of a residual binding of reduced NLS monomers.
Figure 2.
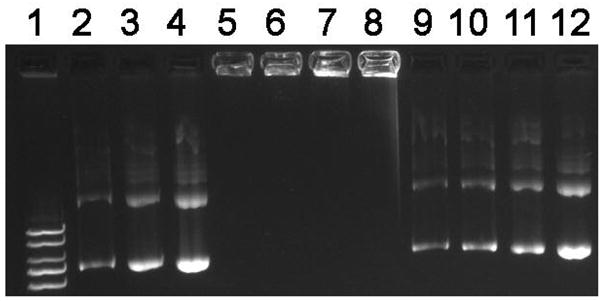
Agarose gel electrophoresis of poly(NLS)/DNA polyplexes. Samples containing 0.4 μg DNA were run on a 0.8% agarose gel and DNA was stained with ethidium bromide and visualized under UV illumination. Lane 1, DNA ladder; lanes 2–4, DNA treated with 0.1, 0.2 and 0.4 M NaCl; lanes 5–8, polyplexes incubated in the absence of DTT followed by treatment with 0, 0.1, 0.2, and 0.4 M NaCl; lanes 9–12, polyplexes incubated in 20 mM DTT followed by treatment as indicated in lanes 5–8.
Lastly, we describe the primary results from AFM investigation. Before presenting the results of the complexes, pure plasmid DNA was imaged by AFM. Plasmid DNA prior to complexation with the polypeptides shows the typical relaxed open-loop structure51 with little twisting of the strands and a typical height of 2 nm (Figure 3a). Since negatively charged DNA does not adsorb on negatively charged mica, plasmid DNA was anchored on mica by the addition of small amount of Mn2+ (10−6 M). The average contour length (WS×M 4.0 Image Analysis software), 1.9 ± 0.2 μm, is less than the contour length calculated for B-form DNA with 6,732 bp, 2.3 μm. The measured contour length is usually limited by the spatial resolution of AFM.
Figure 3.
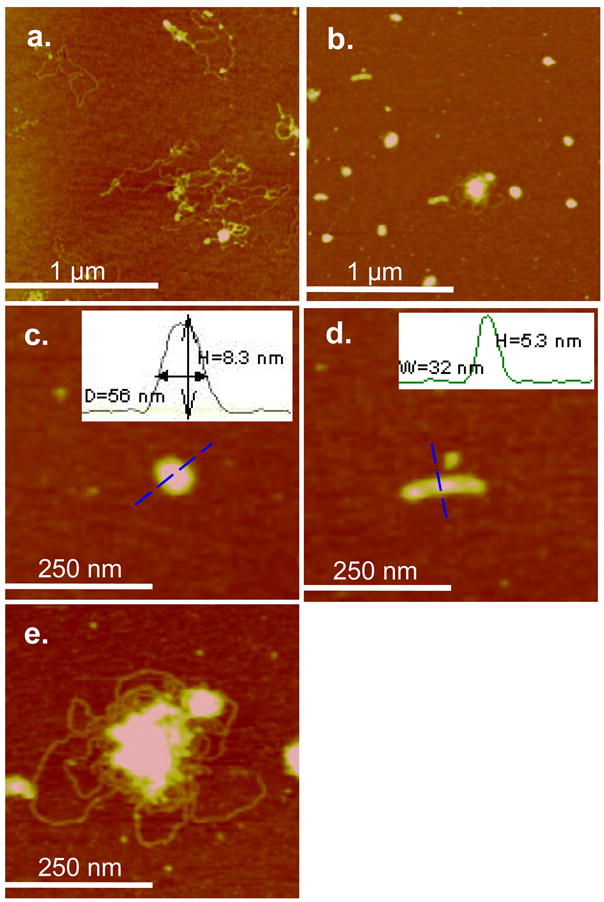
AFM height images and particle size analysis of plasmid DNA adsorbed on mica before and after condensation with poly(NLS) or poly(HRP). (a) Free plasmid DNA in air (z range = 5 nm). (b)–(e) Representative spheroid, rod, and flower-like poly(HRP)/DNA condensates (N/P = 4, DNA concentration at 2.0×10⁻³ g/L) imaged in deionized water (z range = 20 nm). The insets in (c) and (d) show the sectional height profile, particle height, and the lateral dimension along the dotted line of the spheroid and rod respectively.
Our previous paper reported positive ζ potential values, 55 and 47 mV, for polyplexes prepared with excess poly(HRP) and poly(NLS), respectively.7 The positively charged polyplexes adsorb readily on negatively charged mica and can be imaged by in situ AFM in the fluid-tapping mode. Both poly(NLS) and poly(HRP) were capable of condensing DNA at N/P ≥ 2 (Figure 3b). When N/P increased from 2 to 8, AFM shows negligible variation in polyplex morphology (data not shown). The majority of the DNA condensates are either spheroids (Figure 3c) or rods (Figure 3d) with a small population, ~ 5 %, of larger flower-like objects (Figure 3e). The typical dimensions of spheroids were measured to be 7.0 ± 2.5 nm in height and 50.3 ± 7.8 nm in diameter. The typical dimensions of the rods were 3.8 ± 1.5 nm in height, 36.3 ± 11.5 nm in width, and 163 ± 50 nm in length. The lateral dimensions were measured at half-height (see sectional height profiles in Figure 3c–d) in order to minimize tip convolution. All the values are within the range reported previously.2,11,52 Another typical morphology of polyplexes, toroids, was not observed with these polyplexes. Figure 4a plots the volume histograms of spheroids and rods from AFM bearing analysis for poly(NLS)/DNA and poly(HRP)/DNA. The number-average volumes of poly(NLS) and poly(HRP) condensates are 2.71 × 10⁴ and 2.92 × 10⁴ nm3, respectively. The volume of a closely packed polyplex containing a single plasmid DNA with 6,732 bp is estimated to be 1.4 × 10⁴ nm3, by assuming an interhexagonal separation between neighboring peptide/DNA chain of 2.7 nm.53 Therefore according to the volume histograms, approximately 50% of the condensates contain only one DNA plasmid per particle. The volume histograms also indicate that rods are more uniform in size than spheroids. Figure 4b shows that over 80% rods are in the smallest size range while the spheroids have a wider size distribution. AFM morphological analysis of the condensates concludes that poly(NLS) and poly(HRP) share similar condensate structure.
Figure 4.

Particle volume histograms of poly(NLS)/DNA and poly(HRP)/DNA based on the bearing analysis of AFM height images. N is the population size. (a) Comparison between poly(NLS) and poly(HRP) condensates. (b) Comparison between spheroid and rod particles.
The controlled release nature of the polyplexes permits further visualization of the DNA molecular distribution among the condensates. AFM images of the same area before and after the introduction of DTT allow a direct count of the number of DNA molecules in each condensate. The open loop structure and unique contour length of DNA makes it possible to count their numbers. In order to immobilize DNA on mica, 0.2 M MgCl2 was added to 20 mM DTT solution. Divalent ions such as Mg2+ have been shown to attract negatively charged DNA to negatively charged mica by counterion correlations.54,55 Figure 5a, b are before and after AFM images of DNA condensates with poly(NLS). In the absence of Mg2+, DNA chains from poly(NLS) condensates were directly released to the solution (see results below). Therefore, Mg2+ is proven effective in allowing DNA to be imaged clearly on mica after it is no longer bound to NLS. We were able to determine that indeed condensates with an initial volume of 1.4–2.0 × 10⁴ nm3 (represented by A–D) contain only one DNA molecule per particle using the Mg2+-assisted method. Similarly, condensates with volume of 3.7–4.1 × 10⁴ nm3 (represented by E and F) contain two DNA molecules. The rod-like condensate (represented by G) with a slightly higher initial volume of 3.1 × 10⁴ nm3 also contains only one DNA plasmid. In our case, poly(NLS) and poly(HRP) are effective in condensing DNA into the closest packing structure.
Figure 5.

In situ AFM images of poly(NLS)/DNA polyplexes (N/P = 4) in 0.2 M MgCl2 (a) before and (b) 540 s after the addition of 20 mM DTT. The z range is 5 nm. Contour length analysis indicates that particles A–D and G contain one DNA plasmid and particles E and F contain two DNA plasmids per particle.
Prior to the injection of the reducing DTT solution, the stability of the condensates was studied in aqueous buffer solutions containing up to 1 M NaCl. The structure of the condensates was unchanged for at least 1 h under repeated AFM scanning. It was concluded that salt alone was not able to induce decondensation due to high molecular weight of the polypeptides in agreement with the gel electrophoresis results. Minimum scanning force magnitudes were maintained in the subsequent measurements.
In the presence of 20 mM DTT, the stability of the polyplexes was found to be dependent on the salt concentration. The minimum salt concentration required for polyplex dissociation, cd, provides a means to assess the binding affinity of polycation to DNA, and has been found to be strongly dependent on the molecular weight when the degree of polymerization is low.56–58 AFM measurements determined the cd value for both poly(NLS) and poly(HRP) condensates to be in the range of 0.1–0.2 M NaCl. No changes in the appearance of the poly(NLS)/DNA (N/P = 4) condensates were observed below 0.1 M NaCl (data not shown). In the case of poly(HRP) condensates (N/P = 4), changes in the form of a gradual height reduction from over 10 nm to ~ 6.5 nm were observed in the first 2.3 × 10³ s in DTT and 0.1 M NaCl (Figure 6). No further changes were observed after 2.3 × 10³ s. The cause of particle flattening is hypothesized to be the removal of excess cations in the particle shell region and/or molecular rearrangement as a consequence of polypeptide degradation into oligopeptides. DTT cleaves the disulfide bonds to reduce the high molecular weight polypeptide into shorter α, ω-dithiol-oligopeptides. Below cd, shorter oligopeptides are capable of closer packing in the particle than the polypeptide counterpart. Gel dissociation assays of the same systems determined a lower limit of cd to be 0.3 M NaCl.7 Here AFM offers another means of DNA dissociation assays. It shows a high accuracy, requires minimum amount of sample, and minimizes the contribution from free polycations.
Figure 6.

In-situ AFM images of poly(HRP)/DNA polyplexes (N/P = 4) in 0.1 M NaCl (a) taken immediately after the addition of 20 mM DTT and (b) taken 2,270 s after the addition of DTT. The z range is 20 nm. (c) and (d) are sectional height profiles along the broken line in (a) and (b) respectively to show the height reduction of the condensates.
DNA decondensation from poly(NLS) and poly(HRP) polyplexes occurred at salt concentrations significantly below 1 M in the presence of DTT. Figure 7 presents time-lapse AFM images of DNA release from poly(NLS) polyplexes (N/P = 4) in 20 mM DTT and 0.4 M NaCl solution captured immediately after the addition of DTT. The most significant events occurred after 1.28–1.50 × 10³ s. The start of the nanoassembly unraveling can be gauged by the appearance of fuzzy edges (480–800 s). Immediately after the complete release and desorption of DNA (1.50 × 10³ s), the peptide remnants, akin to the “footprints” left by the condensates, were visible in the AFM image. The DNA release event is marked by a sudden decrease in the average volume per particle (Figure 8a). It shows that on average a particle has lost 50–60% of its total volume after 1.50 × 10³ s for N/P = 2, 4, and 8 (see Figures S1–2 in Supplementary Information for in situ AFM images of DNA release from condensates with N/P = 2 and 8). The data suggest that poly(NLS) polyplexes release DNA simultaneously after an induction period with little dependence on the initial particle size, shape, or the N/P ratio. Presumably, the initial ca. 20% volume reduction is due to the gradual loss and rearrangement of the α, ω-dithiol-NLS residues; the abrupt 50–60% volume reduction corresponds to the release of DNA, which can still carry up to 90% its counterion charges; and the last 20–30% are the NLS residues remaining on mica. We calculate the N/P ratio of the initial poly(NLS) polyplex composition using the formula , which yields an N/P ratio close to 2.0. 0.54 nm3 and 0.75 nm3 are the unit volume for P and N repeat unit respectively. In this calculation, we assume that the released DNA occupies roughly 60% of the total complex volume based on the AFM data. We further assume that the released DNA is 90% neutralized by the NLS peptide residues. The same volume loss percentage for N/P = 2, 4, and 8 suggests a maximum degree of overcharging was reached when the solution N/P mixing ratio was increased from 2 to 8.
Figure 7.

In-situ AFM sequence of DNA release from poly(NLS)/DNA polyplexes (N/P = 4) in 20 mM DTT and 0.4 M NaCl solution (No Mg2+ was added). Time zero corresponds to the addition of DTT. All images are 2.6 × 2.6 μm2 in scan size and 10 nm in z range.
Figure 8.

Polyplex disassembly rate, measured by particle volume decrease with time, as a function of the N/P ratio and salt concentration. The particle volume was determined using the bearing analysis of the AFM images. Time zero corresponds to the addition of 20 mM DTT. (a) Disassembly rate as a function of the N/P ratio (salt concentration = 0.4 M NaCl). (b) Disassembly rate as a function of the salt concentration (N/P = 4).
The disassembly of poly(NLS) polyplexes (N/P = 4) was studied as a function of salt concentration. Figure 8b shows that DNA is released at a faster rate as measured by the particle volume reduction with increasing salt concentration. The volume percentage was obtained from AFM bearing analysis averaged over 10 particles at each time interval. Therefore the salt effect is mainly to shorten the time leading to the sudden DNA release event from 1.3 × 10³ s in 0.2 M NaCl to almost instantaneous release in 0.8 M NaCl solution. Depolymerization, loss of excess oligocations, and rearrangement of remaining oligocations within the particle could occur during the induction period. Depolymerization is unlikely to be the rate-limiting step. Control α, ω-dithiol-oligocations showed the same salt dissociation rate as those of the polyplexes.7 Rearrangement of NLS could be the rate-limiting step and it can be accelerated by salt screening of the electrostatic interactions between NLS and DNA and NLS and the substrate.
A different disassembly behavior was observed for poly(HRP) polyplexes under identical reducing conditions. Figure 9 is a representative AFM time-lapse sequence of poly(HRP) polyplexes (N/P = 4) after injecting 20 mM DTT and 0.2 M NaCl solution. Above cd, DTT degradation of poly(HRP) causes particle size increase due to DNA decondensation. Fuzzy edges, signaling the unraveling of the nanoassemblies, were observed almost immediately after the addition of DTT (160 s). Loose DNA chains continued to emerge and expand until 1.2 × 10³ s. DNA decondensation is indicated by a gradual height reduction from above 10 nm to 2 nm during this period. The height reduction started from the outer perimeter of the particle and gradually encompassed the whole particle. The partially decondensed DNA with loose loops surrounding a central compact core resembles closely the partially condensed DNA reported in literature. For example, Dunlap et al.10 reported several partially condensed DNA structures including folded loops of DNA surrounding central cores, loose coils with isolated nodes, and bundles. In the final interval of 1.5–3.0 × 10³ s, the number of chain segments decreased suggesting that some DNA loops detach from surface into the solution. The reduction in image resolution could also cause the change near the end of the sequence. No significant changes occurred after 3.0 × 10³ s. It is clear that the release dynamics of poly(HRP) polyplexes is quite different from that of poly(NLS) polyplexes. DNA plasmids were released from HRP polyplexes gradually resulting in partially decondensed intermediates and the plasmids never fully desorbed from the mica substrate.
Figure 9.

In-situ AFM sequence of DNA release from poly(HRP)/DNA polyplexes (N/P = 4) in 20 mM DTT and 0.2 M NaCl solution (No Mg2+ was added). Time zero corresponds to the addition of DTT. All images are 2 × 2 μm2 in scan size and 10 nm in z range.
The AFM study also captured intriguing size-dependent disassembly behavior of poly(HRP) condensates. Particles with an initial diameter (measured at half height) of 50 nm or more underwent decondensation while particles below this critical size, marked as A–F, were more resistant to reductive degradation. Exceptions marked as G–I can be found to be close to larger particles. These particles with a center-to-center distance to nearest larger particles less than 100 nm seem to be destabilized by the nearby chain unraveling events. The momentary bridge by a DNA chain from a neighboring particle to the smaller particle J can be seen at 850 s.
DISCUSSION
This study demonstrates the use of AFM in capturing the dynamics and heterogeneity during DNA release from polyplexes. The effects of physical attributes of polyplexes such as particle size on gene delivery performance are complicated because the size effect is different at different stages of gene delivery. While it is unlikely that we can predict DNA release in vivo solely based on the DNA release behavior observed by AFM conducted in a highly simplified environment, we discuss the AFM results in the context of a previous in vitro study of the physicochemical and physiological properties of the poly(NLS) and poly(HRP) DNA delivery vectors.7 The hydrodynamic diameters and ζpotentials of the polyplexes (pH = 5, 20 mg/L DNA, N/P = 4) were determined by dynamic light scattering to be 105 ± 3 nm, 47 ± 1 mV for poly(NLS) and 96 ± 1 nm, 55 ± 1 mV for poly(HRP). AFM morphological analysis indicates that the two form condensates similar in shape and size distribution. AFM results further indicate that the condensates are highly compact and approximately half of them contain only one DNA plasmid. Destabilization experiments by a polyanion exchange reaction found that compact DNA condensates are more stable against polyanion exchange.15,16 While all the polycations bind equally well to DNA they show selectivity toward dissociation. In this study, correlation between disassembly dynamics and physical attributes of as-formed polyplexes such as size could not be evaluated since there were no significant differences between sizes of poly(NLS) and poly(HRP) polyplexes. The AFM results provide a partial explanation for the apparent lack of NLS effect on the transfection efficiency.7 AFM results suggest that NLS dissociates abruptly and completely from DNA. It is possible that the disulfide bonds in poly(NLS) are cleaved in the reducing environment of cytosol so that NLS are no longer associated with DNA to promote nuclear transport. Bulk experiments tend to show strong influence of the N/P ratio on biophysical properties and transgene efficiency.59 AFM experiments conducted in polymer-free buffer solutions focus on surface-adsorbed polyplexes. Therefore, it is not surprising that we did not observe the N/P effect related to excess polycations.
The issue of molecular weight on polyplex packing is unresolved in literature. Some have argued that high molecular weight polymers prevent close packing of DNA in the condensates.60 For example, the volume of a toroid or rod containing a single plasmid DNA (6,832 bp) and polylysine-asialoorosomucoid was greater than 2 × 10⁴ nm3.61 While others have reached an opposite conclusion, i.e. high molecular weight favors close packing.25,62 Still others found no direct correlation between molecular weight and packing density.63 Our study suggests in the first place that the high molecular weight of the polypeptides does not prevent close packing of the polyplex; and in the second place that as the molecular weight is decreased by chemical reduction, the polyplex undergoes further compaction before the irreversible expansion sets in. It points to an optimal molecular weight range for molecular packing in the condensate.
The intermediates observed during DNA decondensation largely resemble partially condensed DNA reported in literature. Partially condensed DNA with 8% to 83% charge neutralization formed bundles, folded loops of DNA surrounding central cores to loose coils with isolated nodes.10 The high-density nodes have been speculated to be the possible intermediate structures between random coils and compact globule condensates. AFM and simulation studies by Iwataki et al. illustrated the first-order transition from single chain compaction and multichain bundle formation.14 The AFM results show that during decondensation, structural heterogeneity develops within the particle. Correlation-induced charge inversion gives rise to overcharge of DNA by polycations.64 The polyplexes may consist of a charge neutralized core and a shell of the excess polycation.65 The reduction starts from the shell to the core, giving rise to the fuzzy edge at the onset of the polyplex disassembly. Heterogeneity during decondensation means that DNA segments in different parts, i.e. the less compact region versus the highly condensed center region (nucleation site), may show different stability against enzymatic degradation.
AFM shows that particles during decondensation display interesting interparticle dynamics. Ono et al. obtained in situ AFM images that demonstrate the DNA condensate mobility when attached to the surface by electrostatic interaction.12 Two nearby condensates were capable of interacting with each other and formed parallel strands as an intermediate to the final multimeric aggregate. The parallel strand formation was attributed to hydrophobicity minimization from the bound polycation. The hydrophobic interaction is responsible for the formation of parallel and staggered bundles of DNA strands, which then leads to crystallization after spermine neutralizes the DNA surface.66,67 We found evidence of interparticle interaction in DNA decondensation. The interparticle interaction is facilitated by a reduction in the positive charges or local charge reversal due to polymer degradation. The same local charge reversal mechanism results in intersegment attraction in polyplex formation.64 The less compact condensate starts to recover phosphate groups that make part of the chain negatively charged. The negative charged DNA interacts electrostatically with positively charged condensate surface. The hydrophobic interaction may also play a role since HRP molecules are capable of rearranging after cleavage to expose its hydrophobic parts similar to the mechanism behind DNA bundling. The intermediates during polyplex disassembly, their structural heterogeneity, and its role in condensate stability will be a key issue in the future studies as it impacts DNA delivery efficiency.
The salt concentration required to dissociate the polyplexes, cd, is directly linked to binding affinity between DNA and the polycation. The molecular weight dependence of cd is especially strong in the low-to-medium molecular weight range (Mw < 20,000) of the polycations.56,57 The chain length dependence is due to loss of entropy as a result of a higher number of shorter chains bound to DNA. The release of DNA from degraded poly(NLS) polyplexes is abrupt and complete from the surface. The release rate does not depend on size but increases with increasing salt concentration. The release of DNA from degraded poly(HRP) polyplexes is gradual and incomplete from the surface. It displays intermediate states of dissociation in the form of a condensed core and a decondensed corona. The release rate is a function of particle size and can be affected by neighboring particles. We attribute the difference between NLS and HRP to the number of charges per α, ω-dithiol-oligopeptide. At slightly acidic pH of 5, the histidine residues give HRP a higher level of protonation with estimated charges of 9 per sequence while the NLS sequence contains 6 positive charges. The logarithmic binding constant has been shown to increase with increasing number of charges on the oppositely charged polymer from 0.26 at valence of 2 to 0.77 at a valence of 10.68 The HRP sequence with a higher number of charges binds stronger to DNA and mica and hinders the DNA release. The fact that DNA strands after decondensation are still bound to mica indicates that HRP must remain on mica to provide an attractive charge correlation. The counterion valence has been shown to affect mobility of DNA on mica. In one study, DNA chains bound to Mg2+ were free to condense into toroids while multivalent protamine with 22 arginine residues pre-adsorbed on mica trapped DNA in various uncondensed to partially condensed states.9 DNA can adsorb on mica at relatively high ionic strength in the presence of low concentration of multivalent cations.69 It is interesting that NLS with a charge valence of 6 is ineffective in trapping DNA while 0.2 M MgCl2 is. It is possible that the concentration of NLS6+ is too low for it to be effective in this case. However, salt dissociation assays carried out in agarose gel and by AFM do not show significant difference in salt dissociation between HRP and NLS. The cd value determined by AFM, 0.1–0.2 M NaCl, is in agreement with that of the salt dissociation assay, which identified an upper limit of 0.3 M. The AFM results suggest that while it is likely that the difference in binding affinity is responsible for the different DNA release dynamics, it may not be reflected in the simple salt dissociation assays.
CONCLUSIONS
The AFM study demonstrates the release of DNA from reducible polyplexes under simulated physiological reducing conditions. The reducible polyplexes provide an ideal system to study DNA decondensation dynamics by real-time AFM. The polyplexes are stable in the oxidizing environment representative of the non-reducing extracellular space. Rapid release of DNA from both NLS and HRP polyplexes in the presence of DTT and moderate salt concentration simulates the conditions of reducing cytosolic and nuclear compartments. The goal of this study was to understand DNA release dynamics from polyplexes in mildly reducing conditions. In order to mimic conditions in cytosol, future experiments will be conducted in conditions more closely resembling cytosol, e.g. in glutathione instead of DTT. The polyplex stability, the intermediate partially destabilized structure, and their interactions impact its delivery efficiency and its effect on cell viability. Despite the similarity in the physical properties and nanostructures of the two types of polyplexes, their disassembly dynamics is quite different. DNA is released from NLS abruptly regardless of the initial polyplex morphology, while HRP-bound DNA displays a gradual decondensation that is size dependent. The disassembly rate is higher for larger HRP polyplexes. The results reveal potentially rich DNA release dynamics that can be controlled by subtle variation in multivalent counterion binding affinity to DNA and the surrounding cellular matrix. The tendency of partially disassembled complexes to interact and aggregate with each other cannot be overlooked. The results point to a potential challenge in regulating the stability of gene delivery vectors during disassembly due to the heterogeneous structure and charge distribution of the various intermediates.
Supplementary Material
Acknowledgments
This work was supported partially by NSF Grants CBET-0553533 (G.M.) and NIH Grant CA 109711 from the National Cancer Institute (D.O.).
References
- 1.Gosule LC, Schellman JA. Nature. 1976;259:333–335. doi: 10.1038/259333a0. [DOI] [PubMed] [Google Scholar]
- 2.Arscott PG, Li AZ, Bloomfield VA. Biopolymers. 1990;30:619–630. doi: 10.1002/bip.360300514. [DOI] [PubMed] [Google Scholar]
- 3.Manning GS. Q Rev Biophys. 1977;11:179–246. doi: 10.1017/s0033583500002031. [DOI] [PubMed] [Google Scholar]
- 4.Rouzina I, Bloomfield VA. Biophysical Chemistry. 1997;64:139–155. doi: 10.1016/s0301-4622(96)02231-4. [DOI] [PubMed] [Google Scholar]
- 5.Matulis D, Rouzina I, Bloomfield VA. Journal of Molecular Biology. 2000;296:1053–1063. doi: 10.1006/jmbi.1999.3470. [DOI] [PubMed] [Google Scholar]
- 6.Wilson RW, Bloomfield VA. Biochemistry. 1979;18:2192–2196. doi: 10.1021/bi00578a009. [DOI] [PubMed] [Google Scholar]
- 7.Manickam DS, Oupicky D. Bioconjugate Chemistry. 2006;17:1395–1403. doi: 10.1021/bc060104k. [DOI] [PubMed] [Google Scholar]
- 8.Wolfert MA, Seymour LW. Gene Therapy. 1996;3:269–273. [PubMed] [Google Scholar]
- 9.Allen MJ, Bradbury EM, Balhorn R. Nucl Acids Res. 1997;25:2221–2226. doi: 10.1093/nar/25.11.2221. [DOI] [PMC free article] [PubMed] [Google Scholar]
- 10.Dunlap DD, Maggi A, Soria MR, Monaco L. Nucleic Acids Research. 1997;25:3095–3101. doi: 10.1093/nar/25.15.3095. [DOI] [PMC free article] [PubMed] [Google Scholar]
- 11.Hansma HG, Golan R, Hsieh W, Lollo CP, Mullen-Ley P, Kwoh D. Nucleic Acids Research. 1998;26:2481–2487. doi: 10.1093/nar/26.10.2481. [DOI] [PMC free article] [PubMed] [Google Scholar]
- 12.Ono MY, Spain EM. Journal of the American Chemical Society. 1999;121:7330–7334. [Google Scholar]
- 13.Martin AL, Davies MC, Rackstraw BJ, Roberts CJ, Stolnik S, Tendler SJB, Williams PM. Febs Letters. 2000;480:106–112. doi: 10.1016/s0014-5793(00)01894-9. [DOI] [PubMed] [Google Scholar]
- 14.Iwataki T, Kidoaki S, Sakaue T, Yoshikawa K, Abramchuk SS. Journal of Chemical Physics. 2004;120:4004–4011. doi: 10.1063/1.1642610. [DOI] [PubMed] [Google Scholar]
- 15.Danielsen S, Maurstad G, Stokke BT. Biopolymers. 2004;77:86–97. doi: 10.1002/bip.20170. [DOI] [PubMed] [Google Scholar]
- 16.Chim YTA, Lam JKW, Ma Y, Armes SP, Lewis AL, Roberts CJ, Stolnik S, Tendler SJB, Davies MC. Langmuir. 2005;21:3591–3598. doi: 10.1021/la047480i. [DOI] [PubMed] [Google Scholar]
- 17.Maurstad G, Danielsen S, Stokke BT. Biomacromolecules. 2007;8:1124–1130. doi: 10.1021/bm0610119. [DOI] [PubMed] [Google Scholar]
- 18.Li AZ, Qi LJ, Shih HH, Marx KA. Biopolymers. 1996;38:367–376. doi: 10.1002/(sici)1097-0282(199603)38:3<367::aid-bip9>3.0.co;2-s. [DOI] [PubMed] [Google Scholar]
- 19.Wilson RW, Bloomfield VA. Biochemistry. 1979;18:2192–2196. doi: 10.1021/bi00578a009. [DOI] [PubMed] [Google Scholar]
- 20.Vijayanathan V, Thomas T, Shirahata A, Thomas TJ. 2001;40:13644–13651. doi: 10.1021/bi010993t. [DOI] [PubMed] [Google Scholar]
- 21.Bustamante C. Annual Review of Biophysics and Biophysical Chemistry. 1991;20:415–446. doi: 10.1146/annurev.bb.20.060191.002215. [DOI] [PubMed] [Google Scholar]
- 22.Brewer LR, Corzett M, Balhorn R. Science. 1999;286:120–123. doi: 10.1126/science.286.5437.120. [DOI] [PubMed] [Google Scholar]
- 23.Yoshikawa K, Yoshikawa Y, Koyama Y, Kanbe T. J Am Chem Soc. 1997;119:6473–6477. [Google Scholar]
- 24.Andrushchenko V, Leonenko Z, Cramb D, van de Sande H, Wieser H. Biopolymers. 2001;61:243–260. doi: 10.1002/bip.10159. [DOI] [PubMed] [Google Scholar]
- 25.Petersen H, Kunath K, Martin AL, Stolnik S, Roberts CJ, Davies MC, Kissel T. Biomacromolecules. 2002;3:926–936. doi: 10.1021/bm025539z. [DOI] [PubMed] [Google Scholar]
- 26.Thomas M, Klibanov AM. Applied Microbiology and Biotechnology. 2003;62:27–34. doi: 10.1007/s00253-003-1321-8. [DOI] [PubMed] [Google Scholar]
- 27.Schaffer DV, Fidelman NA, Dan N, Lauffenburger DA. Biotechnology and Bioengineering. 2000;67:598–606. doi: 10.1002/(sici)1097-0290(20000305)67:5<598::aid-bit10>3.0.co;2-g. [DOI] [PubMed] [Google Scholar]
- 28.Kircheis R, Wightman L, Wagner E. Advanced Drug Delivery Reviews. 2001;53:341–358. doi: 10.1016/s0169-409x(01)00202-2. [DOI] [PubMed] [Google Scholar]
- 29.Bettinger T, Carlisle RC, Read ML, Ogris M, Seymour LW. Nucleic Acids Research. 2001;29:3882–3891. doi: 10.1093/nar/29.18.3882. [DOI] [PMC free article] [PubMed] [Google Scholar]
- 30.Wiethoff CM, Middaugh CR. Journal of Pharmaceutical Sciences. 2003;92:203–217. doi: 10.1002/jps.10286. [DOI] [PubMed] [Google Scholar]
- 31.Fasbender A, Zabner J, Zeiher BG, Welsh MJ. Gene Therapy. 1997;4:1173–1180. doi: 10.1038/sj.gt.3300524. [DOI] [PubMed] [Google Scholar]
- 32.Zanta MA, Belguise-Valladier P, Behr JP. Proceedings of the National Academy of Sciences of the United States of America. 1999;96:91–96. doi: 10.1073/pnas.96.1.91. [DOI] [PMC free article] [PubMed] [Google Scholar]
- 33.Felgner PL, Barenholz Y, Behr JP, Cheng SH, Cullis P, Huang L, Jessee JA, Seymour L, Szoka F, Thierry AR, Wagner E, Wu G. Human Gene Therapy. 1997;8:511–512. doi: 10.1089/hum.1997.8.5-511. [DOI] [PubMed] [Google Scholar]
- 34.Park TG, Jeong JH, Kim SW. Advanced Drug Delivery Reviews. 2006;58:467–486. doi: 10.1016/j.addr.2006.03.007. [DOI] [PubMed] [Google Scholar]
- 35.Zuber G, Dauty E, Nothisen M, Belguise P, Behr JP. Advanced Drug Delivery Reviews. 2001;52:245–253. doi: 10.1016/s0169-409x(01)00213-7. [DOI] [PubMed] [Google Scholar]
- 36.Merdan T, Kopecek J, Kissel T. Advanced Drug Delivery Reviews. 2002;54:715–758. doi: 10.1016/s0169-409x(02)00046-7. [DOI] [PubMed] [Google Scholar]
- 37.Tang FX, Hughes JA. Bioconjugate Chemistry. 1999;10:791–796. doi: 10.1021/bc990016i. [DOI] [PubMed] [Google Scholar]
- 38.Byk G, Wetzer B, Frederic M, Dubertret C, Pitard B, Jaslin G, Scherman D. Journal of Medicinal Chemistry. 2000;43:4377–4387. doi: 10.1021/jm000284y. [DOI] [PubMed] [Google Scholar]
- 39.Saito G, Swanson JA, Lee KD. Advanced Drug Delivery Reviews. 2003;55:199–215. doi: 10.1016/s0169-409x(02)00179-5. [DOI] [PubMed] [Google Scholar]
- 40.Read ML, Bremner KH, Oupicky D, Green NK, Searle PF, Seymour LW. Journal of Gene Medicine. 2003;5:232–245. doi: 10.1002/jgm.331. [DOI] [PubMed] [Google Scholar]
- 41.Chittimalla C, Zammut-Italiano L, Zuber G, Behr JP. J Am Chem Soc. 2005;127:11436–11441. doi: 10.1021/ja0522332. [DOI] [PubMed] [Google Scholar]
- 42.Oishi M, Hayama T, Akiyama Y, Takae S, Harada A, Yamasaki Y, Nagatsugi F, Sasaki S, Nagasaki Y, Kataoka K. Biomacromolecules. 2005;6:2449–2454. doi: 10.1021/bm050370l. [DOI] [PubMed] [Google Scholar]
- 43.Oupicky D, Bisht HS, Manickam DS, Zhou Q-h. Expert Opin Drug Deliv. 2005;2:653–665. doi: 10.1517/17425247.2.4.653. [DOI] [PubMed] [Google Scholar]
- 44.Oupicky D, Parker AL, Seymour LW. J Am Chem Soc. 2002;124:8–9. doi: 10.1021/ja016440n. [DOI] [PubMed] [Google Scholar]
- 45.Zelphati O, Nguyen C, Ferrari M, Felgner J, Tsai Y, Felgner PL. Gene Therapy. 1998;5:1272–1282. doi: 10.1038/sj.gt.3300707. [DOI] [PubMed] [Google Scholar]
- 46.Oupicky D, Konak C, Ulbrich K, Wolfert MA, Seymour LW. Journal of Controlled Release. 2000;65:149–171. doi: 10.1016/s0168-3659(99)00249-7. [DOI] [PubMed] [Google Scholar]
- 47.Li M, Wang AF, Mao GZ, Daehne L. Journal of Physical Chemistry B. 1999;103:11161–11168. [Google Scholar]
- 48.Dong JP, Mao GZ, Hill RM. Langmuir. 2004;20:2695–2700. doi: 10.1021/la036059b. [DOI] [PubMed] [Google Scholar]
- 49.Wan L, Bisht HS, You YZ, Oupicky D, Mao GZ. Langmuir. 2007;23:12159–12166. doi: 10.1021/la701819q. [DOI] [PubMed] [Google Scholar]
- 50.Fritzsche W, Schaper A, Jovin TM. Chromosoma. 1994;103:231–236. doi: 10.1007/BF00352247. [DOI] [PubMed] [Google Scholar]
- 51.Manickam DS, Bisht HS, Wan L, Mao GZ, Oupicky D. Journal of Controlled Release. 2005;102:293–306. doi: 10.1016/j.jconrel.2004.09.018. [DOI] [PubMed] [Google Scholar]
- 52.Danielsen S, Varum KM, Stokke BT. Biomacromolecules. 2004;5:928–936. doi: 10.1021/bm034502r. [DOI] [PubMed] [Google Scholar]
- 53.Dauty E, Remy JS, Blessing T, Behr JP. J Am Chem Soc. 2001;123:9227–9234. doi: 10.1021/ja015867r. [DOI] [PubMed] [Google Scholar]
- 54.Han WH, Lindsay SM, Dlakic M, Harington RE. Nature. 1997;386:563–563. doi: 10.1038/386563a0. [DOI] [PubMed] [Google Scholar]
- 55.Jiao Y, Cherny DI, Heim G, Jovin TM, Schaffer TE. Journal of Molecular Biology. 2001;314:233–243. doi: 10.1006/jmbi.2001.5129. [DOI] [PubMed] [Google Scholar]
- 56.Reschel T, Konak C, Oupicky D, Seymour LW, Ulbrich K. Journal of Controlled Release. 2002;81:201–217. doi: 10.1016/s0168-3659(02)00045-7. [DOI] [PubMed] [Google Scholar]
- 57.Schindler T, Nordmeier E. Macromolecular Chemistry and Physics. 1997;198:1943–1972. [Google Scholar]
- 58.Izumrudov VA, Zhiryakova MV. Macromol Chem Phys. 1999;200:2533–2540. [Google Scholar]
- 59.Kabanov A, Szoka FJ, Seymour L. Self-assembling Complexes for Gene Delivery. In: Kabanov A, Felgner P, Seymour L, editors. From Laboratory to Clinical Trial. Wiley; Chichester, UK: 1998. pp. 197–218. [Google Scholar]
- 60.Akitaya T, Seno A, Nakai T, Hazemoto N, Murata S, Yoshikawa K. Biomacromolecules. 2007;8:273–278. doi: 10.1021/bm060634j. [DOI] [PubMed] [Google Scholar]
- 61.Golan R, Pietrasanta LI, Hsieh W, Hansma HG. Biochemistry. 1999;38:14069–14076. doi: 10.1021/bi990901o. [DOI] [PubMed] [Google Scholar]
- 62.Kunath K, von Harpe A, Fischer D, Peterson H, Bickel U, Voigt K, Kissel T. Journal of Controlled Release. 2003;89:113–125. doi: 10.1016/s0168-3659(03)00076-2. [DOI] [PubMed] [Google Scholar]
- 63.Fischer D, Dautzenberg H, Kunath K, Kissel T. International Journal of Pharmaceutics. 2004;280:253–269. doi: 10.1016/j.ijpharm.2004.05.018. [DOI] [PubMed] [Google Scholar]
- 64.Grosberg AY, Nguyen TT, Shklovskii BI. Reviews of Modern Physics. 2002;74:329–345. [Google Scholar]
- 65.Thunemann AF, Muller M, Dautzenberg H, Joanny JFO, Lowne H. Polyelectrolytes with Defined Molecular Architecture Ii. 2004;166:113–171. [Google Scholar]
- 66.Suwalsky M, Traub W, Shmueli U, Subriana JA. J Mol Biol. 1968;42:363. doi: 10.1016/0022-2836(69)90049-7. [DOI] [PubMed] [Google Scholar]
- 67.Bottcher C, Endisch C, Fuhrhop JH, Catterall C, Eaton M. Journal of the American Chemical Society. 1998;120:12–17. [Google Scholar]
- 68.Mascotti DP, Lohman TM. Proceedings of the National Academy of Sciences of the United States of America. 1990;87:3142–3146. doi: 10.1073/pnas.87.8.3142. [DOI] [PMC free article] [PubMed] [Google Scholar]
- 69.Pastre D, Hamon L, Landousy F, Sorel I, David MO, Zozime A, LeCam E, Pietrement O. Langmuir. 2006;22:6651–6660. doi: 10.1021/la053387y. [DOI] [PubMed] [Google Scholar]
Associated Data
This section collects any data citations, data availability statements, or supplementary materials included in this article.