

Abstract
Electrical actuators made from films of dielectric elastomers coated on both sides with stretchable electrodes may potentially be applied in microrobotics, tactile and haptic interfaces, as well as in adaptive optical elements. Such actuators with compliant electrodes are sensitive to the pull-in electromechanical instability, limiting operational voltages and attainable deformations. Electrode-free actuators driven by sprayed-on electrical charges were first studied by Röntgen in 1880. They withstand much higher voltages and deformations and allow for electrically clamped (charge-controlled) thermodynamic states preventing electromechanical instabilities. The absence of electrodes allows for direct optical monitoring of the actuated elastomer, as well as for designing new 3D actuator configurations and adaptive optical elements.
Keywords: electroactive polymers, dielectric materials, dielectric breakdown, adaptive optics, Maxwell stress
Dielectric elastomer actuators (DEAs) consist of synthetic elastomer films sandwiched between compliant electrodes. For operation, the actuators are connected to a driving voltage source. They emerged as one of the most promising technologies for soft matter–based electromechanical transduction since their discovery by researchers from Stanford Research Institute (1). Coulomb forces between the electrodes squeeze the elastomer in the thickness direction and cause the incompressible elastomer to expand in area. Such “deformable capacitor” designs have shown a cornucopia of potential applications, such as artificial muscles (2) and other bionic applications (3), complex minimum-energy actuators with three-dimensional movements (4 –7), energy harvesters (8, 9), adaptive optical elements (10), etc.; commercially available adaptive optical elements are described, for example, at http://www.optotune.com. Deformable capacitors are always sensitive to the electromechanical pull-in instability (11 –14), which has been first reported to limit the apparent breakdown voltage of soft materials (15), and which has been beautifully demonstrated with closely spaced soap films, which easily deflect measurably under high voltages (16). When the elastomer actuator is subject to a voltage, the elastomer thins down. Thereby, the same voltage induces an increasing electric field in the elastomer and so an increasing attractive force between the oppositely charged electrodes. At the pull-in voltage, this positive feedback causes the elastomer to thin down drastically, finally resulting in electrical breakdown. The pull-in instability is prevented when the elastomer actuator is operated in a charge-controlled mode, because in this case no positive feedback mechanism increases the electric field in the elastomer.
Electrical deformation of solid materials was observed shortly after the invention of the Leyden jar by Fontana, as noted by Volta (17). Such electrical changes in the volume of the Leyden jar were the subject of intense investigations in the late 19th century. Quincke, for example, experimented with Leyden jars made from natural caoutchouc and reported electrically induced volume changes of the jar, which he ascribed to a volume increase of the caoutchouc, roughly proportional to the square of the potential difference between the inner and outer surface of the jar (18). Röntgen criticized Quincke’s findings and introduced a simple experiment that illustrates the electrical deformation of a stretchable body (19). Röntgen used a 16-cm-wide and 100-cm-long stripe of natural rubber, prestretched by a weight to twice its initial length. Upon electrification with sprayed-on electric charges, he was able to observe length changes on the order of several centimeters.
Repeating the experiment of Röntgen with today’s materials not only provides an elegant experiment for visualizing the large electrostatic deformations attainable in soft matter, it also allows electrically clamped (charge-controlled) thermodynamic states that are otherwise impossible to access with electrode-coated, electrically free operating actuators (voltage-controlled; originally the term “electrically free” was defined for crystals where the electric field E was dictated by the applied voltage due to a nearly constant thickness; this is not fully valid for soft materials, but it is conventional to use the term in conjunction with “electrically clamped”). Thereby, pull-in instabilities are prevented, giving a nearly unlimited actuation range for actuators (only restricted by the materials breakdown strength). Electrode-free actuator operation will be illustrated with a bending minimum-energy elastomer actuator and a tunable optical lens.
Results
Experimental Analysis of Electrode-Free Elastomer Actuators.
The experimental setup for a quantitative analysis of the Röntgen experiment is shown schematically in Fig. 1 and as a photo sequence in Fig. 2. The framework uses an optical rail system where a charging unit is able to move up and down along the elastomer. The charging unit contains two opposed combs of needle electrodes with a separation of 3 cm. Additionally, two opposed Trek Kelvin probe heads are mounted below the needles to enable surface potential measurements on the two surfaces of the elastomer, as illustrated in Fig. S1. Between the optical rails a guideway is placed to pilot an expanding elastomer strip prestretched by the attached mass. Details of the experimental procedure and measurement techniques are described in Materials and Methods and in SI Text. Three charging cycles at each of the corona voltages of 14, 17, 20, and 23 kV between the two needle setups were initially used, giving stretch ratios up to 1.15, as depicted in Fig. 3. By additionally employing three more charging cycles at 23 kV, a stretch ratio exceeding 1.2 has been achieved. These experimental results reveal a drop of the surface potential difference with increasing deformation after passing a maximum of about 17 kV. This value would be the ultimate limit for conventional voltage-controlled actuators because it would be followed by the pull-in electromechanical instability destroying the actuator. Here, however, the electrically clamped operation enables further deformation and stable states beyond the limits of pull-in. The set of data with the highest stretch ratio has more charges on the elastomer than the set with the stretch ratio 1.15, although the voltage is smaller. This results from the thinning of the elastomer (accompanied by the increase in its area); thereby, more charges on the elastomer result in voltages lower than the pull-in value (illustrated in Fig. S2). Breakdown fields of elastomers are usually measured with attached electrodes and are therefore limited by the pull-in instability (16). Materials-related breakdown fields are significantly larger, because our experiments show that stable states beyond pull-in are experimentally accessible. In the subsequent theoretical part, these experimental results are analyzed based on thermodynamic modeling.
Fig. 1.

Linear elastomer actuator geometry pioneered by W.C. Röntgen in 1880. Charges are sprayed on the elastomer by needle combs under high voltage.
Fig. 2.

The image sequence shows the expansion of the elastomer as a result of gradual charging starting at the top. The charging voltage used to produce the pictures was 25 kV.
Fig. 3.

Secondary stretch λ sx resulting from an incremental increase of the surface charge Q versus the potential difference measured with Kelvin probes on both sides of the elastomer stripe. The colored triangles are sets of data measured in different trials. The solid and dashed curve corresponds to a fit by the second equation of Eq. 8 as explained in the text. Under voltage-controlled, electrically free conditions only the solid line corresponds to stable states limited by the pull-in electromechanical instability. Charge-controlled, electrically clamped conditions stabilize the equilibria even beyond the pull-in limitation.
To illustrate the extreme deformations achievable by spraying charges onto the surfaces of an elastomer, we prestretched a square piece (5 × 5 cm) of the tape to a rigid, circular frame with a diameter of 10.4 cm (Fig. 4). Two needle electrodes were placed near the surfaces of the elastomer, and a circular area in the center of the frame was marked with a ballpoint pen to make small deformations visible. To produce the image sequences in Fig. 4, corona voltages of 0, 10, 15, and 25 kV were used from A to D. From A to B, the marked ring expands visibly. In C regular sinusoidal wrinkles appear, and in D the wrinkles become irregular. It is obvious that state D can only be realized with an extremely deformed elastomer. After removal of the corona, the wrinkles disappear, and the initial configuration similar to A is restored over several minutes. The experiment is visualized with a video file Movie S1 provided in SI Text. In this video, a moderate voltage with the opposite polarity is used for discharging, and the relaxation takes only a few seconds.
Fig. 4.

Radially prestretched elastomer on a rigid frame of 52-mm radius, charged by corona discharge from two needle electrodes. As the corona voltage increases from 0 V in A up to approximately 25 kV in D, the elastomer first thins and expands in lateral directions as indicated by an ink dot ring (B). Regular wrinkles appear in C, and finally extreme irregular deformations become possible (D). After the removal of corona discharge, the wrinkles disappear, and the initial configuration similar to A is restored.
Fig. 5 shows the operation of an electrode-free minimum-energy bending actuator with large actuation range. In the bending actuator, a prestretched elastomer is glued on a flexible frame. Upon release, the actuator bends by minimizing the total free energy consisting of the bending energy of the frame (which increases with increase in the bending angle) and the stored elastic energy of the prestretched elastomer (which decreases with bending angle as this decreases elastomer deformation) (5, 6). For the bending actuator to work, it is sufficient to place two needle electrodes near the surfaces. In this case, electrostatic energy adds to the total energy of the elastomer, which makes its decrease with the bending angle less pronounced (5). Therefore, the equilibrium bending angle decreases with the applied voltage. In the image sequences in Fig. 5, we placed a goniometer behind the actuator to demonstrate the large actuation angle of the DEA. The corona voltage is increased from 0 V in A to 14 kV in B, to 17 kV in C, and to 20 kV in D. If the voltage is reset to 0 V, the actuator returns to state A in a few seconds, which can be accelerated by applying a moderate voltage of the opposite sign (see video file Movie S2 in SI Text). From Fig. 5 it is evident that the total actuation angle is about 100°. The speed of the bending operation is currently limited by our unipolar voltage source, which prevents fast switching from positive to negative voltages. We expect the operation frequency of the actuators to be limited to a few hertz, sufficient for most of the anticipated applications of such actuators.
Fig. 5.

Photo sequence of an electrode-free minimum-energy bending actuator with large actuation range. As the corona voltage increases from 0 V in A up to approximately 20 kV in D, the elastomer thins and expands laterally. After removal of the corona discharge, the initial configuration (A) is restored.
Fig. 6 shows a sketch of an adaptive lens with variable focal length and aperture, and two photos of the device. In the charged state (Fig. 6 Right) the lens thins down, thereby increasing the focal length from its initial value of 210 to 266 mm with a corona voltage of 15 kV. The focal length has been obtained from the known object distance and magnification. The lens is formed by a water drop encapsulated between two elastomer layers. In the images of the device also shown in Fig. 6, the voltage of the corona needles is increased from 0 V (Fig. 6 Left) to 15 kV (Fig. 6 Right). When the voltage is removed, the lens returns to its initial state in a few seconds. This process is accelerated by applying moderate voltage of opposite sign to the needle electrodes. The two images reveal the increase of both aperture and focal length of the lens when actuated.
Fig. 6.

Adjustable lens with variable focal length and aperture. A drop of water is enclosed between two layers of elastomer. As the corona voltage increases from 0 V (Left) up to high voltage (HV) of approximately 15 kV (Right), both the aperture and the focal length increase because of the attraction between the elastomer layers.
Thermodynamic Modeling.
The experimental results shown in Fig. 3 are now analyzed in terms of a rigorous thermodynamic model. From the theoretical point of view, our approach to the linear actuator setup proposed by Röntgen is similar to that of Zhao and Suo (12). There exist, however, several differences of various importance. We have chosen to use natural physical variables, such as voltage U and charge Q, rather than nominal electric field and displacement that are proportional to them. Furthermore, even when talking about voltage-controlled systems, we do not consider charge as a separate variable. Rather, we consider it as a “fast variable,” which “instantaneously” relaxes to its equilibrium value dictated by the applied voltage. In reality, this happens over the resistor-capacitor (RC) time constant of the system, which is much faster than the time scale of mechanical deformations. With given voltage or charge, the number of variables is reduced to two stretch ratios only, which facilitates modeling. In the subsequent analysis, we proceed analytically as far as possible, mainly by using equilibrium conditions before and after corona charging.
Let the initial dimensions of the elastomer be x i, y i, and z i before the application of a weight with mass m, and x p, y p, and z p after that (subscript p stands for prestretch) (an illustration can be found in Fig. S3). Both sets of dimensions can be measured, but the transition from the i to the p state occurs over a long time scale and is partly viscoelastic. Therefore, i is not the reference state for the prestretch in fast measurements with sprayed-on charges. True prestretch takes place from the auxiliary state 0, which is observed experimentally when the weight is removed from the uncharged elastomer to let it relax on the fast time scale, retaining only the viscoelastic deformation. This is experimentally challenging, and the dimensions x 0, y 0, and z 0 were not measured directly.
For this reason, we use 0 rather than i as the initial reference state in the general development of the theory, but the measurable p state for the definitions of physical parameters, such as capacitance or deformation. The true prestretch λ px ≡ x p/x 0 and similar ratios are important, as they define elastic energy. We deduce them from indirect measurements as discussed below. To refer the deformation to the state p, we explicitly separate the overall stretch λ x ≡ x/x 0 into a prestretch and a secondary stretch (subscript s) λ sx ≡ x/x p, so that λ x = λ px λ sx for all dimensions x, y, and z. Of course, all derivations can be done equivalently in terms of λ x only, as was done in ref. 12.
We use the neo-Hookean expression 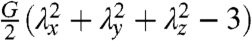 for the elastic energy density (21). As we factor out the viscoelastic part of the prestretch, the shear modulus G here is the fast one. Because of volume conservation, V = xyz = x
p
y
p
z
p = x
0
y
0
z
0 and λ
x
λ
y
λ
z = λ
px
λ
py
λ
pz = λ
sx
λ
sy
λ
sz = 1. The Poisson ratio of most elastomers is close to 0.5 (20); for the 3M™ VHB™ tape used, the manufacturer claims at least 0.49; literature values have indicated a Poisson ratio of 0.499 (21). However, deviations from incompressible conditions can be taken into account when necessary by modifying the hyperelasticity function. Volume conservation allows us to eliminate all z stretch ratios. We express the gravitational energy of the attached weight using the stretch ratio with respect to the p state: -mgx = -mgx
p
λ
sx. The mass m here includes also half of the mass of the elastomer itself, which is usually small. Then, the (free) energy of the uncharged elastomer can be written as
for the elastic energy density (21). As we factor out the viscoelastic part of the prestretch, the shear modulus G here is the fast one. Because of volume conservation, V = xyz = x
p
y
p
z
p = x
0
y
0
z
0 and λ
x
λ
y
λ
z = λ
px
λ
py
λ
pz = λ
sx
λ
sy
λ
sz = 1. The Poisson ratio of most elastomers is close to 0.5 (20); for the 3M™ VHB™ tape used, the manufacturer claims at least 0.49; literature values have indicated a Poisson ratio of 0.499 (21). However, deviations from incompressible conditions can be taken into account when necessary by modifying the hyperelasticity function. Volume conservation allows us to eliminate all z stretch ratios. We express the gravitational energy of the attached weight using the stretch ratio with respect to the p state: -mgx = -mgx
p
λ
sx. The mass m here includes also half of the mass of the elastomer itself, which is usually small. Then, the (free) energy of the uncharged elastomer can be written as
 |
[1] |
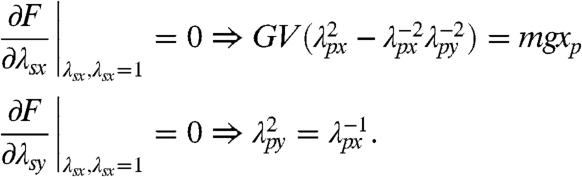
Because of viscoelastic effects, we cannot take the prestretch ratios λ px,py directly from the experiment, but they should minimize the free energy at the equilibrium p state. Namely, the minimum as a function of λ sx and λ sy should be achieved at values λ sx = λ sy = 1. This results in
 |
[2] |
The first expression relates the prestretch to the applied weight and elastic properties of the material. The second expression merely signifies that the elastomer is uniaxially prestretched.
Electrostatic Energy.
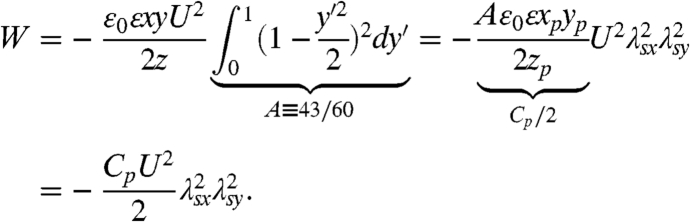
The derivation of the electrostatic energy is discussed in detail in SI Text, because elastomers with sprayed-on charges differ significantly from electrode-loaded capacitors. Charges need not be symmetrical on both sides, so a careful analysis of the electrostatic problem is required. From experiments we found that the voltage is about constant in the long (x) direction and approximately parabolic in the y direction, with a maximum value U in the middle and half of this value, U/2, at the edge. This results in an electrostatic energy:
 |
[3] |
Here, C p (or more accurately C p/A) has the meaning of the elastomer capacitance before the start of corona charging. The coefficient A is related to the inhomogeneity in voltage, or, more generally, of thickness and dielectric constant as well. In practice, C p is used as a fitting parameter within an admissible range.
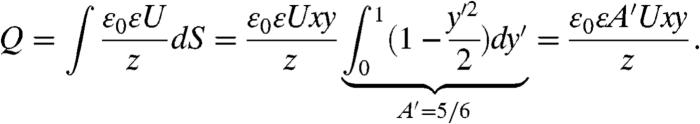
For the charge-controlled case, the overall charge on each surface stays constant. To keep the similarity with conventional capacitors, we consider half of the total charge difference between the surfaces, Q. It is related to the voltage via
 |
[4] |
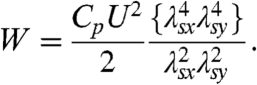
The energy can be written as the first expression in Eq. 3 (with the opposite sign, because the system is closed and the external source does not perform any work), but one has to group together the terms that stay constant upon deformation: 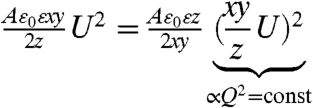 . The expression in brackets stays constant during the minimization of energy, but the total charge changes from measurement to measurement, together with the measured voltage. If we exclude z stretch, this can be expressed as follows:
 |
[5] |
Here, U
2 and the combination  in braces originate from the constant charge and should not be differentiated when we search for the equilibrium or study its stability. However, λ
sx and λ
sy should be treated as variables when we resolve the resulting equations to find the actual stretch values as a function of measured voltage U or other parameters.
in braces originate from the constant charge and should not be differentiated when we search for the equilibrium or study its stability. However, λ
sx and λ
sy should be treated as variables when we resolve the resulting equations to find the actual stretch values as a function of measured voltage U or other parameters.
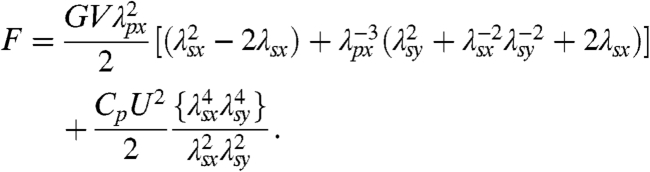
Using the equilibrium relations in Eq. 2, we can now exclude λ py and either mgx p or the product GV from the elastic energy expression in Eq. 1. For brevity, we also omit the constant -3 term. Together with the charge-controlled electrostatic contribution from Eq. 5, this results in the following total free energy:
 |
[6] |
The consideration of the voltage-controlled case in Eq. 3 is similar. We pulled  out of the square brackets to show how it influences the elastic energy. The leading terms in the square brackets are then related to the measurable secondary stretch ratio λ
sx. Using the equality
out of the square brackets to show how it influences the elastic energy. The leading terms in the square brackets are then related to the measurable secondary stretch ratio λ
sx. Using the equality 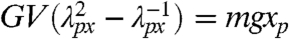 , which follows from Eq. 2, one can replace
  . The choice between these two expressions is that of more physical fitting. The expression with the mass relies only on the quantities that are directly measured. But in both cases we have to find λ
px, which cannot be directly measured because of viscoelastic effects.
. The choice between these two expressions is that of more physical fitting. The expression with the mass relies only on the quantities that are directly measured. But in both cases we have to find λ
px, which cannot be directly measured because of viscoelastic effects.
The equilibrium condition for the energy expression in Eq. 6 corresponds to its minimum with respect to λ sx and λ sy:
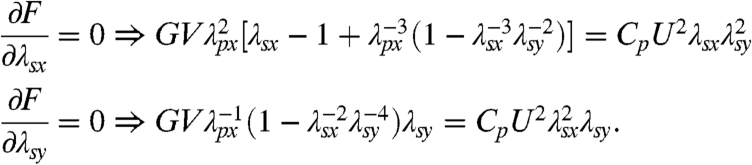 |
[7] |
By dividing these equations onto each other one can express λ sy via λ sx in equilibrium and then write the transcendental equation for λ sx:
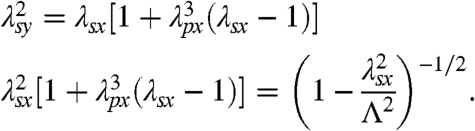 |
[8] |
Here, we introduced the dimensionless combination 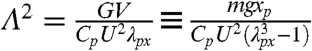 . It characterizes the ratio of the elastic and electrostatic energies, and
  is inversely proportional to the applied voltage. It is worth noting that it does not depend on the measured x
p value (because C
p is proportional to it). Let us first consider the small voltage (large
is inversely proportional to the applied voltage. It is worth noting that it does not depend on the measured x
p value (because C
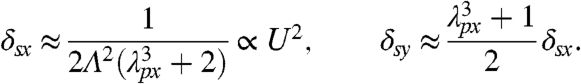
p is proportional to it). Let us first consider the small voltage (large  ) behavior. Taylor expansion with small secondary strains δ
sx,sy ≡ λ
sx,sy - 1 ≪ 1 results in
) behavior. Taylor expansion with small secondary strains δ
sx,sy ≡ λ
sx,sy - 1 ≪ 1 results in
 |
[9] |
This implies that the increases in both stretch ratios are proportional to the voltage squared, which can be seen in Fig. 3. The ratio of these increases (which can be measured) defines the real nonviscoelastic prestretch λ px. More accurately, it can be found from the fitting of the first equation of Eq. 8 over a broad range of voltages. From the fit, a value of λ px = 1.42 (for an initially 50-mm-wide elastomer tape) is obtained. The quality of the fitting is documented in Fig. S4. The last experimental point lies in the wrinkling regime, and the true extension λ sy is actually higher, making the agreement even better. From the physical point of view, the λ px value should lie between 1 and the ratio x p/x i ∼ 3. Another way to actually measure λ px is to let the uncharged elastomer relax without weight to the 0 state on the fast time scale. This results in a prestretch ratio λ px = x p/x 0 ∼ 1.5 to 1.6, which is a reasonable agreement. This method is less accurate however, due to difficulties of exactly defining the fast time scale. When λ px is determined, the dependence of secondary stretch on the applied voltage, λ sx(U), should be found from the solution of the second transcendental equation in Eq. 8. This is done in Fig. 3, which shows two branches of equilibrium solutions as a function of measured voltage. The overall charge increases along the curve as shown by the arrow. The fitting parameter C p = 533 pF used for the calculated curves is in reasonable agreement with typical material values (ε ≈ 4.2) and measured dimensions of the p state given in Materials and Methods.
Voltage-Controlled Case.
It is easy to verify, that the equilibrium conditions in Eq. 7 are identical for the voltage-controlled case with the electrostatic energy from Eq. 3. Thus, both cases have the same dependence of equilibrium secondary stretch on measured voltage. This is understandable, because elastic and electrostatic forces are fully determined by the geometry and therefore balance each other in equilibrium at equal values of variables. This argument does not, however, extend to the overall behavior of energy in both systems. In particular, the number of extrema for fixed controlled parameters, as well as their stability [determined by the Hessian of the free energy with respect to λ sx and λ sy (12)] is not the same in both cases. Straightforward, though a bit tedious, calculations show that the charge-controlled case always has a single stable equilibrium, whereas the voltage-controlled case has one minimum and one (unstable) saddle point. The latter becomes stable in the charge-controlled case and corresponds exactly to the upper branch of solutions shown by the dashed curve in Fig. 3. This is in full agreement with the general results of Zhao and Suo (12). In fact, our results based on 2D Hessians are identical with those of Zhao and Suo where 3D Hessians were used. All this can be generalized to arbitrary Legendre-conjugate systems, which will be considered elsewhere.
Discussion
We studied experimentally and analyzed theoretically electrode-free DEAs first suggested by Röntgen (see the historical discussion in Figs. S5 and S6). In this setup, charges from a corona discharge are sprayed on both sides of an elastomer. The problem of electrode degradation and cracking upon stretching is thereby removed. The absence of electrodes and the trapping of charges on the surface allow the system to withstand much higher voltages and electric fields without a global breakdown that disrupts device operation. This allows one to achieve much higher deformations and try out complex 3D geometries with large actuation range, leading to new actuator designs.
Conducting electrodes are inherently equipotential. A free flow of charges along conducting electrodes automatically leads to their concentration near the edges and (if present) corners and protrusions of the structure. In contrast, deposition of charges at desired positions can be performed dynamically and quite inhomogeneously (22). This permits one (in principle) to achieve a much wider scope of electrostatic contributions to the DEA energetics, which may become especially important for complex 3D geometries. In particular, trapped charges (which do not redistribute freely toward the edges of equipotential surfaces) may contribute to additional lateral Maxwell stresses and larger deformations.
The elastomer without electrodes is transparent and can be monitored using optical techniques. In addition, it can be used to build adaptive optical elements; as an example, we demonstrated lenses with variable focus and aperture based on the Röntgen setup.
From the theoretical point of view, such a setup represents a charge-controlled case, disconnected from the external source, with thermodynamics and energetics different from that of conventional DEAs. States with extreme deformations, which are unstable when the electrodes are present, are stabilized and become accessible for experimental observations. This can be used for materials testing and characterization under severe conditions essential for a safe operation of DEAs. Additional lateral stresses and global potential energy terms may appear because of the trapping of charges on the elastomer surface. This has been addressed mathematically.
By comparing stretches in both lateral directions, we were able to factor out viscoelastic effects and achieve a theoretical description that is virtually free of fitting parameters. Further work may go toward lowering the voltage and miniaturization of the system (for example, using thinner elastomers and carbon-nanotube field emitters) and toward deeper analysis of 3D configurations, including wrinkling.
Materials and Methods
The elastomer samples used for the measurements in corona-charging experiments were 100-mm-long, 50-mm-wide, and 1-mm-thick stripes of a 3M™ VHB™ 4910 acrylic elastomer tape. Upon loading with a weight of mass m = 150 g, they typically expand within 24 h to 310 × 28 × 0.576 mm. The relaxation time of 24 h allows the viscoelastic drift of the VHB™ elastomer tape to level off. The following experiments occur on short time scales (minutes) where viscoelastic effects can be ruled out.
The corona needles were connected to a dc high-voltage power supply (model HCL 140–35000, provided by F.u.G. Elektronik GmbH). To maximize the homogeneity of the surface charge distribution in the vertical direction, we moved the charging unit up and down slowly (one cycle ∼30 s). Reproducibility has been checked by three independent measurement sets.
The surface potential difference has been determined with a Trek Model 341A electrostatic voltmeter based on the Kelvin probe technique. (Further information about the Kelvin probe technique and the setup is given in SI Text.) The surface potential along and across the elastomer stripe was recorded on the two surfaces after each cycle. The potential distribution was reproducible with a maximum in the middle of the lateral direction dropping to approximately half the maximum value at the borders. In the vertical dimension, the potential difference was found to be constant within experimental error. The voltage depicted in Fig. 3 refers to the maximum potential difference in the middle of the elastomer stripe.
The elastomer used for the experiments depicted in Fig. 4 and applications shown in Figs. 5 and 6 was the same as in corona-charging experiments.
Supplementary Material
Acknowledgments.
The work was partially supported by the Austrian Science Fund under Grant P20971-N20.
Footnotes
The authors declare no conflict of interest.
This article contains supporting information online at www.pnas.org/cgi/content/full/0913461107/DCSupplemental.
References
- 1.Pelrine R, Kornbluh R, Pei Q, Joseph J. High-speed electrically actuated elastomers with strain greater than 100% Science. 2000;287:836–839. doi: 10.1126/science.287.5454.836. [DOI] [PubMed] [Google Scholar]
- 2.Carpi F, De Rossi D, Kornbluh R, Pelrine R, Sommer-Larsen P. Dielectric Elastomers as Electromechanical Transducers: Fundamentals, Materials, Devices, Models and Applications of an Emerging Electroactive Polymer Technology. Oxford, UK: Elsevier; 2008. [Google Scholar]
- 3.Bar-Cohen Y, David Hanson. The Coming Robot Revolution: Expectations and Fears About Emerging Intelligent, Humanlike Machines. New York: Springer; 2009. [Google Scholar]
- 4.Kofod G, Paajanen M, Bauer S. Self-organized minimum-energy structures for dielectric elastomer actuators. Appl Phys A: Mater Sci Process. 2006;85:141–143. [Google Scholar]
- 5.Kofod G, Wirges W, Paajanen M, Bauer S. Energy minimization for self-organized structure formation and actuation. Appl Phys Lett. 2007;90:081916. [Google Scholar]
- 6.O'Brien B, McKay T, Calius E, Xie SN, Anderson I. Finite element modelling of dielectric elastomer minimum energy structures. Appl Phys A: Mater Sci Process. 2009;94:507–514. [Google Scholar]
- 7.Zhao X, Suo Z. Method to analyze programmable deformation of dielectric elastomer layers. Appl Phys Lett. 2008;93:251902. [Google Scholar]
- 8.Pelrine R, et al. Dielectric elastomers: Generator mode fundamentals and applications. Proc SPIE Int Soc Opt Eng. 2001;4329:148–156. [Google Scholar]
- 9.Koh A, Zhao X, Suo Z. Maximal energy that can be converted by a dielectric elastomer generator. Appl Phys Lett. 2009;94:262902. [Google Scholar]
- 10.Aschwanden M, Stemmer A. Polymeric, electrically tunable diffraction grating based on artificial muscles. Opt Lett. 2006;31:2610–2612. doi: 10.1364/ol.31.002610. [DOI] [PubMed] [Google Scholar]
- 11.Plante JS, Dubowsky S. Large-scale failure modes of dielectric elastomer actuators. Int J Solids Struct. 2006;43:7727–7751. [Google Scholar]
- 12.Zhao X, Suo Z. Method to analyze electromechanical stability of dielectric elastomers. Appl Phys Lett. 2007;91:061921. [Google Scholar]
- 13.Zhao X, Hong W, Suo Z. Electromechanical coexistent states and hysteresis in dielectric elastomers. Phys Rev B: Condens Matter Mater Phys. 2007;76:134113. [Google Scholar]
- 14.Keplinger C, Kaltenbrunner M, Arnold N, Bauer S. Capacitive extensometry for transient strain analysis of dielectric elastomer actuators. Appl Phys Lett. 2008;92:192903. [Google Scholar]
- 15.Stark KH, Garton CG. Electric strength of irradiated polythene. Nature. 1955;176:1225–1226. [Google Scholar]
- 16.Taylor G. The coalescence of closely spaced drops when they are at different electric potentials. Proc R Soc Lond A. 1968;306:423–434. [Google Scholar]
- 17.Volta A. Lettere Inedite di Allesandro Volta scritto dal professore Pietro Gonfigliacchi (Pesaro stamperia nobili) (Unpublished letters of Allesandro Volta, collected by Pietro Gonfigliacchi)
- 18.Quincke G. Ueber electrische Ausdehnung. Ann Phys Chem. 1880;10:163–553. [Google Scholar]
- 19.Röntgen WC. Ueber die durch Electricität bewirkten Form—und Volumenänderungen von dielectrischen Körpern. Ann Phys Chem. 1880;11:771–786. [Google Scholar]
- 20.Treloar LRG. The Physics of Rubber Elasticity. Oxford, UK: Oxford Univ Press; 1975. [Google Scholar]
- 21.Beck MD, Aschwanden M, Belyaev Y, Stemmer A. Tunable optical active elements. European Patent Application EP1826591. 2006 Available at http://www.freepatentsonline.com/EP1826591.html.
- 22.Jacobs HO, Whitesides GM. Submicrometer Patterning of Charge in Thin-Film Electrets. Science. 2001;291:1763–1766. doi: 10.1126/science.1057061. [DOI] [PubMed] [Google Scholar]
Associated Data
This section collects any data citations, data availability statements, or supplementary materials included in this article.