

Abstract
Thalamocortical and corticothalamic pathways mediate bidirectional communication between the thalamus and neocortex. These pathways are entwined, making their study challenging. Here we used lentiviruses to express channelrhodopsin-2 (ChR2), a light-sensitive cation channel, in either thalamocortical or corticothalamic projection cells. Infection occurred only locally but efferent axons and their terminals expressed ChR2 strongly, allowing selective optical activation of each pathway. Laser stimulation of ChR2-expressing thalamocortical axons/terminals evoked robust synaptic responses in cortical excitatory cells and fast-spiking (FS) inhibitory interneurons, but only weak responses in somatostatin-containing interneurons. Strong FS cell activation led to feedforward inhibition in all cortical neuron types, including FS cells. Corticothalamic stimulation excited thalamic relay cells and inhibitory neurons of the thalamic reticular nucleus (TRN). TRN activation triggered inhibition in relay cells but not in TRN neurons. Thus, a major difference between thalamocortical and corticothalamic processing was the extent to which feedforward inhibitory neurons were themselves engaged by feedforward inhibition.
Introduction
The neocortex, the thalamus, and the axonal tracts that connect them comprise the vast majority of the mammalian brain and are crucial for sensation, perception and consciousness (Mountcastle, 1998). Thalamocortical (TC) pathways are the major extrinsic input to neocortex, and corticothalamic (CT) pathways are a principal source of input to thalamus. Slice preparations that preserve TC and CT connections have been valuable tools for understanding mechanisms by which neocortex and thalamus process these inputs (Agmon and Connors, 1991; Cruikshank et al., 2002). Traditionally, the thalamus has been activated electrically or chemically and resulting cortical responses have been recorded with electrophysiological or optical techniques. An analogous approach can be used to study CT processing. TC and CT slice preparations permit intracellular recordings of multiple targeted neurons, allowing direct comparisons of responses among different cell classes, including di/polysynaptic responses (Cruikshank et al., 2007; Gabernet et al., 2005; Inoue and Imoto, 2006; Sun et al., 2006).
A major limitation of slice preparations is that all necessary circuitry must fit within a thin slab (usually ≤ 0.5 mm) in order to maintain viability and oxygen diffusion to the slice center (Alger, 1984; Hajos et al., 2009). Most TC and CT pathways are severed in such slices. Also, temporally precise control of TC or CT input in slices usually requires electrical stimulation, which can activate non-targeted neurons/processes near the stimulating electrodes. This is a potential problem because the thalamus and cortex are reciprocally connected and TC and CT axons lie closely adjacent. Attempts to activate one pathway can stimulate axons of the other pathway. For example, stimuli intended to activate CT input to the thalamic reticular nucleus (TRN) can antidromically activate TC axons, which in turn make strong collateral synapses with the TRN (Gentet and Ulrich, 2004; Golshani et al., 2001; Zhang and Jones, 2004). Here we apply an optogenetic strategy to overcome these limitations.
Channelrhodopsin-2 (ChR2) is a light sensitive algal cation channel (Nagel et al., 2003) that can be expressed in mammalian neurons, enabling those neurons to be excited by blue light with high temporal precision (Boyden et al., 2005; Cardin et al., 2009; Gradinaru et al., 2007). Petreanu et al. (2007) showed that ChR2 could be expressed in cortical neurons that project through the corpus callosum. Critically, enough ChR2 was expressed in the axons and terminals of those neurons that the terminal arbors themselves could be directly excited by light, triggering transmitter release without the need for illumination of parent somata in the contralateral hemisphere.
Here we asked if an analogous use of ChR2 might be applied to studies of TC and CT pathways to solve problems associated with classical stimulation methods. We injected lentiviruses carrying genes for a ChR2/enhanced yellow fluorescent protein fusion construct (ChR2/EYFP) into either somatosensory cortex or thalamus of mice in vivo. After allowing at least one week for expression, we made brain slices for recording. ChR2/EYFP was expressed by neurons at the injection sites, involving their somadendritic membranes, axons and terminal arbors. No retrograde expression was seen in either the TC or CT pathway. Excitation of ChR2-expressing axons with laser light evoked robust and pathway-specific synaptic responses in their targets. We used this approach to examine and compare the functional properties of circuits engaged by TC and CT pathways, revealing differences in principles of feedforward processing that could not have been clearly determined using conventional techniques.
Results
Selective ChR2-mediated optical stimulation of the TC pathway
One to three weeks after thalamic injections of lentiviruses carrying ChR2/EYFP fusion genes, there was intense ChR2/EYFP expression in thalamic relay cells and their TC projections in neocortex (Figure 1). The majority of injections involved the ventrobasal (VB) thalamus. In those cases labeled cortical projections were observed in somatosensory cortex, with labeled axon arbors concentrated in layer 4 barrels and in a band between layers 5/6, precisely where VB relay cells terminate (Agmon et al., 1993; Bernardo and Woolsey, 1987). The EYFP-expressing terminal plexus could be seen in living slices during recording sessions and in fixed sections subsequently (Figure 1A, B). High magnification confocal images revealed that membranes of VB somata around the injection site were labeled. In contrast, although there was dense labeling of TC axons and terminals in cortex, there was no apparent expression in cortical somata, suggesting that CT projection cells did not undergo retrograde infection following thalamic lentivirus injections (Figure 1B).
Figure 1. Lentivirus injections into thalamus produced ChR2/EYFP expression in TC relay cells, including their axonal projections within cortex.
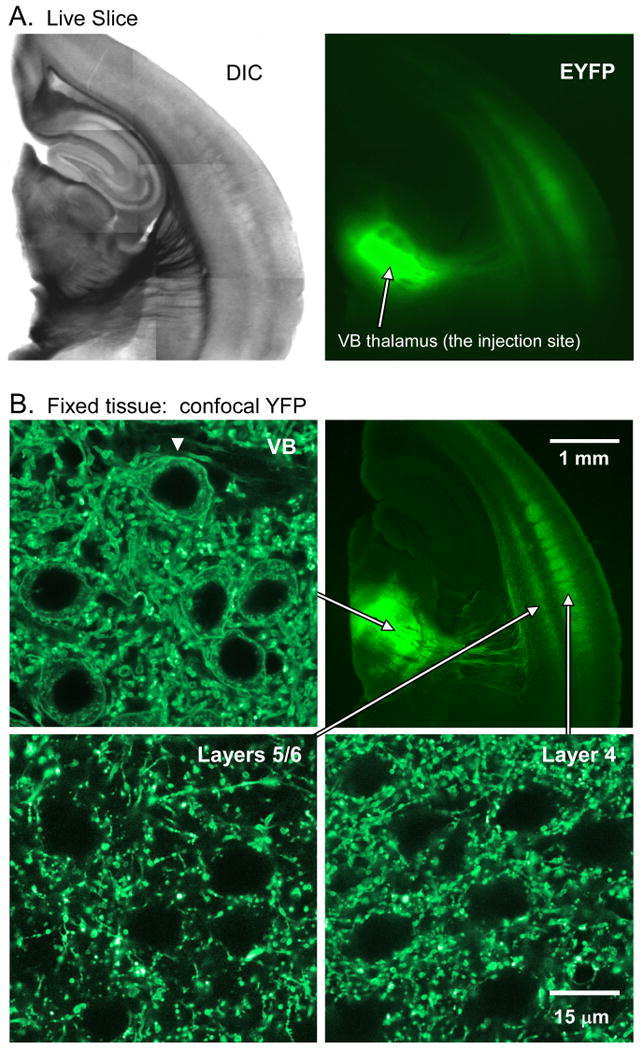
A. A live 300 μm thick slice on P30. VB thalamus was injected with 1.5 μl of lentivirus on P15. A(left): DIC image. A(right): EYFP fluorescence for same slice (indicating location of ChR2/EYFP). Notice intense EYFP signal in VB and in TC arbors in cortical layer 4 and the layer 5/6 border. B. Images from same hemisphere (different slice) after fixation. B(top right): Low magnification fluorescence image from a 40 μm thick section. B(top left): High magnification confocal image from VB (1 μm thick optical section). Notice the EYFP labeled somata, visible as thin rings of labeled membrane surrounding unlabeled nuclei. There is also intense neuropil label. B(bottom): images of cortical labeling from layers 4 and 5/6 (same acquisition parameters as VB). Cortex has intense neuropil label (especially layer 4) but no labeled somata. Using confocal imaging we examined additional slices to determine if CT cells in layers 5/6 became retrogradely infected following thalamic injections. We chose 7 well labeled slices from 3 hemispheres (all 300 μm thick). For each slice, we searched three 133 × 133 μm areas of layer 5/6, in regions of intense EYFP expression. For each search area, at least 3 focal planes were examined. We found no labeled cortical somata. In contrast labeled thalamic somata were readily observed around injection sites, similar to B(top left).
ChR2-expressing relay cells in and around thalamic injection sites responded directly to light. Laser stimuli flashed onto these cells evoked depolarizations with very short onset latencies (0.09 ± 0.02 ms; range 0.05 to 0.15 ms, n = 7; Figures 2, S1). These onsets were too fast to be mediated synaptically but were consistent with direct ChR2-mediated conductances (Nagel et al., 2003; Sabatini and Regehr, 1999). Depolarizations were strong enough to evoke spikes in 5 of 7 thalamic cells tested. Sustained laser stimuli (500-600 ms) evoked responses with large initial peaks followed by smaller desensitized components that were sustained throughout the stimuli, as expected for direct ChR2-mediated responses (n = 4; Figure 2C) (Berndt et al., 2009; Lin et al., 2009; Nagel et al., 2003). The dynamics of direct responses in ChR2-expressing cells are described further in Figure S2.
Figure 2. ChR2-expressing thalamic cells responded directly to laser stimuli.
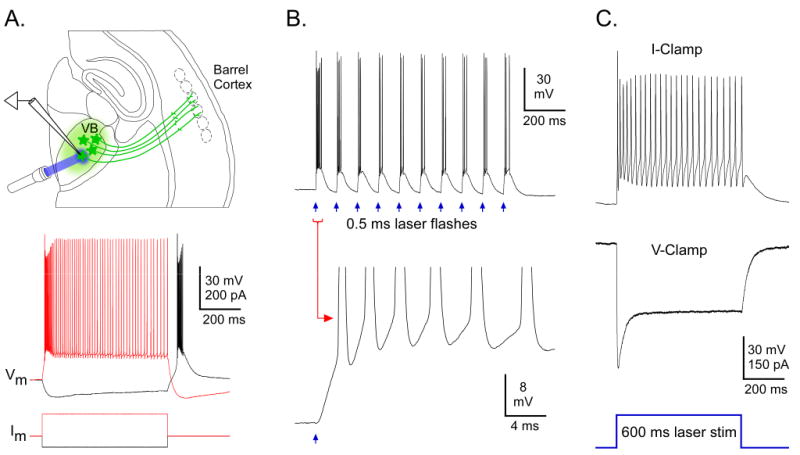
A(top): Illustration of experiment configuration, including positions of recording electrode and laser stimulus (blue beam). Virus injection was in VB, causing expression in VB cells and their axons (green). The recording and the laser stimuli were directed at a ChR2 expressing cell. A(bottom): Responses of a ChR2 expressing VB cell to intracellular current steps. B. Responses of same cell (as in A) to a train of 0.5 ms laser flashes (4 mW; blue arrows). Spike bursts were evoked on each flash. The 1st burst is shown at high magnification below. Depolarization began almost immediately at flash onset. C. Responses of a different ChR2-expressing VB cell to 600 ms laser stimulus (∼ 1 mW). The cell responded with spikes throughout the stimulus (in current clamp-upper trace). When in voltage-clamp, the inward current initially peaked, then decreased to a sustained level within ∼ 100 ms (middle trace). Laser duration indicated on bottom. Baseline/holding potentials (in mV): A = -78, B = -72, C = -74. The cell in C was recorded at ∼ 23 °C, whereas A-B (and all other examples throughout the paper) were ∼32 °C.
When cortical neurons were recorded in areas targeted by ChR2-expressing TC axons, synaptic responses could be evoked by local laser stimulation of those axons. We recorded from a variety of neurons in cortical layers 4 and 5/6, including regular-spiking (RS), fast-spiking (FS) and low threshold-spiking (LTS) cells. RS cells are glutamatergic excitatory neurons (mainly spiny stellate in layer 4 and pyramidal in other layers: Feldmeyer et al., 2005; McCormick et al., 1985). FS and LTS cells are GABAergic inhibitory interneurons (Beierlein et al., 2003; Gibson et al., 1999); LTS cells are sometimes called “regular spiking nonpyramidal” (Ma et al., 2006; Porter et al., 2001; Sun et al., 2006). Each cell type has characteristic morphology, protein expression, synaptic connectivity, short-term synaptic dynamics and intrinsic physiology (above and Gupta et al., 2000; Halabisky et al., 2006; Kawaguchi and Kubota, 1997; Reyes et al., 1998; Silberberg, 2008; Thomson and Lamy, 2007). Here the cell types were identified using established physiological criteria (Beierlein et al., 2003) and the presence of fluorescent protein in transgenic mice (below).
For most cortical cells located near ChR2-expressing TC arbors, brief laser flashes (0.05 to 2.0 ms) directly over the recorded cells produced clear EPSPs/EPSCs (Figures 3, 4, 5, 6). EPSPs ranged from less than 1 mV to over 25 mV (mean = 11.8 ± 1.0 mV, n = 92 cells). Response size was partly determined by cell type (below). In FS inhibitory cells, responses were often large enough to trigger spikes (Figures 3, 6, S3), similar to observations with electrical TC stimulation (Cruikshank et al., 2007; Porter et al., 2001). Robust responses were observed in layers 4 and 5/6 (Figures 3B, 6, S3, S5) and nearly all underwent short-term depression during 5-10 Hz trains (81/83 cells), as expected for TC synapses (Beierlein et al., 2003; Gabernet et al., 2005; Gil et al., 1997).
Figure 3. Laser stimulation of ChR2-expressing TC arbors in cortex evoked strong synaptic excitation in cortical neurons.
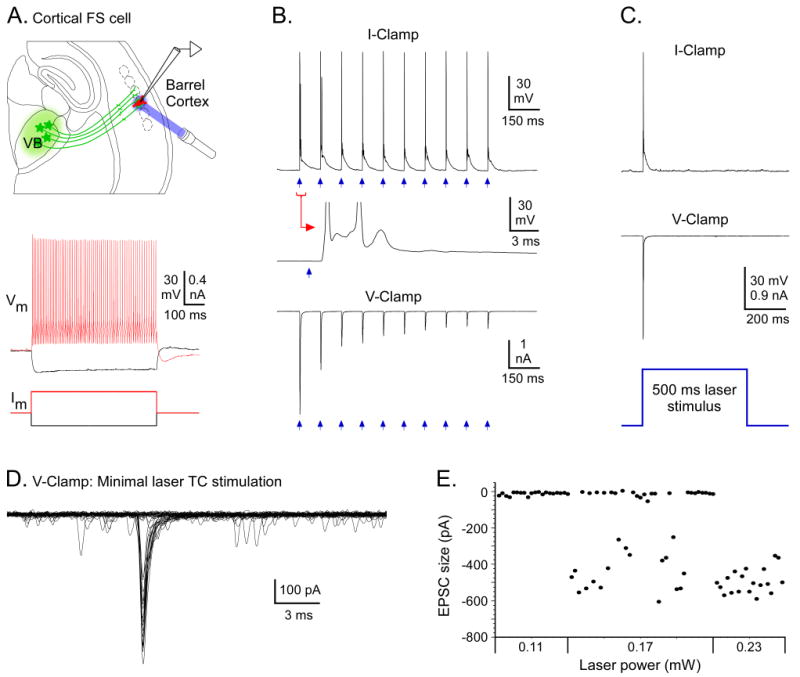
A(top): Experimental configuration for A-C: ChR2 expression in VB cells and their TC axons (green), but recording in a fast spiking (FS) cell in cortical layer 4 (red) that did not express ChR2. Laser stimuli (blue) directed at TC arbors surrounding the recorded cell. A(bottom): Responses of FS cell to intracellular current steps. B. TC synaptic responses to 10 Hz trains of laser flashes (blue arrows). B(top): Spikes were evoked by each flash (0.05 ms, 1.1 mW flashes). Expanded trace shows ∼ 1.5 ms synaptic delay. B(bottom): Same cell in V-clamp, near the reversal potential for inhibition; laser flashes evoked EPSCs that depressed across the train (0.05 ms, 0.23 mW). C. Responses to a 500 ms laser stimulus. Unlike direct responses in ChR2-expressing cells (Fig. 2C, S2A), synaptic responses in non-expressing cells were transient (even when laser durations were long). D. “Minimal” TC currents in V-Clamp from a layer 6 FS cell. Laser stimuli were adjusted to threshold (0.1 ms, 0.17 mW) to evoke synaptic currents on nearly half of trials and failures on remainder. 40 sweeps shown: 17 successes, 23 failures (peaks aligned to facilitate comparison of response shapes – see Fig. S4). E. Plot of response size as function of laser power. As power was adjusted from threshold to slightly higher values (0.23 mW), response probabilities increased but sizes remained fairly constant, similar to studies using electrical stimuli (Cruikshank et al., 2007; Gabernet et al., 2005; Inoue and Imoto, 2006). Suprathreshold responses of this cell are in Fig. S3. Baseline/holding potentials (in mV): A = -81, B(top) = -81, B(bottom) = -94, C = -79, D = -74.
Figure 4. ChR2-evoked TC synaptic responses required glutamatergic transmission and presynaptic action potentials under control conditions.
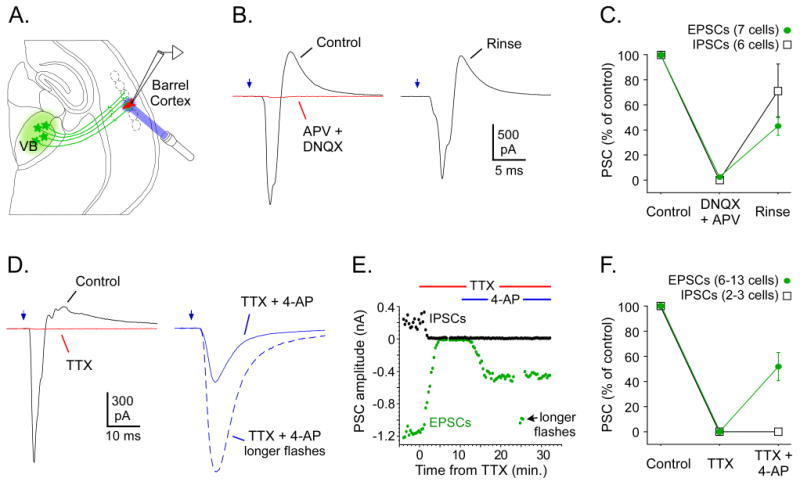
A. Experimental configuration: ChR2 expression in VB cells/TC axons (green), recording in non-expressing cortical cell (red), and laser stimuli (blue) directed at TC axons surrounding the recorded cell. B. Effects of glutamate receptor antagonists on TC responses of an FS cell (same cell as Fig. 3A-C, -64 mV Vhold). In control ACSF, laser stimulation of TC arbors (0.05 ms, 0.15 mW) evoked a monosynaptic inward EPSC followed by a disynaptic outward IPSC (black trace, left). Infusion of APV and DNQX (50 μM and 20 μM) for 6 min blocked > 97% of both types of PSCs (red trace). Responses partly recovered after a 35-40 min rinse in normal ACSF (right). C. Group effects of 50 μM APV plus 20 μM DNQX on laser-evoked TC responses. Infusion for 5-7 min blocked IPSCs completely and EPSCs nearly completely. Rinsing in normal ACSF for 25-45 min produced partial recovery. D. Effects of Na+ and K+ channel blockers TTX and 4-AP on TC responses of an RS cell (-64 mV Vhold). TTX (1 μM) blocked EPSCs and IPSCs completely (red trace, left). Subsequent addition of 4-AP (1 mM) partly rescued the EPSC, which then had a slower time course (solid trace, right). Tripling the flash duration to 1.5 ms increased the EPSC to control amplitude (dashed trace) but failed to restore the IPSC. E. Time course for experiment in D. Each dot represents a single response (green = EPSCs, black = IPSCs). Infusion times indicated above plot. Laser power in D-E was 20 mW, through a 4× objective. Flash durations were mostly 0.5 ms, but 3 responses are shown for “longer flashes” = 1.0 ms. F. Group effects of 1 μM TTX plus 1 mM 4-AP on laser-evoked TC responses. TTX for 5-12 min blocked responses completely (n = 13 cells for EPSCs, 3 cells for IPSCs). Addition of 4-AP for 6-8 min (during TTX) allowed for laser-evoked monosynaptic EPSCs (n = 6 cells) but not disynaptic IPSCs (2 cells). Traces and cell values in B-F are averages of ∼15 sweeps (= 5 min).
Figure 5. ChR2-evoked TC feedforward inhibition.
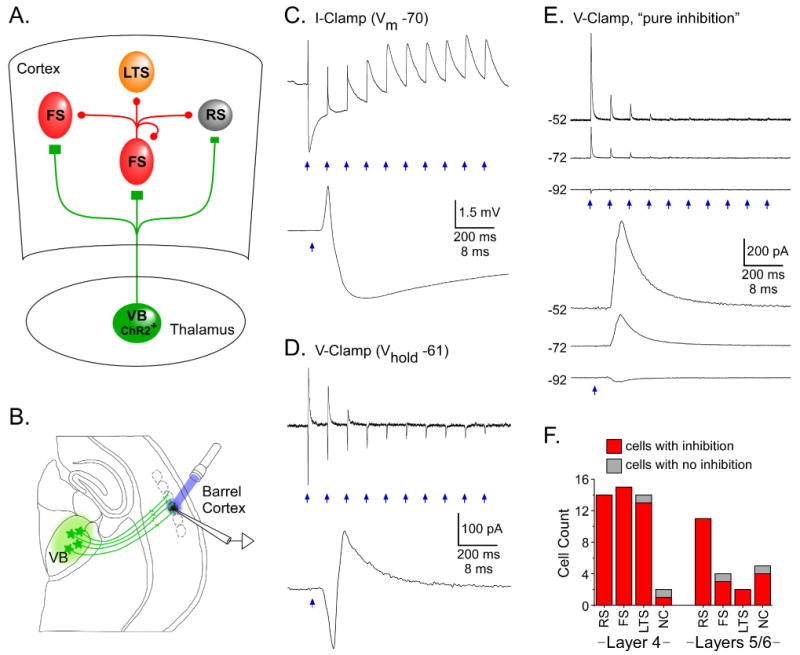
A. Cartoon of TC circuit mediating disynaptic feedforward inhibition. Excitation of ChR2-expressing TC arbors (green; projecting from VB) would evoke release of glutamate onto cortical RS and FS cells. Resulting excitation of FS cells (which are GABAergic) would lead to synaptic inhibition of neighboring neurons. All classes of neurons receive this feedforward inhibition, including FS cells. B. Experimental configuration: ChR2 expression in VB cells/TC axons (green), recording in non-expressing cortical cell (black), and laser stimuli (blue) directed at TC axons surrounding the recorded cell. C. Synaptic potentials of a layer 4 RS cell evoked by local laser flashes (0.1 ms, 4 mW). Initial stimuli in 10 Hz train evoked monosynaptic TC-EPSPs (upward deflections) followed by disynaptic IPSPs (downward deflections). By the 5th stimulus inhibition had depressed, leaving nearly pure EPSPs. Bottom panel shows 1st response in train at fast sweep speed (baseline Vm = -70 mV). D. Similar excitatory-inhibitory response sequences were recorded in voltage clamp: inward EPSCs preceded outward IPSCs (1st response expanded in bottom panel). In this neuron (a layer 4 RS cell) inhibition depressed to very low levels by 4th pulse in train (laser flashes = 0.1 ms, 0.34 mW; Vhold = -61 mV). E. In rare cases TC-induced disynaptic IPSCs occurred in the absence of EPSCs (2 RS, 1 FS and 2 LTS cells). E(top): Disynaptic IPSCs of a layer 5/6 RS cell triggered by laser stimulation of TC arbors (0.1 ms, 3.7 mW), recorded at 3 holding potentials. There were no excitatory inward currents at -52 and -72 mV. IPSCs depressed to very low levels after the 4th stimulus. E(bottom): 1st responses expanded. Reversal potential was ∼ -90 mV, similar to values obtained with paired-cell recordings under the same ionic conditions (Cruikshank et al., 2007). F. Tally of cells with TC/laser-evoked feedforward inhibition. Nearly all neurons of all tested types and layers expressed inhibition, but LTS/GIN cells had weaker inhibition than other types (Fig. S5B).
Figure 6. Comparison of ChR2-evoked TC responses across cell types and layers.
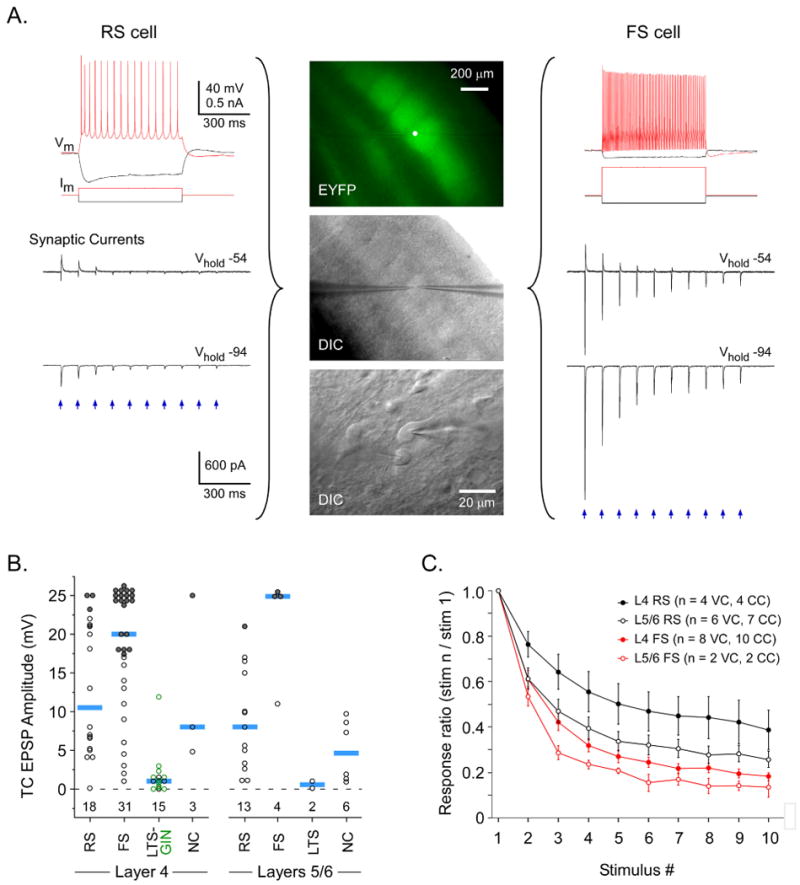
A. Simultaneous comparison of RS and FS cells in layer 4 of barrel cortex. Center panels illustrate location of cells. Top image (EYFP) is at low magnification. Note intense EYFP labeling of TC arbors in layer 4 barrels; white dot over brightest barrel is the location of the recorded cells and laser stimuli. Middle image (DIC) shows same patch of cortex in DIC mode. Bottom image shows recorded cells at high magnification. Left panels illustrate responses of the RS cell, including intrinsic responses (Vm) to intracellular current steps (Im), and synaptic currents evoked by laser stimulation of TC arbors. Synaptic currents in RS cell had moderate amplitudes (< 0.5 nA). They were entirely inward when Vhold was -94 mV (near inhibitory reversal; Fig. 5E), but included disynaptic outward components when Vhold was -54 mV. Right panels illustrate responses of a simultaneously recorded FS cell, arranged in the same order as RS cell. TC synaptic currents of the FS cell were much larger than those of the RS cell for matching holding potentials and laser stimuli (0.1 ms, 0.34 mW flashes). B. TC-EPSP amplitudes compared across cell types and layers. Each circle represents one cell and blue bars are group medians. RS excitatory neurons and FS and LTS inhibitory interneurons are described in main text. Within the LTS group, GFP-expressing cells from the GIN strain are indicated by green symbols and GFP-negative LTS cells are black. NC were non-classified cells that we were unable to assign to a category (Beierlein et al., 2003). Peak laser-evoked depolarizations were measured from ∼ -79 mV baseline potentials. When laser stimuli evoked spikes, EPSP sizes were estimated from spike threshold (filled symbols). For EPSP comparisons, cells were tested at the maximum laser intensity for our system (∼ 4.5 mW). For 57/67 cells, flash durations were 1.0 ms. For 1 LTS, 2 RS and 7 FS cells, durations were 0.1 ms. In general, laser-evoked TC responses were strongest in FS and weakest in LTS/GIN cells. Numbers below the zero line indicate group sample sizes. C. Dynamics of laser-evoked TC responses across 10 Hz trains were compared for FS and RS cells. Response amplitudes plotted as a function of stimulus # within trains (normalized to 1st responses). Only subthreshold responses were analyzed. Approximately half of cells were recorded in current clamp (CC) and the other half in voltage clamp (VC) (see symbol key). On average, layer 5/6 responses depressed more deeply than layer 4, and FS depressed more than RS.
Optically evoked TC responses all had synaptic delays (Figures 3-5, S1, S3), with onset latencies averaging 1.81 ± 0.11 ms. The latency range across cortical cells was 0.80 to 5.35 ms, which did not overlap with the < 0.2 ms latencies of thalamic cells exhibiting direct ChR2-mediated responses (Figure S1). This indicates that these cortical cells (including 12 pyramidal cells in layers 5/6) did not directly express ChR2 and were not infected retrogradely by thalamic lentivirus injections, consistent with the anatomy (Figure 1).
TC synaptic responses to sustained light stimuli (500-600 ms) were relatively transient, lasting less than 300 ms (Figure 3C; n = 5). The transient nature of the responses could result from desensitization of ChR2 in the axons, short-term depression of transmitter release, or sodium channel inactivation in the axons during sustained stimulation. In any case, the transient synaptic responses in cortex contrast sharply with the sustained responses of directly infected thalamic neurons (compare Figures 3C and 2C).
To further characterize the light-evoked responses in cortical neurons, we applied the glutamate receptor antagonists DNQX and APV (20 and 50 μM). These blocked laser-evoked excitatory responses in all 7 cortical cells tested, consistent with the responses being mediated by TC synaptic inputs, and not by direct ChR2 currents in the recorded cells (Figure 4A-C).
Considering that laser stimulation was applied directly over presynaptic terminals, we wondered if transmitter release was initiated by action potential-dependent processes (Katz and Miledi, 1967; Petreanu et al., 2009). To test this, we recorded from cortical cells with robust laser-evoked TC responses, then applied 1 μM TTX to block sodium channels. TTX completely abolished responses in 13/13 cells, indicating action potential-dependent release (Figure 4D-F). Consistent with this, minimal TC laser stimulation in the absence of drugs produced all-or-none responses with relatively constant sizes and shapes as stimulus intensities were raised from threshold to slightly higher levels in order to increase response probabilities (Figure 3D-E). Notably, minimal TC laser stimulation resulted in considerable EPSC latency jitter (Figure S4, discussed below). While synaptic responses evoked by laser stimulation of TC axons clearly required presynaptic action potentials under control conditions, responses could be evoked even during TTX perfusion if the potassium channel blocker 4-aminopyridine (4-AP; 1 mM) was simultaneously present (6/6 cells), consistent with recent studies (Petreanu et al., 2009). TC responses produced in TTX plus 4-AP were smaller and slower than those evoked in the absence of drugs (Figure 4D-F).
Feedforward inhibition evoked by optical activation of the TC pathway
Thalamic synapses onto cortical neurons are excitatory (Swadlow et al., 2005). However, TC input can drive spiking in cortical inhibitory interneurons (Figures 3B, S3; Cruikshank et al., 2007; Porter et al., 2001), and these interneurons synapse locally, producing powerful feedforward inhibition in surrounding cells (Figure 5A; Gabernet et al., 2005; Inoue and Imoto, 2006; Sun et al., 2006). We found that laser stimulation of ChR2-expressing TC arbors nearly always produced feedforward inhibition (inhibition was observed in 63/67 cortical cells tested; Figure 5). Just as with electrical TC stimulation, some of the largest inhibitory postsynaptic currents were recorded in FS interneurons (Figure 4, 6A), which are thought to be the presynaptic interneuron type responsible for most TC feedforward inhibition (Cruikshank et al., 2007; Daw et al., 2007; Gabernet et al., 2005; Sun et al., 2006; but see Tan et al., 2008).
Inhibition generally followed TC excitation after a brief delay (Figures 4, 5C-D). The mean latency from onset of excitation to onset of the inhibitory outward current was 2.38 ± 0.18 ms, when measured from a holding potential of -54 mV (reversal potentials for excitation and inhibition were ∼ 0 and -91 mV; Cruikshank et al., 2007). The mean raw latency from stimulus onset to outward current onset was 4.08 ± 0.16 ms. During repetitive stimulation at 10 Hz, inhibitory potentials/currents depressed strongly within 3-4 stimuli, leaving relatively pure excitatory responses for remaining stimuli in trains (Figure 5C-E, 6A).
Fast TC evoked inhibition was blocked by the glutamate receptor antagonists DNQX and APV (6/6 cells) and by TTX (3/3); the TTX-induced blockade of inhibition was not reversed with 4-AP (2/2)(Figure 4). These results are consistent with a feedforward inhibitory mechanism that depends on glutamatergic excitation of local interneurons by TC inputs (Figure 5A). One cell responded with a very slow hyperpolarization (onset ∼70 ms, peak ∼275 ms) that was not blocked by DNQX and APV, suggesting it did not depend on conventional TC synapses.
Optically evoked TC responses of different neuronal subtypes
A powerful feature of in vitro preparations is that they permit straightforward identification of postsynaptic cell types using morphological, genetic, and physiological criteria. We combined whole-cell recordings from multiple identified cells with ChR2 stimulation to compare TC responses among different cell classes. Figure 6A shows simultaneous laser-evoked TC responses from an FS inhibitory cell and a neighboring RS excitatory cell. TC responses were substantially stronger in the FS than the RS cell. This difference is consistent with the group data (Figure 6B). A second FS-RS pair (from layer 6) is shown in Figure S4. In that pair, single axon (“minimal”) TC inputs were much larger in the FS than the RS cell. These overall differences in FS versus RS response strengths are consistent with reports using electrical TC stimulation (Beierlein et al., 2003; Cruikshank et al., 2007; Daw et al., 2007; Gabernet et al., 2005; Gibson et al., 1999; Inoue and Imoto, 2006; Porter et al., 2001; Sun et al., 2006).
For most experiments here, cell type was determined by somadendritic morphology and intrinsic physiology (Beierlein et al., 2003; Cruikshank et al., 2007). Another approach is to use transgenic mice in which fluorescent proteins are expressed by specific neuronal subtypes (Ma et al., 2006; Oliva et al., 2000). We adopted this approach to target somatostatin (and EGFP) expressing inhibitory interneurons in the GIN mouse line (Oliva et al., 2000). GIN cells have intrinsic physiological properties of LTS interneurons (Beierlein et al., 2003; Fanselow et al., 2008; Halabisky et al., 2006; Ma et al., 2006). We found that the TC-EPSPs in GIN cells were much weaker than those of RS or FS cells, but similar to TC-EPSPs of LTS cells identified by physiological criteria alone (Figures 6B, S5) (Beierlein et al., 2003). Interestingly, in simultaneous recordings from adjacent GIN-RS or GIN-FS cell pairs, not only were the excitatory TC responses of GIN cells weakest within the pairs, but feedforward inhibition was also weakest in GIN cells (Figure S5B).
Strong short-term depression is a known feature of TC synapses and nearly all of the laser-evoked TC responses exhibited depression during 5-10 Hz trains (81/83 cells, including all responsive LTS/GIN cells). Figure 6C compares the depression in FS and RS cells. General depression patterns were similar across cell types and layers but absolute levels differed. Depression was stronger in layers 5/6 than layer 4. Within layer 4, depression was stronger for FS than RS cells, as seen previously (Beierlein et al., 2003; Gabernet et al., 2005). A similar difference between FS and RS cells was observed in layers 5/6, contrasting with a previous report (Beierlein and Connors, 2002).
In four mice we injected virus into the lateral geniculate nucleus and obtained strong ChR2/EYFP expression in TC projections to visual cortex (Figure S6). Laser stimulation in visual cortex evoked robust TC synaptic excitation in 5/5 FS cells, 3/3 RS cells and 1/1 unclassified cell. Interestingly, the 2 LTS cells recorded in visual cortex had the weakest responses of all cell types tested there (Figure S6D), consistent with somatosensory cortex.
Overall, the anatomical, pharmacological, and physiological data indicate that optical stimulation via ChR2 can generate robust and selective stimulation of TC afferents. Thus it permits analysis of cortical processes engaged by TC input (e.g., feedforward inhibition) without the contaminating activation of CT axons that can occur with electrical stimulation.
Selective ChR2-mediated optical stimulation of the CT pathway
We next applied optical stimulation to the corticothalamic (CT) pathway. We injected ChR2/EYFP lentivirus into somatosensory cortex, aiming for layers 5/6. When injections were successfully targeted, EYFP labeling was found throughout deep and middle cortical layers near the injection site, and in axons of the CT tract. Importantly, brightly labeled clusters of CT arbors were observed in the VB thalamus and TRN (Figure 7, n = 23 brains).
Figure 7. Lentivirus injections into barrel cortex produced ChR2/EYFP expression in cortical neurons, including CT projection cells and their axons within thalamus.
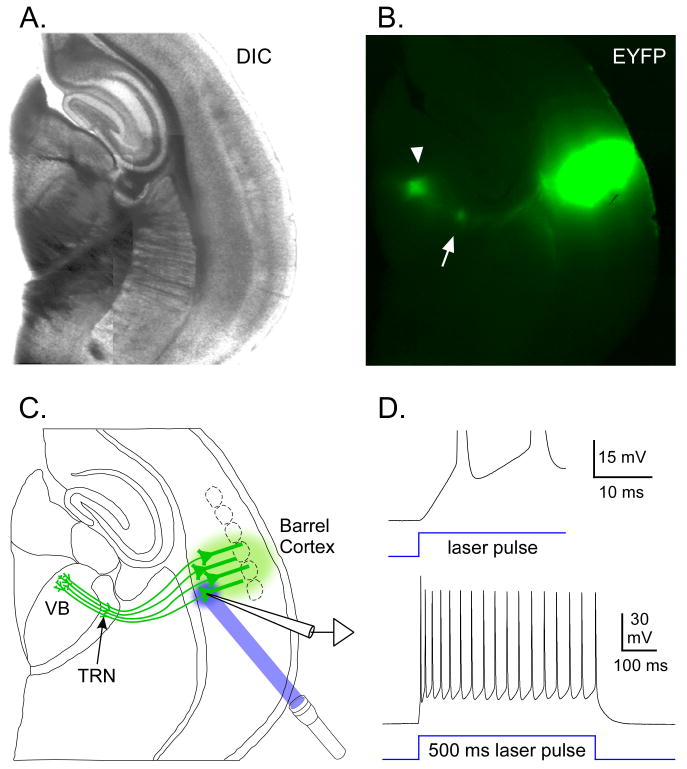
A. DIC image from a live 300 μm thick slice on P19, cut in thalamocortical plane. Barrel cortex was injected at P12 with 0.75 μl of virus, centered on layer 5. B. EYFP fluorescence image of same slice (indicating location of ChR2/EYFP). There was intense EYFP labeling across cortical layers. CT axons and terminal arbors were labeled in the CT pathway, the VB (arrowhead), and the TRN (arrow). C. Drawing illustrates anatomical features in A-B and experimental configuration for D. ChR2 expression in cortical neurons, including infragranular pyramidal cells and their CT projections to TRN and VB (all green). Recording from a ChR2-expressing layer 6 pyramidal cell near the injection site. Laser stimuli directed at recorded cell. D. Laser-evoked responses of this cortical cell were examined after a 90 min blockade of fast synaptic transmission (20 μM DNQX, 50 μM APV, 50 μM picrotoxin). Depolarization began almost immediately upon laser onset (top trace) and spiking was sustained throughout the 500 ms stimulus (lower trace), consistent with direct (non-synaptic) ChR2-mediated currents. Laser stimuli = 0.08 mW. Baseline Vm = -80 mV.
Laser stimulation of ChR2-expressing cortical cells in layers 5/6 evoked direct depolarizations with short onset latencies (mean = 0.13 ± 0.02 ms; range = 0.05 to 0.20 ms, n = 8; Figures 7C-D, S1). Direct responses were maintained during glutamate receptor blockade (20 μM DNQX + 50 μM APV; 4/4 cells). Long laser pulses evoked sustained responses in ChR2-expressing cortical cells (6/6 cells; Figure 7D). Figure S2 illustrates response dynamics in these cells.
When thalamic neurons were recorded among clusters of fluorescent CT arbors, synaptic responses could be evoked by laser stimulation of those arbors (Figures 8-9). When slices were fresh (within ∼ 5 hours of slicing), both VB and TRN cells responded with robust EPSCs that generally facilitated (Figure 8). All of these responses had clear synaptic delays (onset latencies ≥ 1.3 ms, n = 49 cells; Figure S1), suggesting that thalamic cells did not undergo retrograde infection or ChR2 expression following lentivirus injections into cortex. Consistent with this, CT synaptic responses were blocked by DNQX and APV (n = 5) and TTX (n = 9)(Figure S7). Combined application of TTX plus 4-AP permitted CT responses that were actually larger than those in control ACSF (n = 3 cells; Figure S7F-G), contrasting with the response reductions in the TC pathway (Figure 4). Short-term dynamics of CT responses changed from facilitation in control ACSF to depression with TTX plus 4-AP.
Figure 8. Laser stimulation of ChR2-expressing CT arbors evoked facilitating synaptic excitation in thalamic cells.
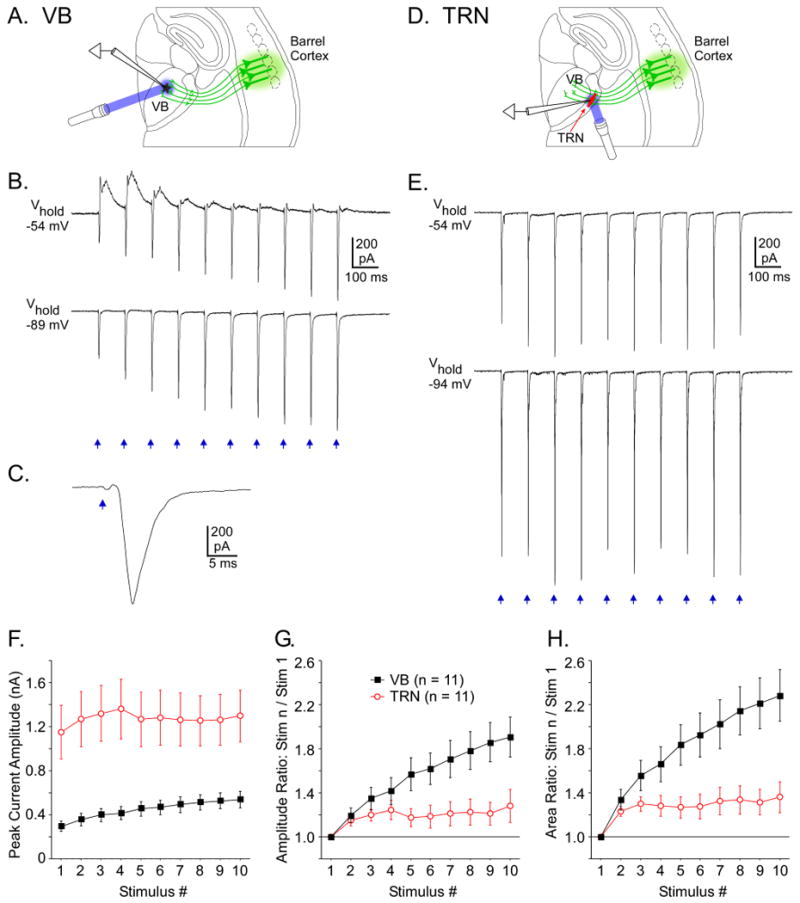
A. Configuration for experiment in B-C: ChR2 expression in layer 6 pyramidal cells and their CT projections to VB thalamus (green), recording in a non-expressing VB cell, and laser stimuli directed at CT arbors surrounding the recorded cell. B. CT synaptic currents were evoked in the VB cell by local laser flashes. When Vm was held near the inhibitory reversal potential (-89 mV), facilitating EPSCs were evoked by the 10 Hz CT stimulus train. EPSCs more than doubled from the 1st to 10th stimuli. When Vm was held positive to the inhibitory reversal (-54 mV), responses to initial flashes in the train included monosynaptic EPSCs (inward currents) followed by fast IPSCs (outward currents). By the 4th stimulus, inhibition had depressed, leaving mainly EPSCs. C. The 10th response in the train at fast sweep speed (Vhold = -89 mV). D. Configuration for experiment in E: similar to A-C, except recording in TRN. E. Traces illustrate the typically larger and less facilitating CT synaptic currents in TRN (compared with VB). Also, responses have no IPSCs (outward currents). Laser flashes were 1 ms, 4.5 mW for A-E. F. Group means of CT-EPSCs (inward currents) evoked in TRN and VB cells during 10 Hz trains (Vhold = -89 to -94 mV). EPSCs in TRN were ∼ 3× larger than in VB (p < 0.01). G. Short-term dynamics of CT-EPSCs across 10 Hz trains (normalized to 1st response in train). H. Same as G except current areas were measured instead of amplitudes. Facilitation was significantly greater in VB than TRN from the 5th stimulus onward (for both measures; p < 0.05). All data in this figure came from slices in the standard thalamocortical plane.
Figure 9. ChR2-mediated CT stimulation resulted in clear inhibition in VB but not in TRN.
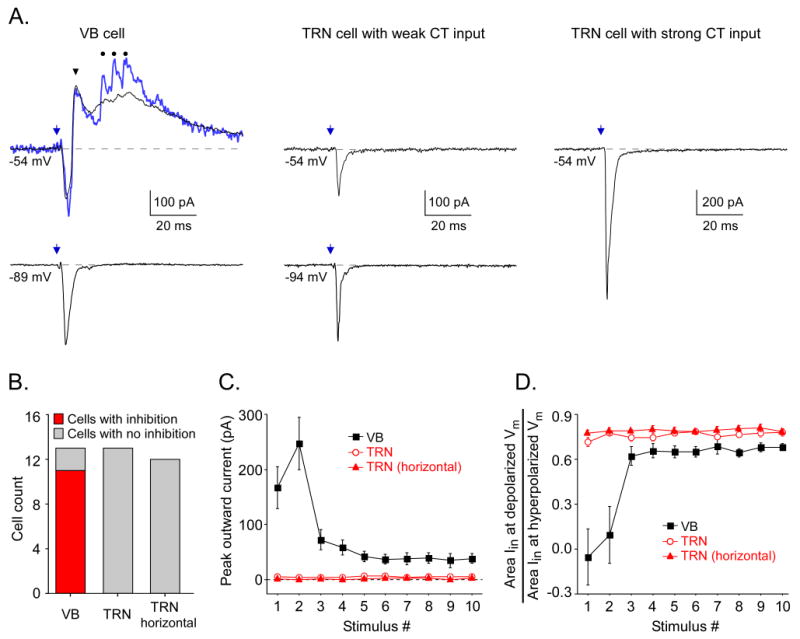
A. Laser-evoked CT synaptic currents from 1 VB and 2 TRN cells. Responses to first stimuli in 10 Hz trains shown. Outward currents (from -54 mV) were evoked in the VB cell but not the TRN cells, whether CT responses were weak (center) or strong (right). Black traces are averages of 10-20 sweeps. Blue trace from VB cell is a single sweep. For VB cells recorded at depolarized potentials, most sweeps had a short latency outward peak that was consistent from trial to trial (arrowhead). There were also often later bursts of sharp outward currents (dots over blue trace), likely due to spike bursts in presynaptic TRN cells (Figs. S9-S10). These were variable from trial to trial, resulting in a smooth average. B. Group tally indicating that laser CT stimulation elicited outward inhibitory currents in VB but not in TRN. VB cells were all recorded from slices sectioned in standard thalamocortical plane. TRN cells were recorded from slices in either the thalamocortical plane (“TRN”) or horizontal plane (“TRN horizontal”). Only thalamic cells receiving robust CT drive (EPSPs ≥ 5 mV) were included. Of these, 11/13 in VB and 0/25 in TRN expressed inhibition. No TRN cells with weak or no CT excitation exhibited inhibition either. Slice plane had no detectable effect. C. Inhibitory outward currents in VB cells were largest for first two laser stimuli in trains; outward currents in TRN cells were essentially nonexistent. Values are means ± SE of the peak outward currents measured at -54 to -59 mV holding potentials during the 50 ms period following laser stimuli (n = 11 VB cells, 13 TRN cells from thalamocortical plane, 12 TRN cells from horizontal plane). The small positive values for TRN are consistent with the noise. D. Strong inhibition evoked by first 2 laser pulses reduced net inward currents at depolarized holding potentials for VB but not TRN. For each cell, areas of inward synaptic currents during the initial 10 ms of responses were measured for two holding potentials (-94 mV, near the reversal for inhibition, and -54 to -59 mV) and the ratio of those areas calculated. Mean ± SE of those ratios is plotted for each stimulus in the train (n = 11 cells for each group).
VB and TRN neurons responded differently to CT stimulation
Although light-evoked CT responses were generally strong and facilitating, responses in VB cells differed from those in TRN in three ways. First, excitatory CT currents were significantly larger in TRN than VB (∼ 3-fold larger, p < 0.01, Figure 8F). For this comparison laser stimuli were kept at a constant intensity (4.5 mW) and diameter (10 μm). Stimulus durations were 1.0 ms for all VB cells (11/11) and most TRN cells (8/11); durations were reduced for 3 TRN cells to avoid escape spikes (0.05, 0.1 and 0.1 ms). Thus overall CT drive appeared to be stronger for TRN than for VB cells.
Second, while CT responses of most thalamic cells facilitated during 10 Hz trains (9/11 in VB, 8/11 in TRN), facilitation was stronger in VB than TRN. VB responses approximately doubled across 10 pulse trains, while TRN responses rose only about 30% (Figure 8G-H). Short-term plasticity ratios (response n/response 1) were significantly larger for VB than TRN (p < 0.05, Figure 8G-H). In 5 thalamic cells we compared CT responses evoked by laser stimulation to those triggered by electrical stimulation of the internal capsule. Short-term facilitation was stronger with the electrical stimulation (Figure S8).
The third and most dramatic difference between the CT responses of VB and TRN cells was the existence of clear feedforward inhibition in VB and its absence in TRN. Laser CT stimulation elicited outward currents or hyperpolarizing potentials in 11 of 13 VB cells, but no such responses in the 25 TRN cells tested (Figures 8B, 8E, 9).
Inhibition in VB was consistent with a disynaptic feedforward mechanism in which laser-stimulation of CT axons leads to excitation of TRN cells which, in turn, release GABA onto VB cells (Figure S9A, C). The TRN is the main source of VB inhibition (Huguenard and McCormick, 2007; Jones, 2009) and TRN cells consistently responded with spikes to the type of CT stimuli that evoked inhibition in VB. TRN cell activation was sufficiently rapid (< 5 ms latency to first spike; Figure S9) to account for the IPSCs in VB (outward current latencies = 6.87 ± 0.37 ms; Vhold = -54 to -59 mV). Both TRN spiking and VB inhibition were generally strongest for the first two stimuli in 10 Hz trains (Figures S9F-H, 8B, 9C-D), consistent with a direct relationship. Inhibitory responses in VB were blocked by DNQX plus APV (3/3 cells) and TTX (1/1 cells; Figure S7), again consistent with a disynaptic mechanism.
The lack of inhibition in TRN is somewhat surprising. It did not appear to be caused by weak CT drive of TRN cells (which are thought to be their own main source of inhibition; Huguenard and McCormick, 2007; Jones, 2009). For example, CT-evoked EPSCs were larger in TRN than VB (Figure 8F) and TRN cells often fired strongly in response to laser stimulation (14/33 cells). The absence of inhibitory responses in TRN was also not a function of stimulus location along the CT pathway. The likelihood of CT-evoked firing in TRN cells was similar for laser stimuli directed at the VB and the TRN itself (Figure S10A-B). Furthermore, no inhibitory responses were recorded in TRN cells whether laser stimuli were delivered to the TRN (n=13, above), the VB (n=3) or further upstream along the CT path (n=4). In contrast each stimulus location produced clear inhibition in VB cells (VB stim, n=11; TRN stim, n=2; upstream stim, n=3; Figure S10C-D). Finally, slice plane had no apparent effect on incidence of feedforward inhibition in TRN cells (Deleuze and Huguenard, 2006). No CT-evoked inhibition was observed in 13 TRN cells from slices cut in the somatosensory thalamocortical plane or in 12 TRN cells from slices in the horizontal plane (Figure 9B-D).
Discussion
Our results demonstrate the efficacy of the ChR2 optical technique for selectively stimulating axonal pathways in thalamocortical systems. Lentivirus delivery of ChR2 yielded strong expression in local neurons near injection sites, and in their extended axons, but did not lead to retrograde infection or expression. We used this technique to analyze the specific neuronal circuits engaged by TC and CT projections, including feedforward inhibitory circuits. We observed pathway-specific and cell type-specific differences in processing mechanisms.
Selective axonal and synaptic activation with ChR2
Most studies using ChR2 in neural systems have targeted light stimuli to somata of ChR2-expressing cells rather than to their axons or terminals. In fact, some initial studies using transgenic mice that expressed ChR2 in pyramidal cells argued that axons of these cells were insensitive to light stimulation, providing advantages for certain experiments (Wang et al., 2007). However, a recent study using the same mouse lines presented evidence that axon stimulation was possible (Gradinaru et al., 2009). A seminal study by Petreanu et al. (2007) clearly demonstrated that ChR2-expressing axons could be excited by light, even when isolated from parent somata. Axon excitation was sufficient to evoke transmitter release onto postsynaptic cells, producing EPSCs. This method was applied to determine the neuronal targets of corpus callosal projections. Recently Petreanu et al. (2009) extended the strategy to map inputs from a variety of sources onto layer 3 and 5 pyramidal cells. Interestingly, neurotransmitter release could be triggered by ChR2 stimulation in terminals even when action potentials were blocked with TTX (as long as potassium channels were also blocked), permitting mapping of synapse locations within dendritic trees.
A critical feature of our study was the selective “anterograde expression”; this likely occurred because of characteristics of the lentivirus used, including the VSVg pseudotyping (Wong et al., 2004). A variety of other molecular biological tools can also be used to achieve selective expression. In the context of axonal stimulation, Atasoy et al. (2008) recently used a Cre-dependent virus to target ChR2 to specific neuron types in hypothalamus. They were then able to excite axons of those specific cells with light (despite being surrounded by other axons/cells) and map the neurons receiving input from the infected cells.
In the axonal stimulation studies of Petreanu, Atasoy and colleagues, emphasis was on monosynaptic connections, and relatively modest subthreshold responses were evoked in postsynaptic cells (postsynaptic spikes were not typically evoked). This application is clearly useful for determining anatomical connections. However, it was not clear from these reports if the method was robust enough to initiate the types of di/polysynaptic activity often studied with electrical stimulation of major afferent tracts (Cruikshank et al., 2007; Gabernet et al., 2005; Metherate and Cruikshank, 1999; Porter et al., 2001; Sun et al., 2006). Our results largely resolve this, indicating that ChR2 stimulation can be used as a replacement for electrical stimulation in functional studies of TC and CT systems. Synaptic excitation in TC-CT pathways was strong enough to evoke spikes in postsynaptic targets, initiating disynaptic processing. Thus we could compare feedforward inhibition among different cell types and pathways, finding (for example) robust inhibition in VB but not TRN. Recently a similar approach was applied to study serotonin-containing projections to hippocampus (Varga et al., 2009), and it seems likely that the ChR2-axon stimulation method will be broadly useful.
In most of our experiments, laser stimulation was applied directly over the ChR2-expressing terminals, so we wondered if transmitter release was triggered by action potential independent mechanisms (e.g., direct depolarization of terminals via ChR2)(Katz and Miledi, 1967). We found that TTX completely blocked synaptic responses, ruling out this possibility. Nevertheless, ChR2 is calcium permeable (Nagel et al., 2003), so some calcium influx through ChR2 likely occurs, potentially modulating transmitter release and synaptic dynamics (Neher and Sakaba, 2008). This will remain a concern unless mutations are made to ChR2 (Berndt et al., 2009; Lin et al., 2009) to reduce calcium permeability.
Consistent with our findings, Petreanu et al. (2009) recently reported that TTX blocks ChR2-triggered synaptic release when tested under otherwise normal conditions. They went on to show that release could be rescued if potassium channels were blocked with 4-AP in conjunction with TTX. We confirmed this in our TC-CT studies. As expected, only excitatory responses occurred in the presence of TTX and 4-AP; disynaptic inhibition was absent. TTX plus 4-AP caused distortions of excitatory responses that differed in the CT and TC pathways: CT response amplitudes increased whereas TC decreased. Moreover, CT response dynamics converted from facilitating to depressing whereas TC dynamics simply became more depressing. Response latencies and durations in both pathways slowed. Obviously caution should be used when evaluating synaptic properties during perfusion of TTX and 4-AP.
A related issue is the precise location of spike initiation when stimulating over presynaptic arbors in control conditions. Are spikes initiated in presynaptic boutons or upstream along axons? Preliminary evidence, based on covariance of “minimal” EPSC latency jitter in paired cell recordings, supports an axonal locus (described in Figure S4).
To our surprise, TC response latencies at threshold laser intensities jittered more than those reported previously using minimal electrical stimulation (compare Figure S4 to: Beierlein et al., 2003; Cruikshank et al., 2007; Inoue and Imoto, 2006). The discrepancy may relate to the durations of currents produced by ChR2 versus electrical stimulation. ChR2 continues to conduct for several ms after removal of light (Figure S2)(Ishizuka et al., 2006; Lin et al., 2009; Nagel et al., 2003), whereas electrical stimulus currents end immediately at their offset. Thus, with typical 0.2 ms pulses, laser stimuli would continue to charge axons for at least 10-fold longer than electrical stimuli, and could keep axonal voltages within threshold ranges longer. Engineered variants of channelrhodopsin with faster closing kinetics could help reduce jitter (Berndt et al., 2009; Lin et al., 2009).
The experimental potential for ChR2-mediated axonal stimulation is vast. A key advantage over electrical stimulation is the ability to activate known populations of axons even when severed from parent cell bodies. This was obvious in our TC studies involving slices of rostral barrel cortex. These slices contained distal ends of ChR2-expressing TC axons, severed from their somata during slicing. Despite being severed, TC arbors could be optically excited, evoking transmitter release and synaptic responses in cortex. Similar observations were made with visual TC projections and CT projections in horizontal slices. It seems likely that the method could be applied to other systems for which connections are difficult to retain within slices.
TC circuitry
Laser stimulation of ChR2-expressing TC axons locally in cortex evoked strong synaptic responses in cortical cells that were consistent with most previous TC studies using electrical stimulation (Agmon and Connors, 1991; Beierlein et al., 2003; Cruikshank et al., 2007; Gabernet et al., 2005). Responses had synaptic delays and were blocked by glutamate receptor antagonists. FS inhibitory interneurons had the strongest TC responses of all cell types, and their synaptic activation resulted in robust feedforward inhibition in both excitatory and inhibitory neurons, including in FS cells themselves (Figures 4, 5, 6A).
A different group of inhibitory interneurons, the somatostatin containing fluorescent cells in GIN mice (Ma et al., 2006; Oliva et al., 2000), responded much less strongly to TC input than either FS or RS cells. GIN cells had LTS-type intrinsic physiology (Fanselow et al., 2008; Halabisky et al., 2006), and their weak TC responses were consistent with physiologically similar interneurons from normal mice (Figure 6B) and rats (Beierlein et al., 2003). GIN cells also had much weaker feedforward inhibitory responses than neighboring RS or FS cells (Figure S5B). This suggests that, unlike FS interneurons, LTS/GIN cells would be relatively unaffected by sensory input relayed through thalamus, being neither strongly excited nor inhibited by such input.
The thalamic lentivirus injections, while large, were generally centered around the ventral posterior medial (VPM) nucleus, and the dominant TC projections were focused on layer 4 barrels (although other thalamic divisions and their TC projections were also often labeled). In future studies it would be interesting to make smaller injections to infect specific VPM subdivisions and/or the posterior nucleus to examine synaptic properties and target cell preferences from different lemniscal and paralemniscal thalamic neurons (Furuta et al., 2009).
A key feature of most TC responses is strong short-term depression, and this was observed using ChR2-mediated TC stimulation. For FS cells (but not RS) depression appeared to be slightly stronger than previous observations using electrical stimulation (Figure 6 vs. Beierlein et al., 2003 and Gabernet et al., 2005). The kinetic properties of ChR2 might be predicted to augment short-term depression. ChR2(H134R), which was the variant used here, desensitizes following light stimulation and requires about 20 sec to recover (Ishizuka et al., 2006; Lin et al., 2009). Our observations in directly infected cells are consistent with this and further show that the train patterns used for synaptic stimulation result in reduced ChR2 currents within those trains (Figure S2). Such reductions in presynaptic TC terminals might lead to failure of transmitter release on late stimuli of trains. If so, this would increase depression measured postsynaptically beyond the normal effects of the synapse itself. This problem may be resolved with modifications of ChR2 that reduce desensitization (Lin et al., 2009).
CT circuity
It has been known for decades that CT projections outnumber TC projections and that CT synapses provide major input to thalamic neurons (Deschenes et al., 1998; Jones, 2009). In the somatosensory system, CT input can significantly modulate sensory responses of thalamic relay cells and the sign of that modulation (enhancement/suppression) depends on the topographic relationship between CT and relay neurons, suggesting complex interactions between CT projections and cells of the TRN and relay nuclei (Temereanca and Simons, 2004). Our understanding of cellular mechanisms and microciruitry of CT systems remains meager, however. One reason is that CT projections tend to intertwine with TC projections making isolation of CT responses difficult. This could cause particular confusion in studies of the TRN, which receives strong input from both CT and TC pathways. Some experimenters have utilized differences in conduction velocity (CT axons are generally thinner and slower than TC axons; Beierlein and Connors, 2002; Jones and Powell, 1969) to distinguish components of mixed responses, cooling preparations to enhance differences (Golshani et al., 2001; Zhang and Jones, 2004). However, this method has several ambiguities. Improved specificity has been achieved by stimulating with glutamate rather than electrically, but this sacrifices temporal control (Gentet and Ulrich, 2004; Lam and Sherman, 2009). Here we were able to use ChR2 to selectively activate CT inputs to VB and TRN with temporal precision. As with our TC experiments, there was no apparent retrograde expression of ChR2. CT responses were entirely synaptic and blocked by glutamate receptor antagonists and TTX. We observed three major differences between CT responses of VB and TRN cells:
Larger CT-evoked EPSCs in TRN than VB
CT responses evoked by high intensity laser stimuli were 3-4 times stronger in TRN than VB. The differential strengths are comparable with previous reports on unitary (single-axon) CT inputs (Golshani et al., 2001; Landisman and Connors, 2007). This suggests that cell-type differences in the large synaptic currents in our study could be accounted for by differences in unitary strengths. Regardless, the strong synaptic drive on inhibitory TRN cells suggests an important role for thalamic inhibition in CT function.
CT responses were strongest within 5 hours of dissection, then declined to complete absence by 7 hours. This decay occurred before strong decreases in cell viability, suggesting a time-dependent decrease in ChR2 function. However ChR2-mediated TC responses were present more than 9 hours post-dissection. We observed synaptic responses to electrical stimulation of the internal capsule 7.5 hours after slicing, suggesting that CT synapses were functional at that time. Therefore we cannot explain the decay. In any case, the differences between VB and TRN response amplitudes were not accounted for by this issue; TC and VB recordings were made at well matched times, and amplitude differences remained even when cells were selected to bias the VB group toward fresher recordings.
Stronger short-term facilitation in VB than TRN
Short-term facilitation of CT-evoked EPSCs was typically stronger in VB than TRN. While the two groups had similar facilitation for 2nd stimuli in trains, VB responses continued to increase for subsequent stimuli whereas TRN responses tended to plateau. These patterns are reminiscent of findings by Alexander et al. (2006) studying electrically evoked CT input to visual thalamus, suggesting a general feature of CT processing. Analogous to the TC effects, it seems likely that desensitization of presynaptic ChR2 currents blunted the degree of CT facilitation; estimates of facilitation with electrical stimulation tend to be larger than we observed with optical methods (Figure S8; Alexander et al., 2006; Golshani et al., 2001; Landisman and Connors, 2007; Reichova and Sherman, 2004). Nevertheless, the facilitation patterns in the CT pathway suggest that thalamic relay cells may be most excited during repeated spiking in cortical layer 6, perhaps during repetitive sensory sampling.
Activation of the CT pathway triggered inhibition in VB cells but not TRN cells
The most surprising and perhaps important difference between TRN and VB responses was in their degree of inhibition—CT activation produced strong inhibition in VB but not in TRN cells. The inhibition in VB was predictable from previous anatomy and physiology (Huguenard and McCormick, 2007; Jones, 2009; Lam and Sherman, 2009; Landisman and Connors, 2007). The shortest latency inhibition was likely due to a feedforward circuit in which inhibitory TRN cells were excited by CT synapses. Inhibitory responses were most prominent on initial stimuli in trains, but depressed within 3 or 4 stimuli (Cox et al., 1997). This pattern would further heighten the contrast in net driving of relay cells between the beginning and end of a repetitive CT volley.
The lack of CT-evoked inhibition in TRN cells is surprising and intriguing. Zhang and Jones, (2004) observed GABAergic activity in TRN cells following electrical stimulation of cortex, and termed it “corticothalamic inhibition”. Their GABAergic currents generally had long latencies (often tens of ms), long durations (hundreds of ms), were multipeaked, and mixed with excitatory currents. Although the stimulating electrode was in cortex, it is unclear if the input triggering the inhibition was carried by CT axons or by antidromically activated TC axons. Differences between our study and that of Zhang and Jones also include animal age, ionic conditions, and temperature; all would tend to increase TRN excitability under the Zhang and Jones conditions. This in turn could result in inta-TRN inhibition upon electrical stimulation of cortex, assuming TRN cells are sufficiently interconnected.
Considerable evidence supports the existence and importance of GABAergic connections between TRN cells (Huguenard and McCormick, 2007; Jones, 2009). Given this, and the observed excitation of TRN cells by our CT stimuli (Figure S10), one might have expected at least some CT-evoked inhibition in TRN cells. Deleuze and Huguenard (2006) found that inhibitory connections between TRN cells are more prominent in horizontal than coronal slices. Our standard slices were cut in a “thalamocortical plane”, which is nearer coronal than horizontal (Agmon and Connors, 1991), potentially reducing feedforward inhibition mediated by TRN cells. However, we observed no additional CT-evoked inhibition in TRN cells from horizontal slices. Another factor that could differentially influence inhibition in TRN and VB would be differential strengths of inhibitory connections to cells in the two nuclei (originating from TRN). Using dual whole cell recordings, we have found that inhibitory connections between adjacent TRN cells are weak and very rare (2.8% of tested connections; Parker et al., 2009). In contrast, Cox et al. (1997) found that inhibitory connections between TRN and VB cells are less rare (∼ 8% of tested pairs), despite greater anatomical separation of the cells. Furthermore, the majority of TRN to VB connections had large synaptic conductances and no transmission failures. Finally, Lam et al. (2006) directly compared the inhibition in TRN and VB cells produced by excitation of TRN with glutamate. They found that TRN inhibitory responses were much weaker and required stronger stimuli than those in the VB.
Altogether, it seems reasonable that CT stimulation produced stronger inhibition in VB than in TRN simply because of more robust connectivity between TRN and VB cells than between TRN and other TRN cells. It remains possible that some CT feedforward inhibition might be detected in TRN by taking more aggressive actions to isolate it, such as intracellular blockade of potassium, sodium and calcium channels, and increasing driving force on chloride, as is often done to study GABA currents in TRN. However, such procedures were not necessary to observe strong CT evoked inhibition in VB. This difference suggests, at the very least, a more prominent role for CT inhibition in VB than TRN. It also implies that feedforward inhibition has functionally distinct effects in the CT system, where there is little feedforward inhibition onto inhibitory cells, and the TC system, where feedforward inhibitory conductances are strongest in the GABAergic cells that generate them (Cruikshank et al., 2007).
Methods
Procedures were approved by the Brown University IACUC. Lentiviruses carrying fusion genes for ChR2 and fluorescent proteins were injected into thalamus or cortex of ICR or GIN (Oliva et al., 2000) mice in vivo, between postnatal days 8 and 15. For TC experiments the ventrobasal thalamic complex (VB) was targeted for lentivirus injections. For CT experiments the barrel cortex was the target. Typical coordinates from Bregma (in mm) for VB were: lateral = 2.10, posterior = -1.10, depth = 3.10. For barrel cortex: lateral = 3.40, posterior = -0.80, depth = 1.00. Viral DNA was generously provided by Karl Deisseroth (Stanford University): pLenti-Synapsin-hChR2(H134R)-EYFP-WPRE, which had an enhanced ChR2-EYFP fusion gene, driven by a synapsin1 promoter (optogenetics.org). Following amplification using GigaPrep (Qiagen), VSV-G pseudotyped lentivirus was produced at the University of Pennsylvania Vector Core. Typical viral titers were ∼1010 IU/ml. Injection volumes were between 0.3 and 2 μl.
After allowing 1-3 weeks for ChR2 expression, acute somatosensory thalamocortical or horizontal brain slices were made for in vitro recording and stimulation (300 μm thick, thalamocortical slices had 35° tilt from coronal; Agmon and Connors, 1991; Cruikshank et al., 2007). Experiments were mainly conducted at 32 °C in a submersion recording chamber (a few were at room temperature – specified in Results). Slices were bathed in artificial cerebrospinal fluid (ACSF) containing 126 mM NaCl, 3 mM KCl, 1.25 mM NaH2PO4, 2 mM MgSO4, 26 mM NaHCO3, 10 mM dextrose and 2 mM CaCl2, saturated with 95% O2/5% CO2. Whole-cell recording pipettes contained 130 mM K-gluconate, 4 mM KCl, 2 mM NaCl, 10 mM HEPES, 0.2 mM EGTA, 4 mM ATP-Mg, 0.3 mM GTP-Tris, 14 mM phosphocreatine-Tris (pH 7.25, ∼290 mOsm). Cells were visualized with IR-DIC and fluorescence microscopy. Initial cell targeting was by anatomical position, soma size/shape, the presence of GFP in GIN mice, or EYFP in ChR2 expressing cells. After achieving whole-cell configuration, neurons were identified by intrinsic membrane characteristics (Beierlein et al., 2003; Cruikshank et al., 2007). Experiments were conducted with Axon Instruments hardware and software (Multiclamp 700B, Digidata 1440A, pClamp 10). Series resistances (∼ 10-25 MΩ) were compensated on-line (100% for I-clamp, 50-70% for V-clamp). Voltages were corrected for a 14 mV liquid junction potential. Statistical p-values were calculated using t-tests. Error bars are SEM unless specified.
To assess responses to optical stimulation of TC and CT pathways, whole cell recordings were made from neocortical or thalamic neurons, respectively, and responses to blue laser stimuli (440-447 nm) were measured in current- and voltage-clamp. The laser was usually focused as a 10 μm diameter spot through a 40× water immersion objective, although a 100 μm diameter spot was applied through a 4× air immersion objective in some experiments (specified in Results). Maximum total laser power at the focal plane of the slice was ∼ 4.5 mW when delivered through the 40× objective and ∼ 20 mW through the 4× objective. For synaptic stimulation, 0.05 to 2 ms flashes were delivered either directly over the recorded soma or upstream along the TC or CT pathways. In control experiments extracellular electrical stimulation was applied to the CT pathway through paired microwires (FHC: 25 μm diameter; 4-256 μA; 0.2 ms).
Supplementary Material
Acknowledgments
We thank Heng Xu and Jiayi Zhang for help setting up our first laser system and Heng Xu for expert guidance and help subsequently. We also thank Kristen Richardson for mice, Saundra Patrick for technical help and Karl Deisseroth, Feng Zhang, and the Deisseroth group for their generosity with DNA, advice and training. SJC and BWC were supported by the NIH (NS25983, NS05043) and the BIBS. HU and AVN were supported by the NIH (NIBIB, NCMRR/NICHD) under the BRP Program (1R01EB007401-01), the NSF (0725740), and the DOE (ER46387).
Footnotes
Publisher's Disclaimer: This is a PDF file of an unedited manuscript that has been accepted for publication. As a service to our customers we are providing this early version of the manuscript. The manuscript will undergo copyediting, typesetting, and review of the resulting proof before it is published in its final citable form. Please note that during the production process errors may be discovered which could affect the content, and all legal disclaimers that apply to the journal pertain.
References
- Agmon A, Connors BW. Thalamocortical responses of mouse somatosensory (barrel) cortex in vitro. Neuroscience. 1991;41:365–379. doi: 10.1016/0306-4522(91)90333-j. [DOI] [PubMed] [Google Scholar]
- Agmon A, Yang LT, O'Dowd DK, Jones EG. Organized growth of thalamocortical axons from the deep tier of terminations into layer IV of developing mouse barrel cortex. J Neurosci. 1993;13:5365–5382. doi: 10.1523/JNEUROSCI.13-12-05365.1993. [DOI] [PMC free article] [PubMed] [Google Scholar]
- Alexander GM, Fisher TL, Godwin DW. Differential response dynamics of corticothalamic glutamatergic synapses in the lateral geniculate nucleus and thalamic reticular nucleus. Neuroscience. 2006;137:367–372. doi: 10.1016/j.neuroscience.2005.11.012. [DOI] [PubMed] [Google Scholar]
- Alger BE, et al. Appendix: Brain Slice Methods. In: Dingledine R, editor. Brain Slices. New York: Plenum Press; 1984. [Google Scholar]
- Atasoy D, Aponte Y, Su HH, Sternson SM. A FLEX switch targets Channelrhodopsin-2 to multiple cell types for imaging and long-range circuit mapping. J Neurosci. 2008;28:7025–7030. doi: 10.1523/JNEUROSCI.1954-08.2008. [DOI] [PMC free article] [PubMed] [Google Scholar]
- Beierlein M, Connors BW. Short-term dynamics of thalamocortical and intracortical synapses onto layer 6 neurons in neocortex. J Neurophysiol. 2002;88:1924–1932. doi: 10.1152/jn.2002.88.4.1924. [DOI] [PubMed] [Google Scholar]
- Beierlein M, Gibson JR, Connors BW. Two dynamically distinct inhibitory networks in layer 4 of the neocortex. J Neurophysiol. 2003;90:2987–3000. doi: 10.1152/jn.00283.2003. [DOI] [PubMed] [Google Scholar]
- Bernardo KL, Woolsey TA. Axonal trajectories between mouse somatosensory thalamus and cortex. J Comp Neurol. 1987;258:542–564. doi: 10.1002/cne.902580406. [DOI] [PubMed] [Google Scholar]
- Berndt A, Yizhar O, Gunaydin LA, Hegemann P, Deisseroth K. Bi-stable neural state switches. Nat Neurosci. 2009;12:229–234. doi: 10.1038/nn.2247. [DOI] [PubMed] [Google Scholar]
- Boyden ES, Zhang F, Bamberg E, Nagel G, Deisseroth K. Millisecond-timescale, genetically targeted optical control of neural activity. Nat Neurosci. 2005;8:1263–1268. doi: 10.1038/nn1525. [DOI] [PubMed] [Google Scholar]
- Cardin JA, Carlen M, Meletis K, Knoblich U, Zhang F, Deisseroth K, Tsai LH, Moore CI. Driving fast-spiking cells induces gamma rhythm and controls sensory responses. Nature. 2009;459:663–667. doi: 10.1038/nature08002. [DOI] [PMC free article] [PubMed] [Google Scholar]
- Cox CL, Huguenard JR, Prince DA. Nucleus reticularis neurons mediate diverse inhibitory effects in thalamus. Proc Natl Acad Sci U S A. 1997;94:8854–8859. doi: 10.1073/pnas.94.16.8854. [DOI] [PMC free article] [PubMed] [Google Scholar]
- Cruikshank SJ, Lewis TJ, Connors BW. Synaptic basis for intense thalamocortical activation of feedforward inhibitory cells in neocortex. Nat Neurosci. 2007;10:462–468. doi: 10.1038/nn1861. [DOI] [PubMed] [Google Scholar]
- Cruikshank SJ, Rose HJ, Metherate R. Auditory thalamocortical synaptic transmission in vitro. J Neurophysiol. 2002;87:361–384. doi: 10.1152/jn.00549.2001. [DOI] [PubMed] [Google Scholar]
- Daw MI, Ashby MC, Isaac JT. Coordinated developmental recruitment of latent fast spiking interneurons in layer IV barrel cortex. Nat Neurosci. 2007;10:453–461. doi: 10.1038/nn1866. [DOI] [PubMed] [Google Scholar]
- Deleuze C, Huguenard JR. Distinct electrical and chemical connectivity maps in the thalamic reticular nucleus: potential roles in synchronization and sensation. J Neurosci. 2006;26:8633–8645. doi: 10.1523/JNEUROSCI.2333-06.2006. [DOI] [PMC free article] [PubMed] [Google Scholar]
- Deschenes M, Veinante P, Zhang ZW. The organization of corticothalamic projections: reciprocity versus parity. Brain Res Brain Res Rev. 1998;28:286–308. doi: 10.1016/s0165-0173(98)00017-4. [DOI] [PubMed] [Google Scholar]
- Fanselow EE, Richardson KA, Connors BW. Selective, state-dependent activation of somatostatin-expressing inhibitory interneurons in mouse neocortex. J Neurophysiol. 2008;100:2640–2652. doi: 10.1152/jn.90691.2008. [DOI] [PMC free article] [PubMed] [Google Scholar]
- Feldmeyer D, Roth A, Sakmann B. Monosynaptic connections between pairs of spiny stellate cells in layer 4 and pyramidal cells in layer 5A indicate that lemniscal and paralemniscal afferent pathways converge in the infragranular somatosensory cortex. J Neurosci. 2005;25:3423–3431. doi: 10.1523/JNEUROSCI.5227-04.2005. [DOI] [PMC free article] [PubMed] [Google Scholar]
- Furuta T, Kaneko T, Deschenes M. Septal neurons in barrel cortex derive their receptive field input from the lemniscal pathway. J Neurosci. 2009;29:4089–4095. doi: 10.1523/JNEUROSCI.5393-08.2009. [DOI] [PMC free article] [PubMed] [Google Scholar]
- Gabernet L, Jadhav SP, Feldman DE, Carandini M, Scanziani M. Somatosensory integration controlled by dynamic thalamocortical feed-forward inhibition. Neuron. 2005;48:315–327. doi: 10.1016/j.neuron.2005.09.022. [DOI] [PubMed] [Google Scholar]
- Gentet LJ, Ulrich D. Electrophysiological characterization of synaptic connections between layer VI cortical cells and neurons of the nucleus reticularis thalami in juvenile rats. Eur J Neurosci. 2004;19:625–633. doi: 10.1111/j.1460-9568.2004.03168.x. [DOI] [PubMed] [Google Scholar]
- Gibson JR, Beierlein M, Connors BW. Two networks of electrically coupled inhibitory neurons in neocortex. Nature. 1999;402:75–79. doi: 10.1038/47035. [DOI] [PubMed] [Google Scholar]
- Gil Z, Connors BW, Amitai Y. Differential regulation of neocortical synapses by neuromodulators and activity. Neuron. 1997;19:679–686. doi: 10.1016/s0896-6273(00)80380-3. [DOI] [PubMed] [Google Scholar]
- Golshani P, Liu XB, Jones EG. Differences in quantal amplitude reflect GluR4-subunit number at corticothalamic synapses on two populations of thalamic neurons. Proc Natl Acad Sci U S A. 2001;98:4172–4177. doi: 10.1073/pnas.061013698. [DOI] [PMC free article] [PubMed] [Google Scholar]
- Gradinaru V, Mogri M, Thompson KR, Henderson JM, Deisseroth K. Optical deconstruction of parkinsonian neural circuitry. Science. 2009;324:354–359. doi: 10.1126/science.1167093. [DOI] [PMC free article] [PubMed] [Google Scholar]
- Gradinaru V, Thompson KR, Zhang F, Mogri M, Kay K, Schneider MB, Deisseroth K. Targeting and readout strategies for fast optical neural control in vitro and in vivo. J Neurosci. 2007;27:14231–14238. doi: 10.1523/JNEUROSCI.3578-07.2007. [DOI] [PMC free article] [PubMed] [Google Scholar]
- Gupta A, Wang Y, Markram H. Organizing principles for a diversity of GABAergic interneurons and synapses in the neocortex. Science. 2000;287:273–278. doi: 10.1126/science.287.5451.273. [DOI] [PubMed] [Google Scholar]
- Hajos N, Ellender TJ, Zemankovics R, Mann EO, Exley R, Cragg SJ, Freund TF, Paulsen O. Maintaining network activity in submerged hippocampal slices: importance of oxygen supply. Eur J Neurosci. 2009;29:319–327. doi: 10.1111/j.1460-9568.2008.06577.x. [DOI] [PMC free article] [PubMed] [Google Scholar]
- Halabisky B, Shen F, Huguenard JR, Prince DA. Electrophysiological classification of somatostatin-positive interneurons in mouse sensorimotor cortex. J Neurophysiol. 2006;96:834–845. doi: 10.1152/jn.01079.2005. [DOI] [PubMed] [Google Scholar]
- Huguenard JR, McCormick DA. Thalamic synchrony and dynamic regulation of global forebrain oscillations. Trends Neurosci. 2007;30:350–356. doi: 10.1016/j.tins.2007.05.007. [DOI] [PubMed] [Google Scholar]
- Inoue T, Imoto K. Feedforward inhibitory connections from multiple thalamic cells to multiple regular-spiking cells in layer 4 of the somatosensory cortex. J Neurophysiol. 2006;96:1746–1754. doi: 10.1152/jn.00301.2006. [DOI] [PubMed] [Google Scholar]
- Ishizuka T, Kakuda M, Araki R, Yawo H. Kinetic evaluation of photosensitivity in genetically engineered neurons expressing green algae light-gated channels. Neurosci Res. 2006;54:85–94. doi: 10.1016/j.neures.2005.10.009. [DOI] [PubMed] [Google Scholar]
- Jones EG. Synchrony in the interconnected circuitry of the thalamus and cerebral cortex. Ann N Y Acad Sci. 2009;1157:10–23. doi: 10.1111/j.1749-6632.2009.04534.x. [DOI] [PubMed] [Google Scholar]
- Jones EG, Powell TP. An electron microscopic study of the mode of termination of cortico-thalamic fibres within the sensory relay nuclei of the thalamus. Proc R Soc Lond B Biol Sci. 1969;172:173–185. doi: 10.1098/rspb.1969.0018. [DOI] [PubMed] [Google Scholar]
- Katz B, Miledi R. A study of synaptic transmission in the absence of nerve impulses. J Physiol. 1967;192:407–436. doi: 10.1113/jphysiol.1967.sp008307. [DOI] [PMC free article] [PubMed] [Google Scholar]
- Kawaguchi Y, Kubota Y. GABAergic cell subtypes and their synaptic connections in rat frontal cortex. Cereb Cortex. 1997;7:476–486. doi: 10.1093/cercor/7.6.476. [DOI] [PubMed] [Google Scholar]
- Lam YW, Nelson CS, Sherman SM. Mapping of the functional interconnections between thalamic reticular neurons using photostimulation. J Neurophysiol. 2006;96:2593–2600. doi: 10.1152/jn.00555.2006. [DOI] [PubMed] [Google Scholar]
- Lam YW, Sherman SM. Functional Organization of the Somatosensory Cortical Layer 6 Feedback to the Thalamus. Cereb Cortex. 2009 May 15; doi: 10.1093/cercor/bhp077. 2009. [DOI] [PMC free article] [PubMed] [Google Scholar]
- Landisman CE, Connors BW. VPM and PoM nuclei of the rat somatosensory thalamus: intrinsic neuronal properties and corticothalamic feedback. Cereb Cortex. 2007;17:2853–2865. doi: 10.1093/cercor/bhm025. [DOI] [PubMed] [Google Scholar]
- Lin JY, Lin MZ, Steinbach P, Tsien RY. Characterization of engineered channelrhodopsin variants with improved properties and kinetics. Biophys J. 2009;96:1803–1814. doi: 10.1016/j.bpj.2008.11.034. [DOI] [PMC free article] [PubMed] [Google Scholar]
- Ma Y, Hu H, Berrebi AS, Mathers PH, Agmon A. Distinct subtypes of somatostatin-containing neocortical interneurons revealed in transgenic mice. J Neurosci. 2006;26:5069–5082. doi: 10.1523/JNEUROSCI.0661-06.2006. [DOI] [PMC free article] [PubMed] [Google Scholar]
- McCormick DA, Connors BW, Lighthall JW, Prince DA. Comparative electrophysiology of pyramidal and sparsely spiny stellate neurons of the neocortex. J Neurophysiol. 1985;54:782–806. doi: 10.1152/jn.1985.54.4.782. [DOI] [PubMed] [Google Scholar]
- Metherate R, Cruikshank SJ. Thalamocortical inputs trigger a propagating envelope of gamma-band activity in auditory cortex in vitro. Exp Brain Res. 1999;126:160–174. doi: 10.1007/s002210050726. [DOI] [PubMed] [Google Scholar]
- Mountcastle VM. Perceptual Neuroscience. Harvard University Press; 1998. [Google Scholar]
- Nagel G, Szellas T, Huhn W, Kateriya S, Adeishvili N, Berthold P, Ollig D, Hegemann P, Bamberg E. Channelrhodopsin-2, a directly light-gated cation-selective membrane channel. Proc Natl Acad Sci U S A. 2003;100:13940–13945. doi: 10.1073/pnas.1936192100. [DOI] [PMC free article] [PubMed] [Google Scholar]
- Neher E, Sakaba T. Multiple roles of calcium ions in the regulation of neurotransmitter release. Neuron. 2008;59:861–872. doi: 10.1016/j.neuron.2008.08.019. [DOI] [PubMed] [Google Scholar]
- Oliva AA, Jr, Jiang M, Lam T, Smith KL, Swann JW. Novel hippocampal interneuronal subtypes identified using transgenic mice that express green fluorescent protein in GABAergic interneurons. J Neurosci. 2000;20:3354–3368. doi: 10.1523/JNEUROSCI.20-09-03354.2000. [DOI] [PMC free article] [PubMed] [Google Scholar]
- Parker PR, Cruikshank SJ, Connors BW. Stability of electrical coupling despite massive developmental changes of intrinsic neuronal physiology. J Neurosci. 2009;29:9761–9770. doi: 10.1523/JNEUROSCI.4568-08.2009. [DOI] [PMC free article] [PubMed] [Google Scholar]
- Petreanu L, Huber D, Sobczyk A, Svoboda K. Channelrhodopsin-2-assisted circuit mapping of long-range callosal projections. Nat Neurosci. 2007;10:663–668. doi: 10.1038/nn1891. [DOI] [PubMed] [Google Scholar]
- Petreanu L, Mao T, Sternson SM, Svoboda K. The subcellular organization of neocortical excitatory connections. Nature. 2009;457:1142–1145. doi: 10.1038/nature07709. [DOI] [PMC free article] [PubMed] [Google Scholar]
- Porter JT, Johnson CK, Agmon A. Diverse types of interneurons generate thalamus-evoked feedforward inhibition in the mouse barrel cortex. J Neurosci. 2001;21:2699–2710. doi: 10.1523/JNEUROSCI.21-08-02699.2001. [DOI] [PMC free article] [PubMed] [Google Scholar]
- Reichova I, Sherman SM. Somatosensory corticothalamic projections: distinguishing drivers from modulators. J Neurophysiol. 2004;92:2185–2197. doi: 10.1152/jn.00322.2004. [DOI] [PubMed] [Google Scholar]
- Reyes A, Lujan R, Rozov A, Burnashev N, Somogyi P, Sakmann B. Target-cell-specific facilitation and depression in neocortical circuits. Nat Neurosci. 1998;1:279–285. doi: 10.1038/1092. [DOI] [PubMed] [Google Scholar]
- Sabatini BL, Regehr WG. Timing of synaptic transmission. Annu Rev Physiol. 1999;61:521–542. doi: 10.1146/annurev.physiol.61.1.521. [DOI] [PubMed] [Google Scholar]
- Silberberg G. Polysynaptic subcircuits in the neocortex: spatial and temporal diversity. Curr Opin Neurobiol. 2008;18:332–337. doi: 10.1016/j.conb.2008.08.009. [DOI] [PubMed] [Google Scholar]
- Sun QQ, Huguenard JR, Prince DA. Barrel cortex microcircuits: thalamocortical feedforward inhibition in spiny stellate cells is mediated by a small number of fast-spiking interneurons. J Neurosci. 2006;26:1219–1230. doi: 10.1523/JNEUROSCI.4727-04.2006. [DOI] [PMC free article] [PubMed] [Google Scholar]
- Swadlow HA, Bezdudnaya T, Gusev AG. Spike timing and synaptic dynamics at the awake thalamocortical synapse. Prog Brain Res. 2005;149:91–105. doi: 10.1016/S0079-6123(05)49008-1. [DOI] [PubMed] [Google Scholar]
- Tan Z, Hu H, Huang ZJ, Agmon A. Robust but delayed thalamocortical activation of dendritic-targeting inhibitory interneurons. Proc Natl Acad Sci U S A. 2008;105:2187–2192. doi: 10.1073/pnas.0710628105. [DOI] [PMC free article] [PubMed] [Google Scholar]
- Temereanca S, Simons DJ. Functional topography of corticothalamic feedback enhances thalamic spatial response tuning in the somatosensory whisker/barrel system. Neuron. 2004;41:639–651. doi: 10.1016/s0896-6273(04)00046-7. [DOI] [PubMed] [Google Scholar]
- Thomson AM, Lamy C. Functional maps of neocortical local circuitry. Front Neurosci. 2007;1:19–42. doi: 10.3389/neuro.01.1.1.002.2007. [DOI] [PMC free article] [PubMed] [Google Scholar]
- Varga V, Losonczy A, Zemelman BV, Borhegyi Z, Nyiri G, Domonkos A, Hangya B, Holderith N, Magee JC, Freund TF. Fast synaptic subcortical control of hippocampal circuits. Science. 2009;326:449–453. doi: 10.1126/science.1178307. [DOI] [PubMed] [Google Scholar]
- Wang H, Peca J, Matsuzaki M, Matsuzaki K, Noguchi J, Qiu L, Wang D, Zhang F, Boyden E, Deisseroth K, et al. High-speed mapping of synaptic connectivity using photostimulation in Channelrhodopsin-2 transgenic mice. Proc Natl Acad Sci U S A. 2007;104:8143–8148. doi: 10.1073/pnas.0700384104. [DOI] [PMC free article] [PubMed] [Google Scholar]
- Wong LF, Azzouz M, Walmsley LE, Askham Z, Wilkes FJ, Mitrophanous KA, Kingsman SM, Mazarakis ND. Transduction patterns of pseudotyped lentiviral vectors in the nervous system. Mol Ther. 2004;9:101–111. doi: 10.1016/j.ymthe.2003.09.017. [DOI] [PubMed] [Google Scholar]
- Zhang L, Jones EG. Corticothalamic inhibition in the thalamic reticular nucleus. J Neurophysiol. 2004;91:759–766. doi: 10.1152/jn.00624.2003. [DOI] [PubMed] [Google Scholar]
Associated Data
This section collects any data citations, data availability statements, or supplementary materials included in this article.