Abstract
State diagrams (stategraphs) are suitable for describing the behavior of dynamic systems. However, when they are used to model large and complex systems, determining the states and transitions among them can be overwhelming, due to their flat, unstratified structure. In this article, we present the use of statecharts as a novel way of modeling complex gene networks. Statecharts extend conventional state diagrams with features such as nested hierarchy, recursion, and concurrency. These features are commonly utilized in engineering for designing complex systems and can enable us to model complex gene networks in an efficient and systematic way. We modeled five key gene network motifs, simple regulation, autoregulation, feed-forward loop, single-input module, and dense overlapping regulon, using statecharts. Specifically, utilizing nested hierarchy and recursion, we were able to model a complex interlocked feed-forward loop network in a highly structured way, demonstrating the potential of our approach for modeling large and complex gene networks.
Introduction
Motivation
One of the main research topics of systems biology is the study of gene networks that involve the interactions between transcription factor proteins and the genes that they regulate [1]–[4]. There have been two ways of approaching this subject: bottom-up and top-down [5]. In a bottom-up approach, mathematics is used to model the dynamics, starting from detailed knowledge of the networks [6]–[9]. Live cell fluorescent reporter assay is one of the commonly used experimental techniques for the bottom-up approach [10]. On the other hand, a top-down approach aims at understanding the networks for which very limited knowledge is available [5]. Even though it is less accurate in terms of “physical quantities”, compared to the bottom-up approach, it has an advantage for dealing with large networks. For example, it can make use of expression profiling by DNA microarrays and analyze whole genome data [11]–[13].
Various mathematical and computational approaches have been developed for gene network modeling, including Boolean networks, Bayesian networks, Petri nets, ordinary differential equations, and stochastic simulation algorithms [1], [14]–[27]. These approaches can generally be grouped into two larger categories: logical and continuous models. Logical models are simple because they deal only with the logical sequence of events. On the other hand, continuous models can describe dynamics that depend on finer timing and exact molecular concentrations. Since gene expression is fundamentally stochastic, the continuous models can also include noise [19], [28]–[30]. Many dynamic systems can be approximately described using differential equations and they have been used to model the dynamics of various gene networks [9], [15], [25], [31]–[34]. Prior knowledge of system parameter values, extracted from experimental data through optimization, is required for such modeling [35].
Logical Models
Logical models can describe gene networks qualitatively [14], [36]. Even though they are simple and easy, compared to continuous models described above, they can still allow us to obtain a basic understanding of the dynamics of complex networks. It is important to note that logical models are not generated by simple discrete approximation of the real-valued data used in continuous models. Logical models are often regarded as inferior to continuous models, based on a misunderstanding that logical models are just a simplified version of continuous models and both of them belong to the same domain. Continuous models belong to physical domain where a measurable time or quantity exists. Logical models, on the other hand, belong to a different domain, logical domain, where we are interested only in states (e.g., the presence or absence of a signal, protein, mRNA, etc.) and the sequence of state transitions (e.g., feed- forward loops described in detail later). In other words, the exact amount of physical quantities can be neglected as long as the state of entities and the sequence of state transitions are correct in logical models. Therefore, logical models are basically asynchronous, meaning that the state transitions are not confined to specific times and may occur at any time when inputs/conditions are ready/satisfied.
Boolean network, first presented by Kauffman [14], is a logical modeling approach that uses binary representation for the state of biological entities. For example, the existence of a signal can be represented as 1 (present) or 0 (absent), and the expression of a gene can also be shown as 1 (active) or 0 (inactive). Given inputs, a system may go through various transient states and eventually reach a steady state. The steady or final state and its outputs, which depend on only the input values, can be simulated and determined using combinational logic [37]. Combinational logic-based models cannot show transient or intermediate states that may have as much biological significance as the steady or final states. Therefore, there have been various approaches for capturing the transient states of gene networks, including model checking, Petri nets, Markov chain, and sequential logic [20], [23], [38]. For example, in sequential logic-based models, outputs depend on both the present state and input values [37]. In such models, even if same inputs are given, outputs can be different depending on the present state of a system, generating many different transient states. Sequential logic-based models are often represented as finite state machines and state diagrams [37]. Even though these approaches are good at showing the transient states of a dynamic system, they become less successful as the system becomes larger and more complex. For instance, in large sequential logic-based models, determining and managing the states and transitions among them can be overwhelming, due to their flat, unstratified structure. This can be resolved using statecharts as described below.
Statecharts
Gene networks are made of a small set of recurring modules, called network motifs: (i) simple regulation (two-gene network), (ii) autoregulation, (iii) feed-forward loop, (iv) single-input module, and (v) dense overlapping regulon [4], [31]. In fact, the last four motifs are variations and/or combinations of the first motif, simple regulation. In other words, simple regulation is a fundamental unit or module of gene networks and can serve as a basic building block for constructing more complex networks. Modularity is an important property that allows scientists and engineers to model, design, or analyze complex systems in a structured and efficient way. A large system made of multiple modules can be regarded as a module for an even larger system. Also, through abstraction, the details of sub-modules (modules inside a module) can be hidden. Therefore, using modularity and abstraction, a complex, multi-level (nested) hierarchy can be implemented while maintaining simplicity.
Statechart is a sequential logic-based modeling approach that extends classical state diagram with additional features such as nested hierarchy, concurrency, and recursion, enabling us to model large gene networks in an efficient and systematic way [39]. In this paper, we will model the known network motifs described above using statecharts and describe the important features. A complex interlocked feed-forward loop network will be also modeled, demonstrating the potential of the approach for modeling large and complex gene networks.
Understanding Simple Regulation in Continuous Domain
Understanding simple regulation, the basic building block of gene networks, in continuous (physical) domain is helpful for appreciating gene networks modeled in logical domain. A differential equation-based model of simple regulation is described in detail below.
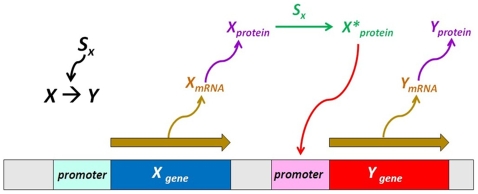
In simple regulation, Ygene is activated by Xgene, as indicated by the notation, X→Y, in Figure 1. Even though the notation is quite simple, it involves a number of steps. First, Xgene is transcribed into XmRNA, which is then translated into Xprotein. In the presence of signal Sx, Xprotein transits to its active form X*protein and binds the promoter of Ygene, transcribing Ygene into YmRNA. Finally, as YmRNA is translated, Yprotein is produced. Overall, the signal Sx acts like a switch, controlling the rate of the Yprotein production.
Figure 1. A schematic illustration of simple regulation (X→Y).
First, Xgene is transcribed into XmRNA, which is then translated into Xprotein. In the presence of signal Sx, Xprotein transits to its active form X*protein and binds the promoter of Ygene, transcribing Ygene into YmRNA. Finally, as YmRNA is translated, Yprotein is produced.
Depending on the concentration of X*protein, Yprotein is formed at a rate f(t), a function of time (units of concentration per unit time). The production is balanced by processes that decrease Yprotein, namely degradation (protein destruction by specialized enzymes) and dilution (concentration reduction due to the increase of cell volume during growth) [31]. Degradation and dilution can be collectively denoted as d(t) (units of one per unit time). The change in the concentration of Yprotein depends on both f(t) and d(t). Using a differential equation, its dynamics can be described as:
where y(t) stands for the concentration of Yprotein.
As stated earlier, Xprotein must be converted to X*protein by the signal Sx in order to initiate the Yprotein production. The concentration of X*protein can be expressed as a function of Sx, which is acting as an activating switch. The elements of biological systems that have switch-like relationships with one another can be described using the Hill function [40]. Thus, the relationship between X*protein and Sx can be expressed as:
where x(t) stands for the concentration of Xprotein. It is the maximal level of X*protein or x*(t) (in units of concentration) that is reached when Sx≫K1A. K1A is the concentration of Sx, at which half-maximal concentration of x*(t) is reached. The Hill coefficient l changes the steepness of the function. When Sx acts as a repressor, the Hill function can be expressed as:
 |
where K1B is the concentration of Sx, at which half-maximal repression of the x*(t) production is reached.
The relationship between f(t) and X*protein (Sx) or x*(t) has also been experimentally demonstrated as [33]:
Fmax is the maximal level of the Yprotein production (in units of concentration per unit time) that is reached when x*(t)≫K2A. K2A is the concentration of x*(t) at which half-maximal production of Yprotein is reached. Again, m is the Hill coefficient. Similarly, when x*(t) acts as a repressor, the Hill function can be shown as:
 |
where K2B is the concentration of x*(t) at which half-maximal repression of the Yprotein production is reached.
Results and Discussion
Simple Regulation
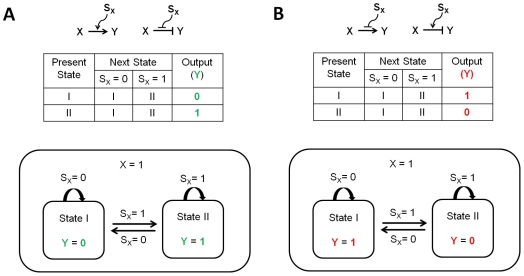
Figure 2 shows the state tables and statecharts of various simple regulations. The existence of the signal Sx is denoted by 1 (present) and 0 (absent). The expression state of gene X and Y is also represented as 1 (active) and 0 (inactive). It is assumed that gene X is always expressed (X = 1). The signal Sx and transcription factor X can act both as activators or repressors. Therefore, for simple regulation, there are four possible combinations regarding the actions of the signal and transcription factor. When they act in the same way (both of them are either activators or repressors), it is called a coherent simple regulation (Fig. 2A). On the other hand, if the signal and transcription factor behave in opposite ways (one is an activator while the other one is a repressor), it is an incoherent simple regulation (Fig. 2B). Note that both State I and II are within a larger state where X = 1, forming a nested hierarchical structure. The large state (X = 1) is a superstate, and state I and II are substates. The current state of the signal Sx determines which substate is an initial (or starting) substate. For example, in Figure 2A, if Sx = 1 then the right substate is considered first during execution.
Figure 2. Simple regulation.
(A) Coherent simple regulation. Both the signal SX and transcription factor X act either as activators or repressors. (B) Incoherent simple regulation. One of them acts as an activator and the other acts as a repressor.
Autoregulation
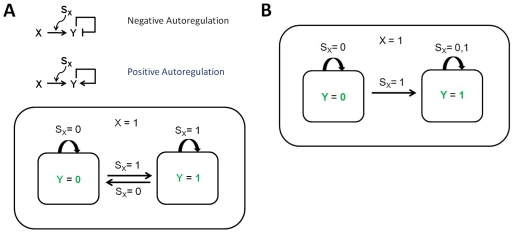
Negative autoregulation occurs when a transcription factor represses the transcription of its own gene (negative feedback). It is known that negative autoregulation speeds up the response time of gene expression and reduce the cell-cell variation in protein levels [31]. Positive autoregulation occurs when a transcription factor enhances its own protein production rate. In contrast to negative autoregulation, the response time is slowed and the cell-cell variation is increased [31]. Both negative and positive autoregulations are identical to simple regulation in logical domain because only the state of entities and the sequence of state transitions are considered, neglecting all the physical details such as the response time and cell-cell variation (Fig. 3A). It has been reported that when the rate of positive autoregulation is very strong compared to the degradation/dilution rate, the network can be locked in one state [31], [41], [42]. In other words, the expression state of gene Y may become irreversible once it is activated, even after the signal is no longer present, as shown in Figure 3B.
Figure 3. Autoregulations.
(A) Both negative and positive autoregulations are identical to simple regulation in logical domain. (B) Positive autoregulation may lock the network into a state where gene Y is constantly expressed.
Feed-Forward Loop (FFL)
Feed-forward loop (FFL) is one of the most studied motif classes [4], [32], [43], [44]. Among many types within the FFL class, coherent type-1 (C1-FFL) and incoherent type-1 (Ic1-FFL) are the ones commonly found in biological systems [31].
Figure 4A shows the statechart and state table of C1-FFL and Ic1-FFL. It is known that C1-FFL causes a delay and Ic1-FFL generates a pulse in the expression of gene Z [31]. The FFLs are equivalent to two cascaded simple regulations (Fig. 4B) with a junction at Z, upon which both X and Y are acting. As shown in both Figure 4A and 4B, cascaded simple regulations do not lose the basic structure of simple regulation (Fig. 2) through recurring hierarchical organization (recursion), decreasing the complexity of the model. Figure 4C shows a combinational logic-based rule that determines the overall effect of multiple signals at the junction. Only “and” and “or” are shown in the figure, however, theoretically all other known Boolean logic gates, such as “xor” and “nand”, can also be applied [37]. S[Y] signifies that multiple signals are acting on gene Y and the net effect is determined by their combinational logic-based rule. In Figure 4A, it is shown that C1-FFL involves “and” gate and Ic1-FFL is dependent on “doesn't imply” gate. Note that once these junction gates are defined, the statechart is identical for both types of FFLs.
Figure 4. Feed-forward loops.
(A) The statechart and state table for C1-FFL and Ic1-FFL. The truth table for the signals is also shown. (B) Cascaded simple regulations (C) Junction rule based on combinational logic. S[Y] signifies that multiple signals are acting on gene Y and the net effect is determined by their combinational logic-based rule.
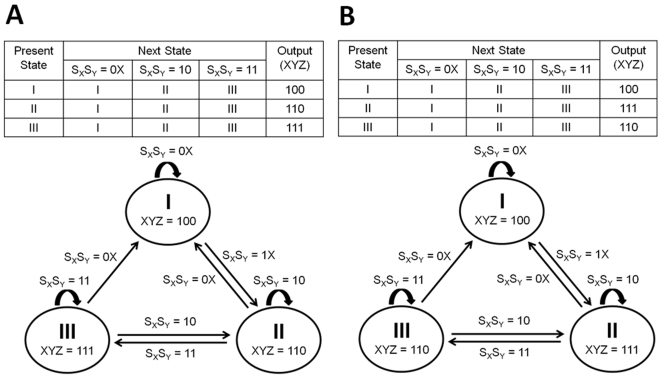
Figure 5 shows the state tables and state diagrams of FFLs. Note that the characteristic features of statecharts, such as nested hierarchy and recursion, cannot be seen in the state diagrams. We will show later (using an interlocked FFL gene network as an example) that the lack of those features increases the complexity of determining the states and drawing the transitions among them, as the network becomes larger.
Figure 5. State diagrams of FFLs.
(A) The state table and state diagram of C1-FFL. The symbol X (denoting “don't care”) for the signal indicates that it can be either 1 or 0. (B) The state table and state diagram of Ic1-FFL.
Single-Input Module (Parallel Simple Regulations)
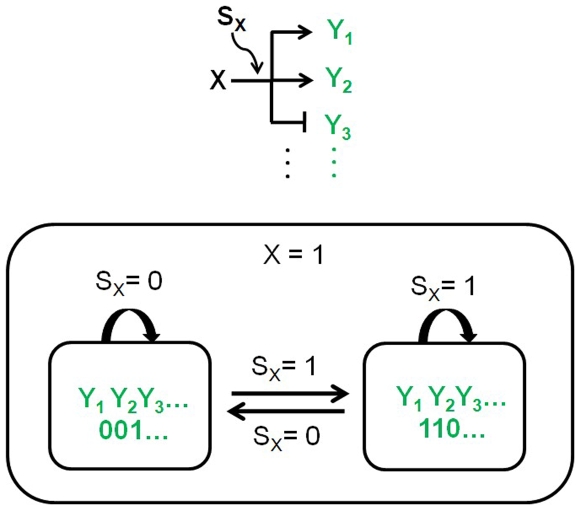
In a single-input module, multiples genes (Y1, Y2, Y3, …) are controlled by a single gene X (Fig. 6). It can be considered as parallel simple regulations, in contrast to cascaded simple regulations shown in Figure 4B. The structure of the statechart is basically identical to that of simple regulation (Fig. 2), maintaining simplicity. Parallel and cascaded simple regulations are two major interconnection topologies or configurations that can make gene networks complex and diverse.
Figure 6. Single-input module.
Multiples genes (Y1, Y2, Y3, …) are controlled by a single gene X.
Dense Overlapping Regulon
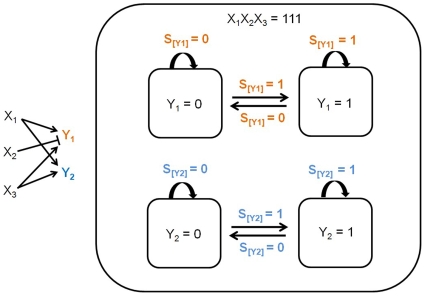
Figure 7 shows an example of dense overlapping regulon. Two simple regulation-like diagrams with combinational logic-based junctions (S[Y1] and S[Y2]) are placed within a superstate (X1X2X 3 = 111). This example shows one of the important features of statecharts, concurrency. While the superstate (X1X2X 3) is active, two statecharts (each involving Y1 or Y2) are executed in parallel. It is not shown in the figure, but the signals that determine S[Y1] and S[Y2], based on combinational logic, are Sx1, Sx2, and Sx3. Note that the number of simple regulation-like diagrams depends on the number of Y-level genes (Y1, Y2, …) and not X-level genes.
Figure 7. Dense overlapping regulon.
Two simple regulations with combinational logic-based junctions (S[Y1] and S[Y2]) are within the same state (X1X2X 3 = 111). While the superstate (X1X2X 3) is active, two statecharts (each involving Y1 or Y2) are executed in parallel. It is not shown in the figure, but the signals that determine S[Y1] and S[Y2], based on combinational logic, are Sx1, Sx2, and Sx3.
Interlocked FFL Network
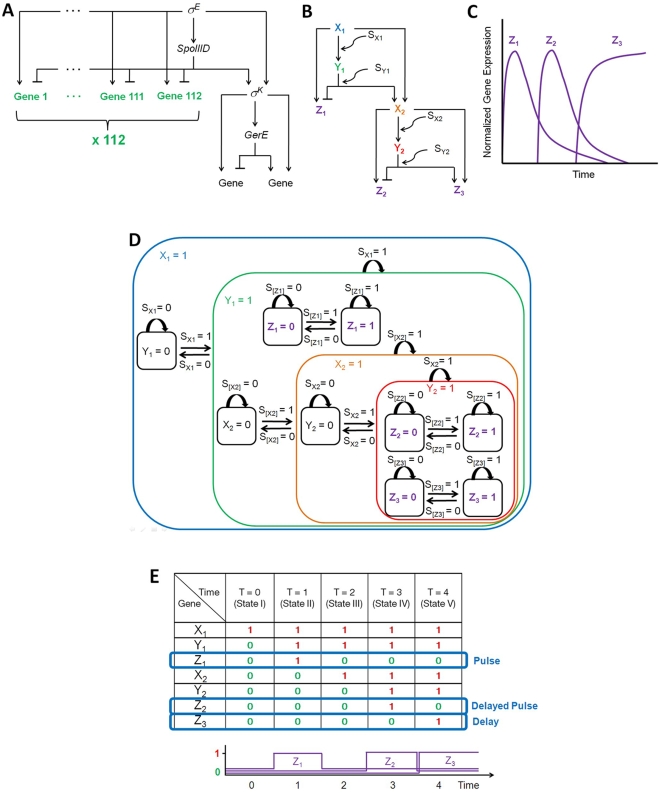
It is known that FFLs can be combined into more complex and larger transcription networks [4]. One example is found in the bacterium Bacillus subtilis where the network controls differentiation [45]. Figure 8A shows the network from the literature. The network is made up of many repeating C1-FFLs and Ic1-FFLs. However, only 112 FFLs, which are clearly described as repeating Ic1-FFLs in the literature, are included in the figure. Figure 8B shows a simplified schematic illustration of the network. Since 112 genes behave in the same way (incoherent type-1 feed-forward loop), we denote them simply as Z 1, simplifying the representation. The behavior of each gene can be understood using the concept of single-input module (parallel simple regulations) described earlier. Figure 8C shows time-dependent gene expression pattern of Z1, Z2, and Z3 [4]. Two Ic1-FFLs generate pulses in the expression of Z1 and Z2, and two C1-FFLs cause delays in the Z2 and Z3 expression.
Figure 8. Interlocked FFL network.
(A) In Bacillus subtilis. (B) A simplified schematic illustration. (C) Time-dependent gene expression of Z 1, Z 2, and Z 3. (D) Statechart based on (B). [Z1] and [Z2] follow “does not imply” gate logic, while [X2] and [Z3] follow “and” gate logic. (E) Time-dependent gene expression given all the signals (SX1, SY1, SX2, and SY2) turned on simultaneously. Z1 and Z2 pulses and delayed Z2 and Z3 expression can be observed as shown in (C). These pulses and delays are observable because the statecharts enable us to track the transient states (states I through VI) during execution.
Figure 8D shows the statechart of the network. The total number of genes involved in the network is 118 (Fig. 8A). It is striking that the total number of all the superstates and substates is greatly reduced, even though the number of all the possible gene expression combinations is 2117 (not 2118 because it is assumed that the expression state of the first gene X1 is on (X1 = 1), which is approximately 1.66×1035. Note that parallel simple regulations discussed in Single-Input Module section makes this reduction possible. Furthermore, the important features (nested hierarchy, recursion, and concurrency) of statecharts discussed in previous sections are well demonstrated in this example.
When all the signals (SX1, SY1, SX2, and SY2) are turned on simultaneously, time-dependent gene expression can be shown as in Figure 8E. Z1 and Z2 pulses and delayed Z2 and Z3 expression are observed as expected in Figure 8C. These pulses and delays are observable because the statecharts enable us to track the transient states (states I through VI) during execution.
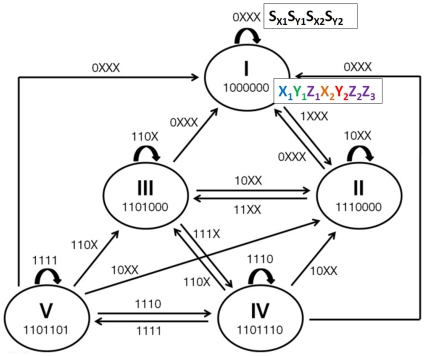
Figure 9 shows the state diagram of the same gene network. When we try to draw the state diagram, two major difficulties, compared to the statechart-based approach, become evident. First, in order to determine the states shown in the figure, we have to know the expression state of all genes for each state. This can be overwhelming if the number of genes is large. In contrast, knowing the expression state of a single gene per state is required in the statechart method (Fig. 8D). Secondly, in the state diagram, we need to consider every transition from one state to another, depending on every possible combination of the signals. Figure 9 shows that it makes the transition map very complicated. This chaotic transition problem is not seen in statecharts (Fig. 8D). In summary, determining the states and figuring out transitions between them can become daunting problem as the network size increases, and they can be handled in a more structured and efficient way using statecharts [39].
Figure 9. State diagram of the interlocked FFL network.
Determining the states and drawing the transitions between them are more complicated compared to the statechart-based approach.
Further Discussions
Feedback loop is not described as one of the motifs in the literature [31], and its statechart representation is not demonstrated in our paper. However, considering its importance, we intend to incorporate it into our modeling scheme in the future.
Figure 8E resembles time-series DNA microarray data, and it suggests that our approach may be useful for extracting network information from the data. In order to apply such approach, the first thing that needs to be done is extracting binary information (on and off state of each gene at different times) from experimental microarray data. However, even this is quite challenging currently because of the stochastic nature of the data and other reasons [46].
Conclusion
The dynamics of gene networks depend on both the present signal values and the past behavior of the system, and sequential logic-based state diagrams are appropriate for representing such dynamics. However, when they are used to model large, complex systems, determining the states and managing transitions between them can become chaotic and unrealistic. In this article, we demonstrated how statecharts, which extend state diagrams with features including nested hierarchy, recursion, and concurrency, enable us to model large gene networks in a highly structured and efficient way. We modeled five known gene network motifs, simple regulation, autoregulation, feed-forward loop, single-input module, and dense overlapping regulon, using the statechart method. Utilizing the important features of statecharts, we were also able to model a complex interlocked feed-forward loop network, demonstrating the potential of our approach for modeling large and gene networks.
Methods
The statechart method used in this article is described in detail in Results and Discussion Section. It was first invented by David Harel in 1980s, and a detailed introduction to the subject can also be found in one of his papers [39].
Footnotes
Competing Interests: The authors have declared that no competing interests exist.
Funding: The authors have no support or funding to report.
References
- 1.Hasty J, McMillen D, Isaacs F, Collins JJ. Computational studies of gene regulatory networks: in numero molecular biology. Nat Rev Genet. 2001;2:268–279. doi: 10.1038/35066056. [DOI] [PubMed] [Google Scholar]
- 2.Milo R, Shen-Orr S, Itzkovitz S, Kashtan N, Chklovskii D, et al. Network motifs: simple building blocks of complex networks. Science. 2002;298:824–827. doi: 10.1126/science.298.5594.824. [DOI] [PubMed] [Google Scholar]
- 3.Hooshangi S, Weiss R. The effect of negative feedback on noise propagation in transcriptional gene networks. Chaos. 2006;16:026108. doi: 10.1063/1.2208927. [DOI] [PubMed] [Google Scholar]
- 4.Alon U. Network motifs: theory and experimental approaches. Nat Rev Genet. 2007;8:450–461. doi: 10.1038/nrg2102. [DOI] [PubMed] [Google Scholar]
- 5.Cuccato G, Della Gatta G, di Bernardo D. Systems and Synthetic biology: tackling genetic networks and complex diseases. Heredity. 2009;102:527–532. doi: 10.1038/hdy.2009.18. [DOI] [PubMed] [Google Scholar]
- 6.Guido NJ, Wang X, Adalsteinsson D, McMillen D, Hasty J, et al. A bottom-up approach to gene regulation. Nature. 2006;439:856–860. doi: 10.1038/nature04473. [DOI] [PubMed] [Google Scholar]
- 7.Andrianantoandro E, Basu S, Karig DK, Weiss R. Synthetic biology: new engineering rules for an emerging discipline. Mol Syst Biol. 2006;2:2006.0028. doi: 10.1038/msb4100073. [DOI] [PMC free article] [PubMed] [Google Scholar]
- 8.Lu TK, Khalil AS, Collins JJ. Next-generation synthetic gene networks. Nat Biotechnol. 2009;27:1139–1150. doi: 10.1038/nbt.1591. [DOI] [PMC free article] [PubMed] [Google Scholar]
- 9.Endler L, Rodriguez N, Juty N, Chelliah V, Laibe C, et al. Designing and encoding models for synthetic biology. J R Soc Interface. 2009;6:S405–S417. doi: 10.1098/rsif.2009.0035.focus. [DOI] [PMC free article] [PubMed] [Google Scholar]
- 10.Pepperkok R, Ellenberg J. High-throughput fluorescence microscopy for systems biology. Nat Rev Mol Cell Biol. 2006;7:690–696. doi: 10.1038/nrm1979. [DOI] [PubMed] [Google Scholar]
- 11.Schena M. Quantitative monitoring of gene expression patterns with a complementary DNA microarray. Science. 1995;270:467. doi: 10.1126/science.270.5235.467. [DOI] [PubMed] [Google Scholar]
- 12.Kohane IS, Kho AK, Butte AJ. Cambridge: MIT Press; 2005. Microarrays for an Integrative Genomics. [Google Scholar]
- 13.Abdullah-Sayani A, Bueno-de-Mesquita JM, van de Vijver MJ. Technology Insight: tuning into the genetic orchestra using microarrays–limitations of DNA microarrays in clinical practice. Nat Clin Pract Oncol. 2006;3:501–516. doi: 10.1038/ncponc0587. [DOI] [PubMed] [Google Scholar]
- 14.Thomas R. Boolean formalization of genetic control circuits. J Theor Biol. 1973;42:563–585. doi: 10.1016/0022-5193(73)90247-6. [DOI] [PubMed] [Google Scholar]
- 15.Smolen P, Baxter DA, Byrne JH. Modeling transcriptional control in gene networks–methods, recent results, and future directions. Bull Math Biol. 2000;62:247–292. doi: 10.1006/bulm.1999.0155. [DOI] [PubMed] [Google Scholar]
- 16.Bower JM, Bolouri H. Cambridge: MIT Press; 2001. Computational Modeling of Genetic and Biochemical Networks. [Google Scholar]
- 17.Bolouri H, Davidson EH. Modeling transcriptional regulatory networks. Bioessays. 2002;24:1118–1129. doi: 10.1002/bies.10189. [DOI] [PubMed] [Google Scholar]
- 18.Shmulevich I, Dougherty ER, Zhang W. Gene perturbation and intervention in probabilistic Boolean networks. Bioinformatics. 2002;18:1319–1331. doi: 10.1093/bioinformatics/18.10.1319. [DOI] [PubMed] [Google Scholar]
- 19.Simpson ML, Cox CD, Sayler GS. Frequency domain analysis of noise in autoregulated gene circuits. Proc Natl Acad Sci USA. 2003;100:4551–4556. doi: 10.1073/pnas.0736140100. [DOI] [PMC free article] [PubMed] [Google Scholar]
- 20.Batt G, Ropers D, de Jong H, Geiselmann J, Mateescu R, et al. Validation of qualitative models of genetic regulatory networks by model checking: analysis of the nutritional stress response in Escherichia coli. Bioinformatics. 2005;21(Suppl 1):i19–28. doi: 10.1093/bioinformatics/bti1048. [DOI] [PubMed] [Google Scholar]
- 21.Goutsias J, Lee NH. Computational and experimental approaches for modeling gene regulatory networks. Curr Pharm Des. 2007;13:1415–1436. doi: 10.2174/138161207780765945. [DOI] [PubMed] [Google Scholar]
- 22.Rinaudo K, Bleris L, Maddamsetti R, Subramanian S, Weiss R, et al. A universal RNAi-based logic evaluator that operates in mammalian cells. Nat Biotechnol. 2007;25:795–801. doi: 10.1038/nbt1307. [DOI] [PubMed] [Google Scholar]
- 23.Steggles LJ, Banks R, Shaw O, Wipat A. Qualitatively modelling and analysing genetic regulatory networks: a Petri net approach. Bioinformatics. 2007;23:336–343. doi: 10.1093/bioinformatics/btl596. [DOI] [PubMed] [Google Scholar]
- 24.Schilstra Bio-logic: Gene expression and the laws of combinatorial logic. Artif Life. 2008;14:121. doi: 10.1162/artl.2008.14.1.121. [DOI] [PubMed] [Google Scholar]
- 25.Karlebach G, Shamir R. Modelling and analysis of gene regulatory networks. Nat Rev Mol Cell Biol. 2008;9:770–780. doi: 10.1038/nrm2503. [DOI] [PubMed] [Google Scholar]
- 26.Garg A, Di Cara A, Xenarios I, Mendoza L, De Micheli G. Synchronous versus asynchronous modeling of gene regulatory networks. Bioinformatics. 2008;24:1917–1925. doi: 10.1093/bioinformatics/btn336. [DOI] [PMC free article] [PubMed] [Google Scholar]
- 27.Bolouri H. London: Imperial College Press; 2008. Computational Modeling of Gene Regulatory Networks. [Google Scholar]
- 28.Cox CD, McCollum JM, Austin DW, Allen MS, Dar RD, et al. Frequency domain analysis of noise in simple gene circuits. Chaos. 2006;16:026102. doi: 10.1063/1.2204354. [DOI] [PubMed] [Google Scholar]
- 29.Raj A, van Oudenaarden A. Nature, nurture, or chance: stochastic gene expression and its consequences. Cell. 2008;135:216–226. doi: 10.1016/j.cell.2008.09.050. [DOI] [PMC free article] [PubMed] [Google Scholar]
- 30.Dunlop MJ, Cox RS, 3rd, Levine JH, Murray RM, Elowitz MB. Regulatory activity revealed by dynamic correlations in gene expression noise. Nat Genet. 2008;40:1493–1498. doi: 10.1038/ng.281. [DOI] [PMC free article] [PubMed] [Google Scholar]
- 31.Alon U. London: CRC; 2006. An Introduction to Systems Biology: Design Principles of Biological Circuits. [Google Scholar]
- 32.Kaplan S, Bren A, Dekel E, Alon U. The incoherent feed-forward loop can generate non-monotonic input functions for genes. Mol Syst Biol. 2008;4:203. doi: 10.1038/msb.2008.43. [DOI] [PMC free article] [PubMed] [Google Scholar]
- 33.Kaplan S, Bren A, Zaslaver A, Dekel E, Alon U. Diverse two-dimensional input functions control bacterial sugar genes. Mol Cell. 2008;29:786–792. doi: 10.1016/j.molcel.2008.01.021. [DOI] [PMC free article] [PubMed] [Google Scholar]
- 34.Wu FX. Gene Regulatory Network modelling: a state-space approach. Int J Data Min Bioinform. 2008;2:1–14. doi: 10.1504/ijdmb.2008.016753. [DOI] [PubMed] [Google Scholar]
- 35.Maiwald T, Timmer J. Dynamical modeling and multi-experiment fitting with PottersWheel. Bioinformatics. 2008;24:2037–2043. doi: 10.1093/bioinformatics/btn350. [DOI] [PMC free article] [PubMed] [Google Scholar]
- 36.Glass L, Kauffman SA. The logical analysis of continuous, non-linear biochemical control networks. J Theor Biol. 1973;39:103–129. doi: 10.1016/0022-5193(73)90208-7. [DOI] [PubMed] [Google Scholar]
- 37.Brown S, Vranesic Z. New York: McGraw-Hill; 2005. Fundamentals of Digital Logic with VHDL Design. [Google Scholar]
- 38.Shmulevich I, Gluhovsky I, Hashimoto RF, Dougherty ER, Zhang W. Steady-state analysis of genetic regulatory networks modelled by probabilistic boolean networks. Comp Funct Genomics. 2003;4:601–608. doi: 10.1002/cfg.342. [DOI] [PMC free article] [PubMed] [Google Scholar]
- 39.Harel D. Statecharts: a visual formalism for complex systems. Science of Computer Programming. 1987;8:231–274. [Google Scholar]
- 40.Hetherington JP, Warner A, Seymour RM. Simplification and its consequences in biological modelling: conclusions from a study of calcium oscillations in hepatocytes. J R Soc Interface. 2006;3:319–331. doi: 10.1098/rsif.2005.0101. [DOI] [PMC free article] [PubMed] [Google Scholar]
- 41.Demongeot J, Kaufman M, Thomas R. Positive feedback circuits and memory. C R Acad Sci III. 2000;323:69–79. doi: 10.1016/s0764-4469(00)00112-8. [DOI] [PubMed] [Google Scholar]
- 42.Becskei A, Seraphin B, Serrano L. Positive feedback in eukaryotic gene networks: cell differentiation by graded to binary response conversion. EMBO J. 2001;20:2528–2535. doi: 10.1093/emboj/20.10.2528. [DOI] [PMC free article] [PubMed] [Google Scholar]
- 43.Mangan S, Alon U. Structure and function of the feed-forward loop network motif. Proc Natl Acad Sci USA. 2003;100:11980–11985. doi: 10.1073/pnas.2133841100. [DOI] [PMC free article] [PubMed] [Google Scholar]
- 44.Iranfar N, Fuller D, Loomis WF. Transcriptional regulation of post-aggregation genes in Dictyostelium by a feed-forward loop involving GBF and LagC. Dev Biol. 2006;290:460–469. doi: 10.1016/j.ydbio.2005.11.035. [DOI] [PubMed] [Google Scholar]
- 45.Eichenberger P, Fujita M, Jensen ST, Conlon EM, Rudner DZ, et al. The program of gene transcription for a single differentiating cell type during sporulation in Bacillus subtilis. PLoS Biol. 2004;2:e328. doi: 10.1371/journal.pbio.0020328. [DOI] [PMC free article] [PubMed] [Google Scholar]
- 46.Sahoo D, Dill DL, Tibshirani R, Plevritis SK. Extracting binary signals from microarray time-course data. Nucleic Acids Res. 2007;35:3705–3712. doi: 10.1093/nar/gkm284. [DOI] [PMC free article] [PubMed] [Google Scholar]


