

Abstract
The N-methyl-d-aspartate receptor (NMDAR) channel is one of the major excitatory amino acid receptors in the mammalian brain. Since external Mg2+ blocks the channel in an apparently voltage-dependent fashion, this ligand-gated channel displays intriguing voltage-dependent control of Na+ and Ca2+ permeability and thus plays an important role in synaptic physiology. We found that the essential features of Mg2+ block could not be solely envisaged by binding of a charged blocker in the membrane electric field. Instead, the blocking effect of Mg2+ is critically regulated by, and quantitatively correlated with, the relative tendency of outward and inward ionic fluxes. The ‘intrinsic’ affinity of Mg2+ to the binding sites, however, is low (in the millimolar range) in the absence of net ionic flow at 0 mV. Besides, extracellular and intracellular Mg2+ blocks the channel at distinct sites of electrical distances ∼0.7 and ∼0.95 from the outside, respectively. The two sites are separated by a high energy barrier for the movement of Mg2+ (but not Na+ or the other ions), and functionally speaking, each could accommodate ∼1.1 and ∼0.8 coexisting permeating ions, respectively. Mg2+ block of the ionic flow thus is greatly facilitated by the flux-coupling effect or the ionic flow (the preponderant direction of permeant ion movement) per se, as if the poorly permeable Mg2+ is ‘pushed’ against a high energy barrier by the otherwise permeating ions. Extracellular and intracellular Mg2+ block then is in essence ‘use dependent’, more strongly inhibiting both Na+ and Ca2+ fluxes with stronger tendencies of influx and efflux, respectively. In conclusion, although permeant ions themselves could compete with Mg2+, the flow or the tendency of movement of the permeant ions may actually enhance rather than interfere with Mg2+ block, making the unique current–voltage relationship of NMDAR and the molecular basis of many important neurobiological phenomena.
Introduction
The N-methyl-d-aspartate receptor (NMDAR) plays a crucial role in many instances of neurobiological functions and dysfunctions in the mammalian brain. An important endogenous regulator of the NMDAR is extracellular Mg2+( ), which blocks the NMDAR pore in an apparently voltage-dependent manner (Mayer et al. 1984; Nowak et al. 1984) and determines the unique current–voltage relationship of NMDAR. The molecular nature of –pore interaction has been extensively investigated focusing on a classical single-ion pore-blocking model originally proposed by Woodhull (1973). However, data collected from studies for decades seem to indicate that the Woodhull model is deficient in this case. For example, the location (electrical distance) of the blocking site has been reported from 0.42 to 1.68 by different researchers with the Woodhull model (Ascher & Nowak, 1988; Mayer et al. 1989; Jahr & Stevens, 1990; Kleckner & Dingledine, 1991; Köhr et al. 1993; Strecker et al. 1994; Khazipov et al. 1995; Chen et al. 1999; Sobolevsky & Yelshansky, 2000; Sobolevskii & Khodorov, 2002; Qian & Johnson, 2006). Also, the Woodhull model predicts a linear relationship between the logarithm of dissociation constant and voltage as well as permeant ion or concentration-independent estimates of electrical distance and affinity. However, findings contradictory to the predictions have been repeatedly reported (e.g. Kleckner & Dingledine, 1991; Ruppersberg et al. 1994; Kuner & Schoepfer, 1996; Wollmuth et al. 1998a; Qian et al. 2002; Qian & Johnson, 2006). In addition, the measurement based on the Woodhull model indicates an electrical distance of 0.29–0.38 for intracellular Mg2+ (
 ; Johnson & Ascher, 1990; Li-Smerin & Johnson, 1996; Wollmuth et al. 1998b), unreasonably implying that has to overstep the blocking site of to reach its own blocking site. In this regard, it is interesting that a summed electrical distance greater than 1 (because the electrical distance denotes the location of an ionic site in the pore in terms of the percentage of total voltage drop across the membrane, the summation of the electrical distances from the inside and from the outside should not exceed 100%, or 1, for any ionic site in the pore) and the non-linear relationship between the logarithm of dissociation constant and voltage might suggest a more complex situation involving a multi-ion pore other than what the Woodhull model describes (Hodgkin & Keynes, 1955).
More recently, several researches started to consider a scenario that monovalent permeant ions could occupy one or two sites located in the external region of the NMDAR pore to prevent from binding to and unbinding from its blocking site (Antonov & Johnson 1999; Zhu & Auerbach 2001a,b; Qian & Johnson, 2006). These proposals, however, predict that the permeating ions sometimes go beyond the blocking to reach their own sites. Also, probably because some of the fundamental parameters such as the number of the permeating ions coexisting with the blocking Mg2+ in the pore, are arbitrarily assigned, the conclusions of different investigators differ in many essential points, including the location of the blocking site, the number of the coexisting permeating ions, and the location of the permeating ion sites. In this study, we demonstrate that Mg2+ block is critically dependent on the fluxes or relative tendency of inward/outward movement of monovalent permeating ions. The NMDAR currents thus are dramatically outward- and inward-rectifying in the presence of and , respectively. Although permeant ions themselves could compete with Mg2+ (e.g. Qian et al. 2002; Qian & Johnson, 2006), the flux or tendency of movement of the permeant ions may actually enhance rather than interfere with Mg2+ block, making the unique current–voltage relationship of NMDAR and the molecular basis of many important neurobiological phenomena.
Methods
Cell preparation
Animals were maintained and handled under the supervision of the National Taiwan University College of Medicine and College of Public Health Institutional Animal Care and Use Committee (IACUC). The experiments in this study comply with the policies and regulations given in Drummond (2009). The whole brain was quickly removed from a 7- to 14-day-old Wistar rat after decapitation, and cut into coronal slices (∼400 μm thickness). The slices were treated with 3 mg ml−1 protease (type XXIII; Sigma, St Louis, MO, USA) in the dissociation medium (72 mm Na2SO4, 30 mm K2SO4, 5 mm MgCl2, 5 mm Hepes and 10 mm glucose, pH 7.4) at 35°C for 3–7 min, and then transferred into the dissociation solution without protease. When cells were needed, the CA1 region was dissected from the slice and triturated with a fire-polished Pasteur pipette to release single cells for whole-cell recordings.
Whole-cell recording
The dissociated neurons were put in a recording chamber containing Tyrode solution (150 mm NaCl, 2 mm MgCl2, 2 mm CaCl2, 10 mm Hepes and 10 mm glucose, pH 7.4). Borosilicate micropipettes (O.D. 1.55–1.60 mm; Hilgenberg, Malsfeld, Germany) were pulled, fire polished and used for whole-cell recordings. In general, the pipettes had resistances of 1–2 MΩ after filling with the intracellular solution (75 mm NaCl, 75 mm NaF, 10 mm Hepes and 5 mm EGTA, pH 7.4). Seal was formed and the whole-cell configuration was established in Tyrode solution. The cell was then lifted from the bottom of the chamber and moved in front of a square-glass three-barrel tube (O.D. 0.6 mm) or a theta-glass tube (O.D. 2.0 mm, pulled to an opening of ∼300 μm in diameter; Warner Instruments, Hamden, CT, USA) to change the extracellular solution. A SF-77B perfusion system (Warner Instruments) was used for rapid solution exchange. For the square-glass three-barrel tube, 50% solution exchange time was ∼60 ms, and for the theta-glass tube, 10–90% solution exchange took ∼1.8 ms (the time constant was ≤1 ms when we fitted the fastest phase with a monoexponential function). These quantifications were done with the method described previously (Kuo et al. 2004b). The theta-glass tube was used for studying kinetics in Figs 3 and 4, and the square-glass three-barrel tube, which enables three solution conditions at a time, was used for the other experiments. The accuracy of the kinetic data was carefully checked with four lines of evidence, namely the linear correlation of macroscopic binding rate (1/τon) with the Mg2+ concentration, the simple exponential correlation of the apparent binding rate of Mg2+ (kon,app) with the membrane voltage, the superimposed y-intercepts of the linear fits to 1/τon and 1/τoff at the same given voltage (e.g. −70 or −90 mV), and the exact match between Kd,app from the kinetic and the steady-state data (see Fig. 3). On the other hand, for the change of steady-state currents (e.g. the percentage of Mg2+ block), we measured at relatively late phase (2 s) of the currents to assure steady state and to avoid the changes of current amplitude associated with the possible intrinsic voltage dependence reported by Clarke & Johnson (2008, which are mostly settled within a few tens of milliseconds at −65 to +95 mV either in the presence or in the absence of Mg2+). For those few currents which cannot reach an apparent plateau in 2 s, the current amplitude at 2 s is measured and the data are used in further analyses. The standard extracellular solution was a Mg2+-free Tyrode solution with 0.2 mm CaCl2 and 0.5 μm tetrodotoxin unless otherwise specified. When the concentration of Na+ in the intracellular or extracellular solution was lowered in an experiment, N-methyl-d-glucamine (NMG) was added to the solution to balance the ionic strength and osmolarity. The junction potential between NMG and Tyrode solutions is ∼10 mV (measured using a flowing KCl bridge), and have been corrected when the internal solution contains NMG. NMDA (1 mm) and glycine (10 μm) (Sigma) were used to elicit NMDAR currents. For detailed dissection of the flow-dependent effect on Mg2+ block, subphysiological and subsaturating concentrations of Mg2+ are used in some experiments (e.g. Figs 2–4) to increase visibility of the NMDAR currents in extreme conditions. However, dose–effect relationships are always constructed to include or to extrapolate to cover the physiological concentrations of Mg2+. The currents were recorded at room temperature (∼25°C) with an Axopatch 200A amplifier, low-pass filtered at 1–2 kHz, digitized at 100–500 μs intervals, and stored by the pCLAMP software via a Digidata-1200 interface (all from Axon Instruments, Union City, CA, USA).
Figure 3. The binding and unbinding kinetics of at different voltages with symmetrical 150 mm Na+ on both sides of cell membrane in hippocampal neurons.

A, representative currents after rapid application and wash-off of 20 μm to and from the steady-state NMDAR currents at −90 mV. The decay and recovery of currents were fitted with monoexponential functions to obtain the time constants τon and τoff (4.1 and 16.9 ms, grey lines), respectively. The initial 10% of the current change was deliberately skipped from the fitting procedure to avoid inaccuracy from incomplete solution exchange. B, the inverses of τon and τoff from A are plotted against the concentration of ([Mg2+]o). The lines are the regression fits to the data, and are of the form: 1/τon= 6.8 μm−1 s−1×[Mg2+]o+ 89.3 s−1 and 1/τoff=−0.68 μm−1 s−1×[Mg2+]o+ 89.3 s−1 at −90 mV (upper panel, n= 4–19), and are 1/τon= 2.5 μm−1 s−1×[Mg2+]o+ 78.3 s−1 and 1/τoff= 0.14 μm−1 s−1×[Mg2+]o+ 79.6 s−1 at −70 mV (lower panel, n= 8–19). The slope of the fit for 1/τoff is close to zero, consistent with the fact that τoff is unrelated to the concentrations of . Note that the regression lines for 1/τon and 1/τoff essentially converge on the same point of y-intercept at either −90 mV (89.3 vs. 89.3) or −70 mV (78.3 vs. 79.6). C, the apparent dissociation constants (Kd,app) of can also be derived from: koff,app/kon,app. koff,app and kon,app are obtained from the y-intercept and slope of the regression fits to the mean values (with errors smaller than 15% of mean, n= 3–19) of 1/τoff and 1/τon as shown in B, respectively. The derived Kd,app from kinetic data (filled squares) are plotted against membrane voltage and are very much consistent with those from direct measurement of the reduction in steady-state currents (open triangles, data from Fig. 1C). D, the kon,app are plotted against membrane voltage (n= 3–19) and fitted with a regression line of the form: kon,app= 5.6 × 10⁴m−1 s−1× e−V/18, where V is the membrane potential in mV. E, the koff,app are plotted against membrane voltage (n= 3–19). The regression lines of the data between −90 to −110 mV and between −50 to −30 mV are of the forms: koff,app= 21 s−1× e−V/65 and koff,app= 289 s−1× eV/47, respectively (see Fig. 7 for more details).
Figure 4. The binding and unbinding kinetics of block at different voltages with 150 mm extracellular and 50 mm intracellular Na+ in hippocampal neurons.

A, representative currents after rapid application and wash-off of 6.5 μm to and from the steady-state NMDAR currents at −90 mV. The decay and recovery of the currents are fitted with monoexponential functions with time constants (τon and τoff) of 4.15 and 9.73 ms, respectively. B, the inverses of τon and τoff are plotted against [Mg2+]o. The lines are best linear regression fits to the data, and are of the form: 16.5 μm−1 s−1×[Mg2+]o+ 125.7 s−1 and 1.97 μm−1 s−1×[Mg2+]o+ 128 s−1 for 1/τon and 1/τoff, respectively (n= 4–19). The very small slope for 1/τoff again indicates that τoff is insignificantly related to the concentrations of . Also, the y-intercepts of the regression lines for 1/τon and 1/τoff are essentially superimposed on each other. C and D, kon,app and koff,app are plotted against membrane voltage (n= 3–15). koff,app and kon,app are obtained from the y-intercept and slope of the regression fits to the mean values (with errors smaller than 15% of mean) of 1/τoff and 1/τon as shown in B, respectively. For comparison, the values of kon,app and koff,app in Fig. 3 are redrawn as dotted lines in the plots. The kon,app and koff,app with 150/50 mm (extracellular/intracellular) Na+ are distributed in a very similar pattern to those with 150/150 mm Na+, but are rightward shifted by ∼20–30 mV on the voltage axis. The extent of shift is reasonably close to the shift in the reversal potential (∼28 mV) for the different ionic milieu.
Figure 2. block with preponderant outward or inward current flows in hippocampal neurons.

A, the blocking effect of 100 μm is markedly reduced in preponderant outward currents (with 0 mm external and 150 mm internal Na+, upper panel). In contrast, the blocking effect is so strengthened in preponderant inward currents (with 150 mm external and 0 mm internal Na+) that 100 μm still significantly blocks the NMDAR currents even at +10 mV (lower panel). The arrows mark the ‘fixed’ direction of Na+ flow. In the outward current experiments, small ‘tail’ inward currents were present because the extracellular solution was changed to an agonist-free solution containing 150 mm Na+. B, relative currents in the presence and absence of 100 μm in different current-flow conditions (n= 3–10). The curves are the fits of the form: relative current = 1/{1 +[Mg2+]o/(4170 μm× eV/13)} and relative current = 1/{1 +[Mg2+]o/(160 μm× eV/21)} for the solution containing 150/150 mm Na+ (extracellular/intracellular) and 150/0 mm Na+, respectively. V denotes membrane potential in mV.
Expression of mRNA in Xenopus oocytes
The rat NR1 and NR2B cDNA clones were both kind gifts from Dr. Keith Williams (Department of Physiology and Pharmacology, SUNY, Brooklyn, NY, USA). The full-length capped NR1 and NR2B cRNA transcripts were synthesized using T7 and T3 mmESSAGE mmACHINE in vitro transcription kits (Ambion, Austin, TX, USA), respectively. For oocyte isolation, mature female Xenopus laevis frogs were anaesthetized in cold water containing 1.7 g l−1 of tricaine (ethyl 3-aminobenzoate methanesulphonic acid, Sigma) before the ovarian sacs were removed by surgery. After the surgery, the frogs were carefully maintained in a water tank at room temperature before wakefulness. Following the final collection of oocytes, the animals were killed by decapitation after anaesthetization. Xenopus oocytes (stages V–VI) were injected with a mixture of NR1 and NR2 cRNAs in a ratio of 1: 5 to minimize the probability of formation of homomeric NR1 receptors. Oocytes were then maintained in the culture medium (96 mm NaCl, 2 mm KCl, 1.8 mm MgCl2, 1.8 mm CaCl2, 5 mm Hepes and 50 μg ml−1 gentamycin, pH 7.6) at 18°C for 2–4 days before macropatch recordings.
Inside-out recording from oocyte macropatches
Oocytes were put in a recording chamber containing intracellular solution (130 mm NaCl, 10 mm Na2HPO4 and 5 mm EGTA, pH = 7.4). Borosilicate micropipettes were pulled, fire polished and used for macropatch recordings. In general, the pipettes had resistances of 80–200 KΩ after filling with the extracellular solution (130 mm NaCl, 10 mm Na2HPO4, 5 mm EGTA, 1 mm l-glutamate and 30 μm glycine, pH 8.6). Phosphate but not Hepes buffer was used here to increase the chance of gigaseal in the absence of fluoride ions. We found no significant difference of NMDAR currents with these two buffers. Also, the pH value of the extracellular solution was set to 8.6 to minimize the influence of proton ions and increase NMDAR currents in the oocyte macropatch. When the concentration of Na+ in the extracellular solution was lowered, NMG was added to the solution to balance the ionic strength and osmolarity. The desired total concentration of was obtained by mixing an appropriate volume of 5 mm Mg2+ intracellular solution with Mg2+-free intracellular solution, with free concentration of Mg2+ calculated by the WinMAXC software (http://www.stanford.edu/~cpatton/maxc.html). The currents were recorded at room temperature (25°C) with an Axopatch 200A amplifier, low-pass filtered at 5 kHz, digitized at 25 μs intervals, and stored by the pCLAMP software via a Digidata-1200 interface.
Data analysis
All data were expressed as mean ±s.e.m. The fittings were performed using the pCLAMP software. When the data are analysed with the concept of flux coupling, the following equations are derived from the original flux-coupling equation (Hodgkin & Keynes, 1955) based on the same rationales as those reported in Kuo & Hess (1993a,b,c); and Kuo et al. (2002):
 |
(1) |
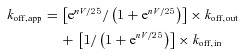
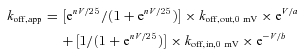
where koff,app is the apparent (composite) unbinding rate of Mg2+, and koff,out and koff,in are the rates for the blocking Mg2+ to exit externally and internally, respectively. 25 is derived from RT/F (R, gas constant; T, absolute temperature; F, Faraday constant) in mV. V is the membrane potential and n is the number of permeant Na+ ions accompanying the blocking Mg2+ (and thus regulating the movement of Mg2+) in this presumable single-file multi-ion pore region. In essence, koff,app is viewed as a weighted average of koff,out and koff,in, weighted by the relative chances of outward and inward movement of the blocking Mg2+ (which is determined by the relative chances of outward and inward Na+ fluxes, respectively, because of the coupled movement of ions; Kuo et al. 2002). In view of the possibility that the unbinding of Mg2+ could have intrinsic voltage dependence, this item is added to eqn (1), and we have:
 |
(2) |
where a and b are the parameters signalling the intrinsic voltage dependence of koff,out and koff,in, respectively. koff,out,0 mV and koff,in,0 mV are koff,out and koff,in at 0 mV. Assuming there are no additional single-file regions before Mg2+ entering this flux-coupling region, the apparent binding rate of Mg2+ (kon,app) would be dependent on the height of the energy barrier peak (ΔG) to enter the region and could be derived directly from the Eyring rate theory (k=νe−ΔG/RT, where ν denotes a pre-exponential factor). Thus, the apparent dissociation constants of Mg2+ at different voltages could also be described by an equation taking flux dependence into consideration by transforming Kd,app to koff,app/kon,app. More details of data analysis can be found in the Appendices.
Results
block is not dependent solely on voltage
Figure 1A shows 100 μm inhibition of NMDAR currents with 150 mm Na+ in both extracellular and intracellular solutions. The blocking effect of is apparently voltage dependent. The inhibitory effect is very prominent at −70 mV but dramatically reduced with membrane depolarization, and becomes negligible at −30 to −10 mV. Figure 1B compares concentration-dependent inhibition at different membrane potentials. The concentration-dependent effect at each given voltage could be satisfactorily fitted by a one-to-one binding curve (see the legend), consistent with a bimolecular reaction between and the NMDAR pore. With regular 20 mV steps from −130 mV to −30 mV, the ‘shift’ between each two binding curves is not constant but gradually and monotonically increased toward more positive potentials (Fig. 1B), making the non-linear relationship between the logarithm of the apparent dissociation constant of and membrane voltage in Fig. 1C. The upward deflecting curvilinear feature in Fig. 1C indicates that at more positive potentials the increase of the apparent dissociation constant of becomes more substantial than that predicted by the Woodhull model (i.e. linear relationship between the logarithm of dissociation constant and voltage), strongly suggesting that the apparent voltage-dependent blocking effect of cannot be solely ascribed to the effect of membrane electrical field on a charged particle (). In other words, there is another factor which becomes more and more influential on the apparent efficacy of block with the increment of membrane voltage from −130 to −30 mV. A potential candidate for such a factor is the relative proportion of Na+ influx and efflux, since Na+ influx presumably predominates at −130 mV, but becomes less so (with an increasing tendency of Na+ efflux) when the membrane is more depolarized.
Figure 1. Extracellular Mg2+  block of the NMDAR channel with symmetrical 150 mm Na+ on both sides of cell membrane in hippocampal neurons.

A, representative NMDAR currents in the absence (grey lines) and presence (black lines) of 100 μm at different voltages (indicated on the top of the currents). B, inhibition of NMDAR currents by 1–1000 μm of (n= 3–14). Relative steady-state currents in the presence and absence of are plotted against the concentration of ([Mg2+]o) on a semilogarithmic scale. The curves are the fits of the form: relative current = 1/[1 + ([Mg2+]o/Kd,app)], where Kd,app stands for the apparent dissociation constant of , and is 583.0, 94.5, 26.3, 8.6, 4.5 and 2.9 μm at −30, −50, −70, −90, −110 and −130 mV, respectively. Note that the ‘shift’ between two adjacent curves in the plot is not constant but gradually increased toward more positive potentials. C, the mean values (taken from B) of Kd,app of at different voltages are plotted on a semilogarithmic scale. We connected every two points with a straight line by hand. The slopes of the lines are evidently shallower toward more negative potentials.
block of the NMDA currents shows marked flow dependence
In view of the potential role of Na+ fluxes, we studied the blocking effect of on the NMDAR currents with two more different ionic milieu, namely 0 mm extracellular Na+/150 mm intracellular Na+ and the reverse (upper and lower panels of Fig. 2A, respectively). The Na+ currents thus would be ‘purely’ outward or inward irrespective of membrane potential. Figure 2A shows that at the same voltage (e.g. −10, −30 or −50 mV), 100 μm produces little inhibition when there is ‘pure’ outward flux, but very prominent inhibition when there is pure inward flux. The apparent voltage dependence of block thus is significantly different in these conditions compared to that with 150 mm symmetrical Na+ (see Fig. 2B). For example, the apparent dissociation constants at 0 mV are ∼4.1 mm and ∼0.16 mm, and change e-fold per 13 mV and 21 mV for the solutions containing symmetrical 150 mm Na+ and 150 mm extracellular Na+/0 mm intracellular Na+, respectively. These findings strongly support the idea that the blocking effect of is Na+ flow dependent, being stronger with more preponderant inward flux (preponderant inward direction of Na+ movement). It should be noted that we deem Na+ fluxes in a broad sense here. Even in the blocked channel, the movement of the blocking Mg2+ is significantly influenced or ‘regulated’ by the preponderant direction of Na+ movement (the direction of the broad-sense ‘Na+ fluxes’, although no Na+ currents happen because of Mg2+ block). This broad-sense meaning of ‘ion fluxes’ in the blocked channel thus may be close to the effect represented by the Na+ fluxes in the unblocked channel comprising the macroscopic currents. On the other hand, the intrinsic affinity between and the NMDAR pore is not high. The apparent dissociation constant (binding affinity) of is only 4.1 mm in the absence of influences from membrane voltage and ion fluxes (symmetrical 150 mm Na+, 0 mV), and would be still larger in the presence of net outward ion fluxes even at quite negative membrane potentials (e.g. −70 mV and 0 mm extracellular Na+/150 mm intracellular Na+, Fig. 2A).
There are opposite signs of voltage dependence of unbinding kinetics in different voltage ranges
To dissect the nature of the dramatic changes in the apparent affinity of with different directions of Na+ current flow, we measured the binding and unbinding kinetics of in symmetrical 150 mm Na+ at different membrane voltages (Fig. 3). The macroscopic binding rates are always linearly correlated with, whereas the unbinding rates are essentially unrelated to, the concentration of (Fig. 3B). Consistent with a simple bimolecular, one-to-one binding reaction, the y-intercepts of the linear regression fits to the binding and unbinding rate are always superimposed with each other. We also derive the apparent dissociation constants from the ratio of the apparent unbinding and binding rates at each voltage, and compare the data with those obtained with a direct steady-state approach in Fig. 1C. Figure 3D and E plot the voltage dependence of the apparent binding rates (kon,app) and unbinding rates (koff,app). The binding rates increase monotonously from −30 to −110 mV (e-fold change per 18 mV, or an apparent electrical distance of ∼0.69 for , Fig. 3D), indicating that not only the blocking site, but the major energy barrier for (to flow downstream with the net Na+ influx) to approach the blocking site, is located quite deeply into the pore. On the other hand, the unbinding rates decrease with increasing membrane hyperpolarization between −40 to −60 mV, but increase with increasing hyperpolarization between −90 to −120 mV with a nadir value at around −80 mV (Fig. 3E). These findings not only support the idea that could actually ‘permeate’ through the channel pore with the aid of strong hyperpolarization (Wollmuth et al. 1998a; Stout et al. 1996; see also the ‘permeation’ of the blocking external spermine through the non-NMDAR channel pore with strong hyperpolarization, Bähring et al. 1997), but also indicate that there are asymmetrical energy barriers flanking the blocking site for Mg2+ to exit externally and internally (see Appendices and Discussion for details).
The shift of voltage dependence of the binding and unbinding kinetics of correlates closely with the shift of reversal potential
We also studied the binding and unbinding kinetics of in a different ionic milieu, 150 mm extracellular and 50 mm intracellular Na+ (Fig. 4). The macroscopic binding rates are again linearly correlated with, whereas the unbinding rates are unrelated to, concentration (Fig. 4B). Also, the intercepts of linear regression fits to the binding and unbinding rate data are superimposed on each other. The voltage dependences of both kon,app and koff,app remain very similar to that in Fig. 3D and E, but are ‘shifted’ in the depolarizing direction on the voltage axis (Fig. 4C and D). The shift of the voltage dependence of koff,app (in view of the apparent nadirs) between Figs 3E and 4D is close to the shift of reversal potential (∼28 mV). On the other hand, the voltage dependence of kon,app shows a shift of ∼20 mV, slightly smaller than the shift of reversal potential between the two different ionic conditions in Figs 3 and 4. This could be due to the significant intrinsic voltage dependence of kon,app (see Discussion). The close correlation between the shift in voltage dependence of kinetics and the reversal potential of Na+ further demonstrates the decisive role of ion fluxes in the molecular mechanism underlying block in the NMDAR pore.
Current flow also influences  block
block
It is well known that is also a pore blocker of the NMDAR channel. If could actually be a permeant blocker at relatively hyperpolarized potentials (Fig. 3E), it would be interesting to explore the molecular actions of block so that the entire energy profile of Mg2+ across the NMDAR channel pore may be envisaged. To facilitate the solution exchange on the intracellular side, we took excised inside-out macropatches from Xenopus oocytes expressing large amounts of wild-type NR1–NR2B receptors, which constitute the majority of NMDA receptors on the 7- to 14-day-old hippocampal neuron. In this case the NMDAR currents tended to show features of weak inward rectification in cell-attached patches, presumably due to the blocking effects of endogenous polyamines or because the rectification could disappear after the patches were excised from the oocyte. All experiments were therefore carried out only after the endogenous blockers had been dissipated (judged by the disappearance of rectification). Figure 5A and B show that in the presence of symmetrical 150 mm Na+, application of produces only slight inhibition of inward currents (i.e. at negative potentials) but substantial inhibition of outward currents (i.e. at positive potentials). To differentiate the effect of membrane voltage from ion flow, we repeated the same experiments with 0 mm extracellular Na+/150 mm intracellular Na+ (Fig. 5C and D). It is evident that always has more pronounced inhibitory effect with 0 mm than with 150 mm extracellular Na+ (when keeping the same 150 mm intracellular Na+ in both cases) at the same voltage range (Fig. 5E). Moreover, the blocked currents tend to increase slightly at extremely positive potentials (e.g. at 90 to 100 mV, Fig. 5C and D). These findings indicate that block of the NMDA channel is also critically dependent on the relative tendency of Na+ ions to move outward or inward, and that may also permeate through the pore with the aid of very positive membrane potentials.
Figure 5. Flow dependence of intracellular Mg2+ () block.

A, an inside-out patch of an oocyte expressing NMDAR channels was first held at 0 mV and stepped to a pre-pulse of −100 mV, and then to test pulses of different voltages from −100 to +100 mV in 10 mV increments. With symmetrical 150 mm Na+ on both sides of the cell membrane, NMDAR currents elicited at more positive voltages are readily blocked by 716 μm of intracellular Mg2+ (middle traces), an effect readily reversible by washing out Mg2+ (right traces). B, the I–V (current–voltage) curve in the absence and presence of 716 μm from the data in A. C, the experimental protocols are the same as those in A, except that the patch was held at −40 mV with 0 mm extracellular/150 mm intracellular Na+. The inset shows the magnification of current traces elicited at +40 to +100 mV. Note the paradoxical increase of current amplitude at +90 to +100 mV, as if the block is relieved at these strong positive membrane potentials. D, the I–V curve in the absence and presence of 716 μm from the data in C. E, the blocking effect of 716 μm (n= 3–37) with symmetrical 150 mm Na+ and with 0 mm extracellular/150 mm intracellular Na+ are compared over membrane voltages. The relative current is defined as the ratio of the currents with and without 716 μm.
The blocking site is located at the internal pore mouth
The apparent dissociation constants of binding to the NMDAR channel pore are measured from the dose–response curves in symmetrical 150 mm Na+ at different membrane voltages (Fig. 6). The ‘shifts’ between each two adjacent dose–response curves are gradually and monotonously lengthened toward less positive potentials, and the curves examined at positive voltages and those at negative voltages can be easily sub-grouped by the extent of shift, making a curvilinear or non-linear relationship between the logarithm of apparent dissociation constants of and membrane voltages (Fig. 6B). This is reminiscent of the case of (Fig. 1). The kinetics of block are so fast that no flickering events can be observed in single channel recordings (Johnson & Ascher, 1990; Li-Smerin & Johnson, 1996). Therefore, it could be difficult to determine the binding and unbinding rates of as in the case of . Instead, the apparent dissociation constant in preponderant outward currents (0 mm extracellular Na+/150 mm intracellular Na+) were estimated between +50 and −50 mV and plotted with those in symmetrical Na+ for comparison (Fig. 6B). The data in 0 mm extracellular and 150 mm intracellular Na+ show linear voltage dependence with the same slope (i.e. e-fold change per 42 mV) as the data with symmetrical 150 mm Na+ between +30 and +100 mV (where there is presumably also preponderant outward ion flux). If one neglects the influence of ionic flow, the observed voltage dependence (i.e. e-fold change per 42 mV) would locate the blocking site at an electrical distance of ∼0.3 (from inside), which would unreasonably put the blocking site of external to that of . On the other hand, one may readily locate the site to the internal pore mouth (i.e. electrical distance < 0.1, see Appendices) with the flux-coupling effect taken into consideration.
Figure 6. block at different voltages with symmetrical 150 mm Na+ on the extracellular and intracellular sides of the oocyte expressing NMDAR channels.

A, the relative currents with different concentrations of are examined at different membrane voltages. The relative current is defined as that in Fig. 1. The lines are the best fits of the form: relative current = 1/[1 + ([Mg2+]i/Kd,app)], where Kd,app stands for the apparent dissociation constant of (n= 5–37). The filled circles and continuous lines mark the data examined at positive membrane voltages, and the open circles and dashed lines mark those at negative voltages. B, the mean values of the Kd,app obtained from the fitting results in A are plotted against membrane voltages (filled and open circles for the data examined at positive and negative membrane voltages, respectively), showing evident non-linear relationship with symmetrical 150 mm Na+. The continuous line is an arbitrary regression line, Kd,app= 5210 μm× e−V/42, which fits the data from +30 to +100 mV to show a trend of the voltage dependence. Note the evident deviation of the data examined at negative voltages from the continuous line. The dotted line marks the data by a simplified calculation of Kd,app from: relative current = 1/[1 + (716 μm/Kd,app)], where the values of the relative currents are from the data of 716 μm in A, and shows very similar results to the more accurately measured Kd,app described above (i.e. the circles). In this regard, the apparent dissociation constants of calculated from: relative current = 1/[1 + (716 μm/Kd,app)] with 0 mm Na+/150 mm Na+ are also plotted against membrane voltages for comparison (cross symbols). The dashed line is the regression fit of the latter set of data from −50 to +50 mV, and is of the form: Kd,app= 1141 μm× e−V/41. V is the membrane potential in mV.
Discussion
It has been a long debate as to whether the NMDAR channel pore could contain only one ion (a single-ion pore: Jahr & Stevens, 1993; Zarei & Dani, 1994) or multiple ions (a multi-ion pore: Antonov et al. 1998; Antonov & Johnson, 1999; Zhu & Auerbach, 2001a,b; Qian et al. 2002; Qian & Johnson, 2006) at a time. In this study, we demonstrate that the blocking effects of both and are closely correlated with current flow (the relative tendency of permeant ions to move outward or inward), a novel phenomenon indicating the existence of flux-coupling or coupled movement of ions in the single-file region and thus simultaneous occupancy of NMDAR channel pore by multiple ions (Hodgkin & Keynes, 1955; Heckmann, 1972; Schumaker & MacKinnon, 1990). The existence of a single-file region associated with a flux-coupling blocking phenomenon and/or consequent high apparent charges of the blocker is reminiscent of the cases of inward rectifier K+ channels blocked by intracellular polyamines (Matsuda et al. 1987; Lopatin & Nichols, 1996; Guo et al. 2003; Shin & Lu, 2005; Shin et al. 2005; Kurata et al. 2007).
We provide an energy profile (based on quantitative analysis of the data with the flux-coupling equation, Appendix A and Fig. 7) and a novel mechanistic insight into the apparent voltage dependence of Mg2+ block in the NMDAR channel pore (Appendix B and Fig. 8). There are at least two short single-file multi-ion regions in the pore. The single-file region responsible for block is located at an electrical distance ∼0.73 from outside and that responsible for block is located right at the internal pore mouth. Functionally speaking, the blocking and could be coupled to ∼1.1 permeating Na+ and ∼0.8 Na+, respectively (Fig. 7A and C). Although these numbers of the coupling permeating Na+ ions may satisfactorily recapitulate some of the other experimental findings (e.g. Fig. 7B), they should be interpreted cautiously and viewed as only rough estimates considering the inherent inaccuracy or errors associated with the fits from a statistical point of view. Moreover, the fit to the functional data would, in theory, provide an estimate of the number of permeating Na+ ions accompanying the blocking Mg2+ ions for the condition of completely coupled movement between or among Na+ and Mg2+ in the single-file region. If the coupling is not complete because, for example, the energy barriers between the ionic sites in this single-file region are not low enough (Hille & Schwarz, 1978), then there may be higher numbers of permeating Na+ ions (higher than the foregoing estimates) actually accompanying the blocking Mg2+ ion. We therefore do not intend to make any conclusive statement on the number of the Na+ ions in the single-file regions responsible for the flow-dependent effects of and on the NMDAR channel; nevertheless, the relatively small number of the coupling Na+ ions from the fit might be reminiscent of the proposal that the NMDAR pore could hold only one dimethyl ammonium ion, a much larger ion than Na+, at a time (Zarei & Dani, 1994;Villarroel et al. 1995). In comparison, spermine block of the inward rectifier K+ channel seems to be achieved with a larger number of the accompanying permeating K+ ions and/or the involved single-file regions (Guo et al. 2003; Shin et al. 2005; Kurata et al. 2007), and thus an even more prominent rectification phenomenon associated with the changes of current flow direction.
Figure 7. Analysis of the data with the concept of flux coupling.

See details in Appendix A. A, the data are from Fig. 3E and fitted by eqn (3) (Appendix A). The best fitting line (the thick continuous line) gives 1.12 and 690 s−1 for n and koff,out,0 mV, respectively. For comparison, the thin, thick dashed, and dotted lines are the fits of eqn (3) with the assigned n values of 0.5, 1 and 2, respectively. B, the data are from Fig. 3C. The line is a derived result based on calculations using eqn (4) and n= 1.12 (see Appendix A for details). C, the data are from Fig. 5E with symmetrical 150 mm Na+. The thick continuous line is the best fit of the data with eqn (5) (Appendix A), giving 0.8, 150 μm and 10 800 μm for n, koff,out,0 mV/kon, and koff,in,0 mV/kon, respectively. The thin, thick dashed, and dotted lines are the fits of eqn (5) with the assigned n values of 0.5, 1 and 2, respectively.
Figure 8. The energy profile of Mg2+ in the NMDAR channel pore and simulations of the electrophysiological consequences.

A, the energy profile of Mg2+ in the NMDAR channel pore. See Appendix B for the detailed rationales of derivation. The external and the internal Mg2+ binding regions both presumably have 2–3 ion binding sites, separated by energy barriers low enough to sustain partially-coupled but high enough to interfere with completely-coupled movement of ions in this region. B, recapitulation of the composite off rates of the blocking at different voltages. Based on the energy profile in A, the hypothetical outward and inward off rates considering only intrinsic voltage dependence are calculated (dashed lines). More realistic outward and inward off rates are derived with the additional considerations of flow dependence (with n= 1.12, continuous lines). The apparent off rates of the blocking predicted by the model are thus the sum of the two continuous lines (i.e. the thick line, which is identical to the thick line in Fig. 7A, the best fit of the experimental data from Fig. 3E). C, the contribution of flux coupling to blocking effect at different membrane voltages. In the inset, the continuous line is from Fig. 7B (with flux coupling taken into consideration), and the dashed line is the calculated dissociation constants if one considers only the intrinsic voltage dependence of the blocking site but not flux coupling (the experimental data point at −30 mV, i.e. 0.58 mm, is taken from Fig. 3C as a reference point for the calculation and presentation). The blocking effect of 1 mm (roughly the physiological concentration in human cerebrospinal fluid) is then derived based on the Kd,app values from the two lines in the inset according to a simple bimolecular (one-to-one binding) reaction. The remaining current after Mg2+ block is normalized to the current elicited at +100 mV (in the absence of Mg2+) to give the relative current (the y-axis), which is then plotted against membrane voltage. The grey filled circles (connected by continuous lines) and the black filled circles (connected by dashed lines) show the data in the presence and the absence of flux coupling, respectively. The dotted line denotes the current in the absence of Mg2+. D, the normalized conductance is also derived form the Kd,app values in C and plotted against membrane voltage. The curves are fitted with a Boltzmann function and are 1/[1 + e(−22.6−V)/18.1] and 1/[1 + e(−18.8−V)/12.3] in the absence (equivalent ‘gating charges’= 25/18.1 = 1.4, black filled circles, dashed lines) and presence (equivalent ‘gating charges’= 25/12.3 = 2.0, grey filled circles, continuous lines) of flux coupling, respectively. V is membrane potential in mV. E, the normalized conductance–voltage relationship is plotted as that described in D, but the number (n) of Na+ accompanying Mg2+ in the single file region is differently assigned (assuming complete coupling between or among Na+ and Mg2+). The curves are the fits with a Boltzmann function with V1/2 values of −27.1, −18.8, −18.0, −14.7 and −12.5, and k values of 14.8, 12.3, 10.0, 8.4 and 7.6 (and thus equivalent ‘gating charges’ of 1.7, 2.0, 2.5, 3.0 and 3.3) for n= 0.5, 1.12 (data from D), 2, 3 and 4, respectively.
Our results indicate that and block the NMDAR channel pore at distinct sites separated by a high barrier, which deters movement of Mg2+ with fluxes of the other ions and thus plays an essential role in the mechanism of Mg2+ block (Fig. 8A). The barrier, however, is not wide in terms of electrical distance (only ∼0.2 between the two sites). It should be noted that electrical distance may be quite disproportional to actual distance, because, for example, it is a possibility that the majority of voltage drop in open channels is across the selectivity filter. In this regard, it is interesting to note that point mutations of the highly conserved asparagines in the M2 segment of the NR2 subunit (the ‘N site’ and the ‘N+1 site’) have been reported to significantly reduce the blocking effect of both and on the NMDAR channel (Burnashev et al. 1992; Mori et al. 1992; Sakurada et al. 1993; Wollmuth et al. 1998a). Moreover, mutations of residues 5 to 7 positions downstream of the N-site in either NR1 or NR2 clearly influence but not block, whereas mutations of the first 2 residues downstream of or a tryptophan residue upstream of the N-site affect mostly block (Kupper et al. 1998; Williams et al. 1998). Although it is always hard to correlate electrical with physical distances, these findings from mutant channels, together with the foregoing relatively short electrical distance of ∼0.2, may support the view that the and blocking sites are separated by only a short distance, both physically and electrically. This short distance, however, represents a high energy barrier to prevent the permeation of Mg2+ (but not Ca2+).
In the case of the voltage-gated Ca2+ channel (where monovalent currents are readily blocked by alkali earth or transitional metal ions), the multivalent ion block of monovalent ion permeation is ascribable to the much higher affinity of the multivalent ion to the pore with its larger charge density and/or more favourable electronic configuration (Almers et al. 1984; Hess & Tsien, 1984; Hess et al. 1986; Kuo & Hess, 1993a,b,c;). The Ca2+-permeable NMDAR channel, however, seems to adopt a very different strategy. Mg2+ does not have a high intrinsic affinity to the channel, as shown by the millimolar dissociation constants of either or (Figs 1 and 6, consistent with the previous reported Kd or IC50 of 1.7–8.8 mm for (Ascher & Nowak, 1988; Köhr et al. 1993; Khazipov et al. 1995) and 4–8 mm for (Johnson & Ascher, 1990; Wollmuth et al. 1998b; Li-Smerin & Johnson, 1996). As illustrated by the energy profile of Mg2+ in the NMDAR channel pore (Figs 7 and 8A), Mg2+ most probably makes an effective pore blocker when and only when it is ‘forced’ to move forward by flux coupling in front of a high barrier for its permeation (the different availability of the forward and backward sites in the single-file region would ‘force’ the blocking Mg2+ to go in the direction of Na+ flux until the Mg2+ is ‘held’ in front of a large barrier. However, the blocking Mg2+ should not be really ‘held’ motionless. For example, it may still have a relatively small chance of successfully leaving the flux-coupling region with backward movement). This flow dependence of block is reminiscent of the effects of Na+ flow on multivalent cation block of tetrodotoxin-resistant Na+ channels (Kuo et al. 2002, 2004a), and K+ flow on Mg2+ or spermine block of the Kir 2.1 channel (Shin & Lu, 2005; Shin et al. 2005), and is shown by the dramatically different blocking effects in different directions of current flow (Fig. 2) as well as the correlative shift of the voltage dependence of koff,app to the shift in reversal potentials (Fig. 4). Mg2+ block of the NMDAR thus is in essence use dependent. inhibition of the currents consequently would be stronger with a stronger tendency of ionic influx, and could be therefore use dependent. Mg2+ block of NMDAR should be more appropriately characterized by the concomitant flux-coupling effect than by the voltage-dependent steady-state occupancy and consequent access- or exit-prevention effect alone (Antonov & Johnson, 1999; Zhu & Auerbach, 2001a). Ca2+, an alkali earth ion other than Mg2+, is a permeant ion, or more precisely, a permeant blocker rather than just a blocker of the NMDAR. As compared to Mg2+, Ca2+ does not seem to have a much higher affinity to the NMDAR channel than Na+ either, because the permeability ratio between Ca2+ and Na+ is only ∼3.6–10.6 (Mayer & Westbrook, 1987; Ascher & Nowak 1988; Tsuzuki et al. 1994; Burnashev et al. 1995), and it may take more than 10 mm Ca2+ to halve the Na+ currents (Ascher & Nowak, 1988; Y.-C.Y., C.-H.L., and C.-C.K. unpublished data). We found that the flow dependence of the Mg2+ blocking effect remains very similar in the presence of physiological extracellular concentrations (i.e. 2 mm) of Ca2+ (Y.-C.Y., C.-H.L., and C.-C.K. unpublished data). The different behaviours of Ca2+ and Mg2+ in the NMDAR channel thus are most probably ascribable to different energy barriers they face when crossing the pore (Fig. 8A) rather than to different binding affinity (as in the cases in voltage-gated Ca2+ channels). These differences may also readily explain why Mg2+ effectively blocks Ca2+ permeation in the NMDAR channel but not in the voltage-gated Ca2+ channel. Conventionally, the Q/R/N site has been regarded as the key structure controlling the permeation and block of Ca2+ and Mg2+, respectively (Burnashev et al. 1992, 1995), whereas Na+ and the other monovalent ions were assumed to bind to the same site to decrease Mg2+ block or to the other more peripheral sites in the pore to deter the binding and/or unbinding of Mg2+ (Qian et al. 2002; Qian & Johnson, 2006). However, it was noted more recently that the DRPEER motif, a pore segment enriched with charged residues in the extracellular vestibule of the NMDA receptor, may also contribute to the differential affinity between Na+ and Ca2+ to the channel, although external Ca2+ may well permeate through this region before it reaches the foregoing Q/R/N site (Watanabe et al. 2002). It would be interesting to characterize which motif is related to the single-file region responsible for external Mg2+ block.
In summary, the flux-coupling effect and the inward monovalent currents through the NMDAR channel in physiological conditions therefore not only serve to depolarize the membrane, but also play an essential mechanistic role in the genesis of Mg2+ block by ‘pushing’ Mg2+ against a high energy barrier. In this regard, the inward monovalent flux may also contribute to Ca2+ influx by pushing it to cross a permeation barrier which is not high. Also, the weaker blocking effect of observed in the epileptic (kindled) or kainic acid-lesioned rat (apparent dissociation constant 12–52 mm: Köhr et al. 1993; Chen et al. 1999) may not be necessarily ascribed to changes in the binding sites or barrier for , but is equally possible due to changes in the movement of the Na+ accompanying the blocking in the long pore region. On the other hand, in physiological conditions (i.e. in the presence of millimolar ), the NMDAR channel has a characteristic rectification with ‘negative slope conductance’ in the current–voltage relationship because of Mg2+ block of the open channel pore (e.g. Fig. 8C). We have seen that the flux-coupling effect significantly modulates the apparently voltage-dependent block. Given the same intrinsic voltage dependence, there will be stronger blocking effects in the presence than in the absence of flux coupling as the membrane potential gets more negative (Fig. 8C). The change in the blocking effect of , and consequently the change of the amplitude of the inward Na+ and Ca2+ currents with the same voltage change, e.g. from resting (∼ −70 mV) to mildly depolarized potentials (e.g. −20 mV), thus would be larger in the presence than in the absence of flux coupling. Functionally speaking, this is as if the NMDAR has more apparent ‘gating charges’ (Fig. 8D), which could be correlated with the number of the co-existing monovalent ions in the pore (especially when looking at the difference of the ‘gating charges’ in the absence and presence of flux coupling; Fig. 8E). This increase in apparent ‘gating charges’ due to flux coupling would make the ionic conductance of the NMDAR channel more voltage dependent and thus more readily turned off and turned on at more negative and positive membrane potentials, respectively. The Na+ and Ca2+ influxes which are of great physiological and pathological concern are then more effectively controlled by the local status of membrane excitation.
Acknowledgments
This work was supported by the National Science Council, Taiwan, Grant NSC97-2320-B-002-039-MY3 (to C.-C.K.) and Grant NSC97-2311-B-182-005-MY2 (to Y.-C.Y.), by the National Health Research Institutes, Taiwan, Grant NHRI-EX98-9606NI (to C.-C.K.), and by the Chang Gung Hospital, Taiwan, Medical Research Project CMRPD170451 (to Y.-C.Y.).
Glossary
Abbreviations
- kon,app
apparent binding rate of Mg2+
extracellular Mg2+
intracellular Mg2+
- NMDAR
N-methyl-d-aspartate receptor
- NMG
N-methyl-d-glucamine
Appendix A
Data analysis with flux coupling taken into consideration
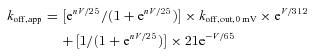
As there is preponderant Na+ influx at −90 to −110 mV in Fig. 3, the effect of current flow most probably is ‘saturated’. The change of koff,app from −90 to −110 mV thus should be mainly ascribable to the intrinsic voltage dependence of koff,in. One may then have koff,in,0 mV= 21 s−1 and b= 65 mV by fitting the data in Fig. 3E (−90 to −110 mV) with eqn (2) (see Methods). According to the energy profile in Fig. 8A, we will have a= 312 mV (electrical distance = 0.04, see below). Thus there are essentially only two free parameters, n and koff,out,0 mV, remaining in eqn (2), and the equation becomes:
 |
(3) |
Fitting the other koff,app data in Fig. 3E with eqn (3), we have 1.12 and 690 s−1 for n and koff,out,0 mV, respectively (Fig. 7A, see also Fig. 8B), and thus
 |
(4) |
The apparent dissociation constants of at different voltages in Fig. 3C could also be derived from Kd,app() =koff,app/kon,app (Fig. 7B). In this case, koff,app can be obtained from eqn (4) and kon,app equals 5.6 × 10⁻² exp−V/18 (see Fig. 3D).
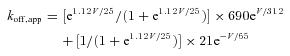
To describe the apparent dissociation constants of at different voltages (Fig. 7C), we assume the intrinsic voltage dependence of 312 mV (electrical distance = 0.04) for both koff,out and koff,in (see also the energy profile in Fig. 8A). Moreover, we assume no intervening single-file ionic sites in such a small electrical distance for the sake of simplicity (and consequently negligible intrinsic voltage and flow dependence of kon,app of , see Fig. 8A). Thus,
 |
(5) |
The best fit of the data in Fig. 5E with eqn (5) gives n= 0.8, koff,out,0 mV/kon= 150 μm and koff,in,0 mV/kon= 10 800 μm (see Fig. 7C). We found that the data could not be well described if the difference between koff,out/kon and koff,in/kon is smaller than ∼70-fold (10800/150). Thus, the ∼70-fold difference between koff,in/kon and koff,out/kon may represent a lower limit. If one does not make the foregoing assumptions for block, but only took the remaining electrical field < 0.12 into account, the basic features of the results would remain the same.
Appendix B
The energy profile of Mg2+ in the NMDAR channel pore and the contribution of flux coupling to the blocking effect at different voltages
With a simple 3-peak–2-well energy profile (see Fig. 8A) for and block of the NMDAR channel pore, an electrical distance of 0.19 between the external well and the central peak is assigned according to b= 65 mV in eqn (2) (Appendix A). As the change of kon,app of from −30 to −100 mV most probably is ascribable to the intrinsic voltage dependence of kon (i.e. the inward flux is preponderant and thus flow dependence is probably ‘saturated’ in these situations), the apparent voltage dependence (e-fold change per 18 mV, Fig. 3D) would therefore signal an electrical distance of 0.69 between the external peak and the external bulk solution. As the remaining electrical distance is small (1 − 0.19 − 0.69 = 0.12), we divide it into three equal parts (0.04 each) for the remaining three segments in the 3-peak–2-well model (assuming no electric distance between the internal peak and the internal bulk solution). This assumption is arbitrary but seems to be appropriate because similar fitting results can be obtained if 0.12 is not so equally subdivided. Based on the Eyring rate theory, the height of the external energy barrier peak (ΔG) is derived from kon,app= 5.6 × 10⁴ M−1 s−1× e−V/18 in Fig. 3D, and a pre-exponential factor set to 109 s−1 (Kuo & Hess, 1993c). We have mentioned that the kon,app and koff,app of are 5 to 10 times smaller in this study than those previously reported with single-channel recordings (because of prohibition of the entry and exit of to and from the activated NMDAR channel pore by the closure of the desensitization gate). The energy peak derived from the kinetics of here thus may be an overestimate, probably 1–2 RT higher than its actual value where only the interactions between and the open channel pore is considered. The energy difference between external barrier peak and the external Mg2+ binding region is derived from koff,out,0 mV= 690 s−1 (eqn (4), Appendix A). The energy difference between the external Mg2+ binding region and the central barrier peak are calculated from koff,in,0 mV= 21 s−1 (Appendix A). The depth of the internal Mg2+ binding region is calculated from koff,in,0 mV/kon= 10800 μm (Appendix A). The energy difference between the central barrier peak and the internal one is obtained from the ∼70-fold difference between koff,out/kon and koff,in/kon of (Appendix A). We do not have enough kinetic data on the action of to clearly define the internal energy barrier, which is thus depicted with dotted lines in the energy profile (Fig. 8A). The dotted wells (Fig. 8A) denote the possible existence of another single-file multi-ion region at or near the external pore mouth, responsible for the dramatically reduced blocking effect of in outward currents (Fig. 2) and the slight deviation of binding rates from the linear correlation at ∼ −30 mV (Fig. 3D). This is consistent with the findings that the first ionic site in the NMDAR pore from the outside is probably located at or near the external pore mouth and co-localized with the anticonvulsant felbamate binding site (Chang & Kuo, 2007, 2008). The contribution of flux coupling to the blocking effect at different membrane voltages could then be derived (Fig. 8C). It is evident that there is more block at voltages negative to −30 mV, but less block at voltages positive to −30 mV in the presence (grey filled circles, Fig. 8C) than in the absence (black filled circles, Fig. 8C) of flux coupling. The flux coupling between and the other permeating ions thus may play an important role in the physiologically critical and unique feature of block of the NMDA channel, making stronger block at the resting membrane potential (e.g. −70 mV) but weaker block when the membrane is moderately depolarized (e.g. −10 mV). Assuming a simple bimolecular reaction, the normalized conductance–voltage relationship could then be derived from the Kd,app values in Fig. 8C, with the number (n) of Na+ accompanying Mg2+ in the pore differently assigned (Fig. 8D and E).
Author contributions
C.-C.K. conceived the study. Y.-C.Y., C.-H.L. and C.-C.K. were all involved in the conception, interpretation and analysis of the data. All authors participated in drafting the manuscript and approved the final version for publication.
References
- Almers W, McCleskey EW, Palade PT. A non-selective cation conductance in frog muscle membrane blocked by micromolar external calcium ions. J Physiol. 1984;312:159–176. doi: 10.1113/jphysiol.1984.sp015351. [DOI] [PMC free article] [PubMed] [Google Scholar]
- Antonov SM, Gmiro VE, Johnson JW. Binding sites for permeant ions in the channel of NMDA receptors and their effects on channel block. Nat Neurosci. 1998;1:451–461. doi: 10.1038/2167. [DOI] [PubMed] [Google Scholar]
- Antonov SM, Johnson JW. Permeant ion regulation of N-methyl-D-aspartate receptor channel block by Mg2+ Proc Natl Acad Sci U S A. 1999;96:14571–14576. doi: 10.1073/pnas.96.25.14571. [DOI] [PMC free article] [PubMed] [Google Scholar]
- Ascher P, Nowak L. The role of divalent cations in the N-methyl-d-aspartate responses of mouse central neurones in culture. J Physiol. 1988;399:247–266. doi: 10.1113/jphysiol.1988.sp017078. [DOI] [PMC free article] [PubMed] [Google Scholar]
- Bähring R, Bowie D, Benveniste M, Mayer ML. Permeation and block of rat GluR6 glutamate receptor channels by internal and external polyamines. J Physiol. 1997;502:575–589. doi: 10.1111/j.1469-7793.1997.575bj.x. [DOI] [PMC free article] [PubMed] [Google Scholar]
- Burnashev N, Schoepfer R, Monyer H, Ruppersberg JP, Gunther W, Seeburg PH, Sakmann B. Control by asparagine residues of calcium permeability and magnesium blockade in the NMDA receptor. Science. 1992;257:1415–1419. doi: 10.1126/science.1382314. [DOI] [PubMed] [Google Scholar]
- Burnashev N, Zhou Z, Neher E, Sakmann B. Fractional calcium currents through recombinant GluR channels of the NMDA, AMPA and kainate receptor subtypes. J Physiol. 1995;485:403–418. doi: 10.1113/jphysiol.1995.sp020738. [DOI] [PMC free article] [PubMed] [Google Scholar]
- Chang H-R, Kuo C-C. Extracellular proton-modulated pore-blocking effect of anticonvulsant felbamate on NMDA channels. Biophys J. 2007;93:1981–1992. doi: 10.1529/biophysj.106.103176. [DOI] [PMC free article] [PubMed] [Google Scholar]
- Chang HR, Kuo CC. Molecular determinants of the anticonvulsant felbamate binding site in the N-methyl-D-aspartate receptor. J Med Chem. 2008;51:1534–1545. doi: 10.1021/jm0706618. [DOI] [PubMed] [Google Scholar]
- Chen Y, Chad JE, Cannon RC, Wheal HV. Reduced Mg2+ blockade of synaptically activated N-methyl-D-aspartate receptor-channels in CA1 pyramidal neurons in kainic acid-lesioned rat hippocampus. Neuroscience. 1999;88:727–739. doi: 10.1016/s0306-4522(98)00253-x. [DOI] [PubMed] [Google Scholar]
- Clarke RJ, Johnson JW. Voltage-dependent gating of NR1/2B NMDA receptors. J Physiol. 2008;586:5727–5741. doi: 10.1113/jphysiol.2008.160622. [DOI] [PMC free article] [PubMed] [Google Scholar]
- Dingledine R, Borges K, Bowie D, Traynelis SF. The glutamate receptor ion channels. Pharmacol Rev. 1999;51:7–61. [PubMed] [Google Scholar]
- Drummond GB. Reporting ethical matters in The Journal of Physiology: standards and advice. J Physiol. 2009;587:713–719. doi: 10.1113/jphysiol.2008.167387. [DOI] [PMC free article] [PubMed] [Google Scholar]
- Guo D, Ramu Y, Klem AM, Lu Z. Mechanism of rectification in inward-rectifier K+ channels. J Gen Physiol. 2003;121:261–275. doi: 10.1085/jgp.200208771. [DOI] [PMC free article] [PubMed] [Google Scholar]
- Heckmann K. Single file diffusion. Biomembranes. 1972;3:127–153. doi: 10.1007/978-1-4684-0961-1_9. [DOI] [PubMed] [Google Scholar]
- Hille B, Schwarz W. Potassium channels as multi-ion single-file pores. J Gen Physiol. 1978;72:409–442. doi: 10.1085/jgp.72.4.409. [DOI] [PMC free article] [PubMed] [Google Scholar]
- Hodgkin AL, Keynes RD. The potassium permeability of a giant nerve fibre. J Physiol. 1955;128:61–88. doi: 10.1113/jphysiol.1955.sp005291. [DOI] [PMC free article] [PubMed] [Google Scholar]
- Hess P, Lansman JB, Tsien RW. Calcium channel selectivity for divalent and monovalent cations. Voltage and concentration dependence of single channel current in ventricular heart cells. J Gen Physiol. 1986;88:293–319. doi: 10.1085/jgp.88.3.293. [DOI] [PMC free article] [PubMed] [Google Scholar]
- Hess P, Tsien RW. Mechanism of ion permeation through calcium channels. Nature. 1984;309:453–456. doi: 10.1038/309453a0. [DOI] [PubMed] [Google Scholar]
- Jahr CE, Stevens CF. A quantitative description of NMDA receptor-channel kinetic behaviour. J Neurosci. 1990;10:1830–1837. doi: 10.1523/JNEUROSCI.10-06-01830.1990. [DOI] [PMC free article] [PubMed] [Google Scholar]
- Jahr CE, Stevens CF. Calcium permeability of the N-methyl-D-aspartate receptor channel in hippocampal neurons in culture. Proc Natl Acad Sci U S A. 1993;90:11573–11577. doi: 10.1073/pnas.90.24.11573. [DOI] [PMC free article] [PubMed] [Google Scholar]
- Johnson JW, Ascher P. Voltage-dependent block by intracellular Mg2+of N-methyl-D-aspartate-activated channels. Biophys J. 1990;57:1085–1090. doi: 10.1016/S0006-3495(90)82626-6. [DOI] [PMC free article] [PubMed] [Google Scholar]
- Khazipov R, Ragozzino D, Bregestovski P. Kinetics and Mg2+ block of N-methyl-D-aspartate receptor channels during postnatal development of hippocampal CA3 pyramidal neurons. Neuroscience. 1995;69:1057–1065. doi: 10.1016/0306-4522(95)00337-i. [DOI] [PubMed] [Google Scholar]
- Kleckner NW, Dingledine R. Regulation of hippocampal NMDA receptors by magnesium and glycine during development. Mol Brain Res. 1991;11:151–159. [PubMed] [Google Scholar]
- Köhr G, De Koninck Y, Mody I. Properties of NMDA receptor channels in neurons acutely isolated from epileptic (kindled) rats. J Neurosci. 1993;13:3612–3627. doi: 10.1523/JNEUROSCI.13-08-03612.1993. [DOI] [PMC free article] [PubMed] [Google Scholar]
- Kuner T, Schoepfer R. Multiple structural elements determine subunit specificity of Mg2+ block in NMDA receptor channels. J Neurosci. 1996;16:3549–3558. doi: 10.1523/JNEUROSCI.16-11-03549.1996. [DOI] [PMC free article] [PubMed] [Google Scholar]
- Kuo C-C, Chen W-Y, Yang Y-C. Block of tetrodotoxin-resistant Na+ channel pore by multivalent cations: gating modification and Na+ flow dependence. J Gen Physiol. 2004a;124:27–42. doi: 10.1085/jgp.200409054. [DOI] [PMC free article] [PubMed] [Google Scholar]
- Kuo C-C, Hess P. Ion permeation through the L-type Ca2+ channel in rat phaeochromocytoma cells: two sets of ion binding sites in the pore. J Physiol. 1993a;466:629–655. [PMC free article] [PubMed] [Google Scholar]
- Kuo C-C, Hess P. Characterization of the high-affinity Ca2+ binding sites in the L-type Ca2+ channel pore in rat phaeochromocytoma cells. J Physiol. 1993b;466:657–682. [PMC free article] [PubMed] [Google Scholar]
- Kuo C-C, Hess P. Block of the L-type Ca2+ channel pore by external and internal Mg2+ in rat phaeochromocytoma cells. J Physiol. 1993c;466:683–706. [PMC free article] [PubMed] [Google Scholar]
- Kuo C-C, Lin B-J, Chang H-R, Hsieh C-P. Use-dependent inhibition of the N-methyl-D-aspartate currents by felbamate: a gating modifier with selective binding to the desensitized channels. Mol Pharmacol. 2004b;65:370–380. doi: 10.1124/mol.65.2.370. [DOI] [PubMed] [Google Scholar]
- Kuo C-C, Lin T-J, Hsieh C-P. Effect of Na+ flow on Cd2+ block of tetrodotoxin-resistant Na+ channels. J Gen Physiol. 2002;120:159–172. doi: 10.1085/jgp.20018536. [DOI] [PMC free article] [PubMed] [Google Scholar]
- Kupper J, Ascher P, Neyton J. Internal Mg2+ block of recombinant NMDA channels mutated within the selectivity filter and expressed in Xenopus oocytes. J Physiol. 1998;507:1–12. doi: 10.1111/j.1469-7793.1998.001bu.x. [DOI] [PMC free article] [PubMed] [Google Scholar]
- Kurata HT, Cheng WW, Arrabit C, Slesinger PA, Nichols CG. The role of the cytoplasmic pore in inward rectification of Kir2.1 channels. J Gen Physiol. 2007;130:145–155. doi: 10.1085/jgp.200709742. [DOI] [PMC free article] [PubMed] [Google Scholar]
- Li-Smerin Y, Johnson JW. Kinetics of the block by intracellular Mg2+ of the NMDA-activated channel in cultured rat neurons. J Physiol. 1996;491:121–135. doi: 10.1113/jphysiol.1996.sp021201. [DOI] [PMC free article] [PubMed] [Google Scholar]
- Lopatin AN, Nichols CG. K+ dependence of polyamine–induced rectification in inward rectifier potassium channels (IRK-1, Kir2.1) J Gen Physiol. 1996;108:105–113. doi: 10.1085/jgp.108.2.105. [DOI] [PMC free article] [PubMed] [Google Scholar]
- Matsuda H, Saigusa A, Irisawa H. Ohmic conductance through the inwardly rectifying K+ channel and blocked by internal Mg2+ Nature. 1987;325:156–159. doi: 10.1038/325156a0. [DOI] [PubMed] [Google Scholar]
- Mayer ML, Armstrong N. Structure and function of glutamate receptor ion channels. Annu Rev Physiol. 2004;66:161–181. doi: 10.1146/annurev.physiol.66.050802.084104. [DOI] [PubMed] [Google Scholar]
- Mayer ML, Westbrook GL. Permeation and block of N-methyl-d-aspartic acid receptor channels by divalent cations in mouse cultured central neurons. J Physiol. 1987;394:501–527. doi: 10.1113/jphysiol.1987.sp016883. [DOI] [PMC free article] [PubMed] [Google Scholar]
- Mayer ML, Westbrook GL, Guthrie PB. Voltage-dependent block by Mg2+ of NMDA responses in spinal cord neurones. Nature. 1984;309:261–263. doi: 10.1038/309261a0. [DOI] [PubMed] [Google Scholar]
- Mori H, Masaki H, Yamakura T, Mishina M. Identification by mutagenesis of a Mg2+-block site of the NMDA receptor channel. Nature. 1992;358:673–675. doi: 10.1038/358673a0. [DOI] [PubMed] [Google Scholar]
- Nowak L, Bregestovski P, Ascher P, Herbet A, Prochiantz A. Magnesium gates glutamate-activated channels in mouse central neurones. Nature. 1984;307:462–465. doi: 10.1038/307462a0. [DOI] [PubMed] [Google Scholar]
- Qian A, Antonov SM, Johnson JW. Modulation by permeant ions of Mg2+ inhibition of NMDA-activated whole-cell currents in rat cortical neurons. J Physiol. 2002;538:65–77. doi: 10.1113/jphysiol.2001.012685. [DOI] [PMC free article] [PubMed] [Google Scholar]
- Qian A, Johnson JW. Permeant ion effects on external Mg2+ block of NR1/2D NMDA receptors. J Neurosci. 2006;26:10899–10910. doi: 10.1523/JNEUROSCI.3453-06.2006. [DOI] [PMC free article] [PubMed] [Google Scholar]
- Ruppersberg JP, Kitzing EV, Schoepfer R. The mechanism of magnesium block of NMDA receptors. Semin Neurosci. 1994;6:87–96. [Google Scholar]
- Sakurada K, Masu M, Nakanishi S. Alteration of Ca2+ permeability and sensitivity to Mg2+ and channel blockers by a single amino acid substitution in the N-methyl-D-aspartate receptor. J Biol Chem. 1993;268:410–415. [PubMed] [Google Scholar]
- Schumaker MF, MacKinnon R. A simple model for multi-ion permeation. Single-vacancy conduction in a simple pore model. Biophys J. 1990;54:975–984. doi: 10.1016/S0006-3495(90)82442-5. [DOI] [PMC free article] [PubMed] [Google Scholar]
- Shin H-G, Lu Z. Mechanism of the voltage sensitivity of IRK1 inward-rectifier K+ channel block by the polyamine spermine. J Gen Physiol. 2005;125:413–426. doi: 10.1085/jgp.200409242. [DOI] [PMC free article] [PubMed] [Google Scholar]
- Shin H-G, Xu Y, Lu Z. Evidence for sequential ionbinding loci along the inner pore of the inward-rectifier K+ channel. J Gen Physiol. 2005;126:123–135. doi: 10.1085/jgp.200509296. [DOI] [PMC free article] [PubMed] [Google Scholar]
- Sobolevskii AI, Khodorov BI. Blocker studies of the functional architecture of the NMDA receptor channel. Neurosci Behav Physiol. 2002;32:157–171. doi: 10.1023/a:1013927409034. [DOI] [PubMed] [Google Scholar]
- Sobolevsky AI, Yelshansky MV. The trapping block of NMDA receptor channels in acutely isolated rat hippocampal neurones. J Physiol. 2000;526:493–506. doi: 10.1111/j.1469-7793.2000.t01-2-00493.x. [DOI] [PMC free article] [PubMed] [Google Scholar]
- Stout AK, Li-Smerin Y, Johnson JW, Reynolds IJ. Mechanisms of glutamate-stimulated Mg2+ influx and subsequent Mg2+ efflux in rat forebrain neurones in culture. J Physiol. 1996;492:641–657. doi: 10.1113/jphysiol.1996.sp021334. [DOI] [PMC free article] [PubMed] [Google Scholar]
- Strecker GJ, Jackson MB, Dudek FE. Blockade of NMDA-activated channels by magnesium in the immature rat hippocampus. J Neurophysiol. 1994;72:1538–1548. doi: 10.1152/jn.1994.72.4.1538. [DOI] [PubMed] [Google Scholar]
- Tsuzuki KS, Mochizuki S, Iino M, Mori H, Mishina M, Ozawa S. Ion permeation properties of the cloned mouse e2/z1 NMDA receptor channel. Brain Res Mol Brain Res. 1994;26:37–46. doi: 10.1016/0169-328x(94)90071-x. [DOI] [PubMed] [Google Scholar]
- Villarroel A, Burnashev N, Sakmann B. Dimensions of the narrow portion of a recombinant NMDA receptor channel. Biophys J. 1995;68:866–875. doi: 10.1016/S0006-3495(95)80263-8. [DOI] [PMC free article] [PubMed] [Google Scholar]
- Watanabe J, Beck C, Kuner T, Premkumar LS, Wollmuth LP. DRPEER: a motif in the extracellular vestibule conferring high Ca flux rates in NMDA receptor channels. J Neurosci. 2002;22:10209–10216. doi: 10.1523/JNEUROSCI.22-23-10209.2002. [DOI] [PMC free article] [PubMed] [Google Scholar]
- Williams K, Pahk AJ, Kashiwagi K, Masuko T, Nguyen ND, Igarashi K. The selectivity filter of the N-methyl-D-aspartate receptor: a tryptophan residue controls block and permeation of Mg2+ Mol Pharmacol. 1998;53:933–941. [PubMed] [Google Scholar]
- Wollmuth LP, Kuner T, Sakmann B. Adjacent asparagines in the NR2-subunit of the NMDA receptor channel control the voltage-dependent block by extracellular Mg2+ J Physiol. 1998a;506:13–32. doi: 10.1111/j.1469-7793.1998.013bx.x. [DOI] [PMC free article] [PubMed] [Google Scholar]
- Wollmuth LP, Kuner T, Sakmann B. Intracellular Mg2+ interacts with structural determinants of the narrow constriction contributed by the NR1-subunit in the NMDA receptor channel. J Physiol. 1998b;506:33–52. doi: 10.1111/j.1469-7793.1998.00033.x. [DOI] [PMC free article] [PubMed] [Google Scholar]
- Woodhull AM. Ionic blockage of sodium channels in nerve. J Gen Physiol. 1973;61:687–708. doi: 10.1085/jgp.61.6.687. [DOI] [PMC free article] [PubMed] [Google Scholar]
- Zarei MM, Dani JA. Ionic permeability characteristics of the N-methyl-D-aspartate receptor channel. J Gen Physiol. 1994;103:231–248. doi: 10.1085/jgp.103.2.231. [DOI] [PMC free article] [PubMed] [Google Scholar]
- Zhu Y, Auerbach A. Na+ occupancy and Mg2+ block of the N-methyl-d-aspartate receptor channel. J Gen Physiol. 2001a;117:275–286. doi: 10.1085/jgp.117.3.275. [DOI] [PMC free article] [PubMed] [Google Scholar]
- Zhu Y, Auerbach A. K+ occupancy of the N-methyl-d-aspartate receptor channel probed by Mg2+ block. J Gen Physiol. 2001b;117:287–298. doi: 10.1085/jgp.117.3.287. [DOI] [PMC free article] [PubMed] [Google Scholar]