

Abstract
Hepatocellular carcinoma is one of the most common cancers worldwide. Despite several efforts to elucidate hepatocellular carcinoma molecular pathogenesis, it is still not fully understood. To acquire further insights into the molecular mechanisms of hepatocellular carcinoma, we performed a systematic functional genomic approach on human HuH-7 and JHH-6 cells. The subsequent analysis of the differentially expressed genes in human specimens revealed a molecular signature of 11 genes from which we selected the LGALS1 gene, which was overexpressed in hepatocellular carcinoma. The expression analysis in humans of Galectin-1 (Gal-1), the protein encoded by LGALS1, showed a Gal-1 preferential accumulation in the stromal tissue around hepatocellular carcinoma tumors. Moreover, a significant association between increased expression of Gal-1 in hepatocellular carcinoma and the presence of metastasis was observed. Interestingly, Gal-1 overexpression resulted in an increase of cell migration and invasion. In conclusion, this study provides a portfolio of targets useful for future investigations into molecular marker–discovery studies on a large number of patients and functional assays. In addition, our data provide evidence that Gal-1 plays a role in hepatocellular carcinoma cell migration and invasion, and we suggest that further studies should be conducted to fully establish the role of Gal-1 in hepatocellular carcinoma pathogenesis and evaluate Gal-1 as a potential molecular therapeutic target.
INTRODUCTION
Hepatocellular carcinoma (HCC) is the fifth most common malignancy worldwide and is the third most common cause of cancer-related death. Globally, the 5-year survival rate of HCC is <5%, and approximately 598,000 HCC patients die each year (1). Although surgery remains the only and the most effective therapeutic approach for HCC, most HCC patients are still ineligible for surgical intervention (2). For those who qualify for surgery, the subsequent improvement in long-term survival is only modest, owing to a high rate of recurrence or intrahepatic metastases that develop through invasion of the portal vein or spread to other parts of the liver (3,4). To improve prognosis and treatment of HCC, information regarding the phenotypic and molecular changes associated with the development of this disease must be determined. Despite several previous efforts, our current understanding of HCC is still rather limited (5).
Gene expression profiling is a useful approach to elucidate the molecular events underlying HCC development and to identify novel diagnostic markers as well as therapeutic and preventive targets. However, the selection of potentially important candidate genes for further studies (which are derived from lengthy gene lists generated from gene expression profiling studies) is challenging for several reasons, including the presence of many confounding factors in the gene expression profile data from human cancer tissues (differences in age, hospital care and treatment protocols; nonparallel progression of cancer; and environment factors). For this reason, to acquire further insight into the molecular mechanisms of HCC, we performed a systematic functional genomic approach to investigate human HuH-7 and JHH-6 HCC cells. The former are considered an acceptable model for differentiated HCC, whereas the latter are models for undifferentiated, more malignant liver cancer (6–10). With this approach and the subsequent gene expression analysis on human HCC specimens, we identified an HCC molecular signature consisting of 11 genes that may play important roles in hepatocarcinogenesis. Among these genes, we focused our attention on LGALS1, which was overexpressed in human HCC. LGALS1 encodes the Galectin-1 (Gal-1) protein, which belongs to a family of soluble lactose-binding lectins (galectins) characterized by their affinity for β-galactoside moieties. Gal-1 is a multifunctional protein involved in various aspects of tumorigenesis (cell–extracellular matrix and cell–cell interactions, cell migration, angiogenesis, tumor–immune escape) and has been described as a promising cancer target (11–13). Gal-1 expression has been examined in several malignant tumors (14–24), and its correlation with tumor invasiveness and lymph node metastasis was demonstrated in breast cancer (25), neuroblastoma (26), oral squamous cell carcinoma and lung adenocarcinoma (27). Although Kondoh et al. (28) showed that the activation of LGALS1 gene expression in HCC results from promoter hypomethylation, data on Gal-1 protein expression in HCC and its correlation to clinicopathological parameters were not available. The role of Gal-1 in molecular mechanisms leading to cancer development has been analyzed in several tumors (11) but surprisingly never in the molecular pathogenesis of HCC. In particular, it is still unknown whether Gal-1 affects the invasive ability of HCC as previously shown in other malignant tumors (25–27).
In this study, we performed a comprehensive Gal-1 protein expression analysis in resection specimens of patients with HCC, nontumorous liver tissues and normal liver tissues by using a clinically well-characterized tissue microarray (TMA) and correlated our findings with patient clinicopathological parameters. Moreover, we provide direct functional evidence demonstrating that Gal-1 affects the ability of tumor invasion in HCC cell lines.
MATERIAL AND METHODS
Cell Culturing
HuH-7 (differentiated human hepatoma) and JHH-6 cells (undifferentiated hepatocellular carcinoma) were obtained from Japan Health Science Research Resources Bank (Rinku Town, Osaka, Japan) and grown according to the manufacturer’s protocol.
Microarray Analysis
RNA isolation from cell lines, gene profiling, microarray data processing and statistical analysis, as well as gene ontology analysis are described in detail in the online supplementary material. Briefly, we performed a microarray experiment in triplicate on JHH-6 and HuH-7 total RNA using U133Plus 2.0 GeneChip Human Genome (Affymetrix UK, High Wycombe, UK). The raw gene expression data (.CEL files) are provided as supplementary material. The quality control and the expression measures of each chip were performed using the affy package from the R Computing Environment (http://www.bioconductor.org/). The expression measures were performed using robust multiarray average (29). Gene expression analysis was performed by Cyber-T (http://visitor.ics.uci.edu/genex/cybert/). Significance levels were adjusted according to the Bonferroni method. Differentially expressed genes were classified according to the DAVID 2008 functional annotation system (http://david.abcc.ncifcrf.gov).
Real-Time Quantitative Polymerase Chain Reaction
Real-time quantitative polymerase chain reaction (QRT-PCR) experiments and statistical analysis are described in detail in the supplementary material. Briefly, we used TRIZOL reagent (Invitrogen, Milano, Italy) to isolate total RNA from cells, human HCC, cirrhosis surrounding HCC (SLC) and cirrhosis distal from HCC (DLC) specimens. cDNA was synthesized by random hexamers with the SuperScript First-Strand Synthesis System for RT-PCR kit (Invitrogen). QRT-PCR was performed as previously described (30). GAPDH, rRNA 18S and β-actin mRNAs were used to normalize mRNA concentration. The statistical analysis was performed as previously described (30,31).
Patients
Twenty patients, followed at the Centro Studi Fegato (Trieste), who prospectively underwent surgical treatment of HCC, were included in the study. HCC, SLC and DLC specimens from each patient were collected at the time of surgery and snap frozen. HCC diagnosis was established based on international criteria for HCC diagnosis and treatment (32) and confirmed by histological analysis. HCC specimens were histologically classified according to the Edmondson and Steiner criteria (33). Patient clinical findings are summarized in Table 1. No patient had undergone chemotherapy before surgery.
Table 1.
Clinical findings of study patients (N = 20).
| Mean ± SD | |
|---|---|
| Age, years | |
| All patients | 64 ± 7 |
| Males | 63 ± 8 |
| Females | 67 ± 3 |
| n (%) | |
| Sex | |
| Male | 17 (85) |
| Female | 3 (15) |
| Male/female | 5.7/1 |
| Etiology | |
| HCV infection | 8 (40) |
| HBV infection | 3 (15) |
| Alcohol abuse | 8 (40) |
| Hemochromatosis | 1 (5) |
| Child-Pugh score | |
| A | 11 (55) |
| B | 6 (30) |
| C | 3 (15) |
| HCC grading | |
| G2 | 13 (65) |
| G3 | 7 (35) |
TMA Construction and Immunohistochemistry
The files of the Institute of Pathology, University Hospital Basel, and the Department of Pathology, University of Milan, School of Medicine and Humanitas Clinical Institute, were searched for samples of HCCs and dysplastic nodules (DN) obtained during the period from 1988 to 2007. In total, 204 HCCs, 5 HGDNs and 2 LGDNs were retrieved. Sufficient paraffin-embedded tissue for TMA construction was available in all cases. In 189 specimens, hepatic parenchyma surrounding neoplastic or dysplastic nodules was also sampled. Tumor characteristics, clinical findings and histopathology of surrounding liver tissue are summarized in Tables 2, 3 and 4. The male to female ratio was 3.4:1, mean age at diagnosis was 69.9 years (range 10–93 years).
Table 2.
Tumor-node-metastasis classification of HCCs.
| Staging parameter | n (%) |
|---|---|
| Tumor stage | |
| 1 | 61 (29.9) |
| 2 | 63 (30.9) |
| 3 | 48 (23.5) |
| 4 | 9 (4.4) |
| Not available | 23 (11.3) |
| Metastasis stagea | |
| 0 | 161 (78.9) |
| 1 | 32 (15.7) |
| Not available | 11 (5.4) |
| Node stage | |
| 0 | 178 (87.3) |
| 1 | 15 (7.4) |
| Not available | 11 (5.4) |
| Grading | |
| G1 | 79 (38.7) |
| G2 | 92 (45.1) |
| G3 | 29 (14.2) |
| Not available | 4 (2.0) |
The presence of metastasis in human HCC specimens was assessed by autoptic observation.
Table 3.
Etiology of HCCs and DNs.a
| Etiology | HCC, n (%) | DN, n (%) |
|---|---|---|
| Alcohol abuse | 39 (19.1) | 2 (28.6) |
| HBV infection | 28 (13.7) | 1 (14.3) |
| HCV infection | 63 (30.9) | 3 (42.9) |
| HBV + HCV infection | 2 (1.0) | 0 |
| HBV infection + alcohol abuse | 2 (1.0) | 0 |
| HCV infection + alcohol abuse | 2 (1.0) | 0 |
| Primary biliary cirrhosis + alcohol abuse | 1 (0.5) | 0 |
| Autoimmunhepatitis | 1 (0.5) | 0 |
| Hemochromatosis | 1 (0.5) | 0 |
| Hemochromatosis + alcohol abuse | 1 (0.5) | 0 |
| a1-Antitrypsin deficiency | 3 (1.5) | 0 |
| a1-Antitrypsin deficiency + HCV infection | 1 (0.5) | 0 |
| Unknown | 42 (20.6) | 1 (14.3) |
| Not available | 18 (8.8) | 0 |
HCC = 204; DN = 7.
Table 4.
Nontumorous liver tissue.
| Liver parenchyma | n (%) |
|---|---|
| Liver cirrhosis | 155 (82.0) |
| Liver fibrosis | 9 (4.8) |
| Regular | 21 (11.1) |
| Not available | 4 (2.1) |
For TMA construction, the number of punches per tissue type and patient ranged from 1 to 3. One punch was collected per patient on average (median 1.0) for each of the tissue types. We performed immunohistochemical analysis as previously described (34) using a mouse monoclonal anti–galectin-1 antibody (1:250; Novocastra, Newcastle upon Tyne, UK) detected by an antimouse peroxidase-conjugated EnVision antibody (Dako, Baar, Switzerland). Sections were counterstained with hematoxylin. Negative control consisted of primary antibody omission.
Gal-1 immunoreactivity was analyzed independently by two pathologists and was scored semiquantitatively by evaluating the number of positive hepatocytes and stroma cells over the total number of hepatocytes and stroma cells, respectively. Scores were assigned by use of 10% intervals and ranged from 0% to 100%. The staining intensity was semiquantitatively recorded as 0, 1, 2 or 3. A total of 197 HCC samples were divided into two groups based on the staining intensity: 0 and 1 (n = 153) versus 3 and 4 (n = 44). The absolute frequencies were compared by use of the Pearson chi-square test. Quantitative clinical data were compared by use of the Mann–Whitney test. P = 0.05 was considered significant.
Immunoblotting
Total protein extracts were prepared and used for immunoblotting as previously described (35) by use of goat anti–galectin-1 (0.2 μg/mL; R&D Systems, Minneapolis, MN, USA), rabbit anti-Syk (1:1000; Cell Signaling Technology, Danvers, MA, USA) and rabbit anti–phospho-Zap-70 (Tyr319)/Syk (Tyr352) antibodies (1:1000; Cell Signaling Technology) detected by horseradish peroxidase–conjugated antigoat and antirabbit antibodies (1:5000) (Santa Cruz Biotechnology, Santa Cruz, CA, USA). A mouse anti–β-actin antibody (1:5.000; Sigma-Aldrich, Milan, Italy) was used as a control for equal loading.
Construct Preparation
We isolated total RNA from JHH-6 cells using TRIZOL reagent (Invitrogen). cDNA was synthesized by oligo(dT) with a SuperScript First-Strand Synthesis System for RT-PCR kit (Invitrogen). The LGALS1 cDNA was amplified by specific primers for LGALS1 (5′-GAGTCTTCTG ACAGCTGGTGC-3′ and 5′-TGATT TCAGTCAAAGGCCACAC-3′) with Pfu DNA Polymerase (Promega, Milan, Italy) and cloned to the plasmid pBluescript EcoRV. After sequencing, the 500-bp BamHI-XhoI fragment of LGALS1 cDNA was cloned to the plasmid pcDNA3.1 BamHI-XhoI (pcDNA3.1-LGALS1 plasmid).
Cell Transfection
One d before transfection, HuH-7 cells were plated in a 100-mm dish. At the time of transfection, the cell confluence was 70%, and the cells were transiently transfected with 6 μg pcDNA3.1-LGALS1 plasmid or the empty vector using TransIT-LT1 transfection reagent (Mirus, Madison, WI, USA). Forty-eight h after transfection, the cells were briefly cultured for 72 h under the selection pressure of 3 mg/mL G418 (Gibco, Milan, Italy) to kill the untransfected cells. After 72 h, the cells were harvested; the LGALS1 and Gal-1 expression levels were evaluated and cell invasion and migration assays were performed.
Cell Invasion and Migration Assays
We determined cell invasiveness by using chamber inserts (24-well format, polycarbonate membrane filter of 8-μm pore size) (Corning, Milan, Italy), which were coated with 10 μg matrigel (Matrigel Basement Membrane Matrix, BD Biosciences, Buccinasco, Italy). A total of 25,000 cells, transfected with pcDNA3.1-LGALS1 plasmid or the empty vector, were seeded onto the upper chamber in DMEM medium without FBS. DMEM medium in the lower chamber contained 5% FBS served as a chemoattractant. After 2 h, cells migrating to the lower membrane surface were fixed and stained with hematoxylin/eosin. Cells were photographed and counted in six random fields per membrane at 10× magnification using a light microscope. The experiments were carried out in duplicate, and two independent sets of experiments were carried out. The migration assay was carried out as described in the invasion assay in the absence of matrigel.
RESULTS
Gene Expression Profile in HCC Cells
The gene expression profile of JHH-6 cells compared with HuH-7 cells showed 47 (27 upregulated and 20 downregulated) significantly differentially expressed genes (Table 5). Two upregulated genes (C8orf47 and LOC344887) were unknown. The genes belong to different functional groups (Figure 1A); 11 of 20 downregulated genes (55%) are known to be involved in metabolic pathways, and in particular TF, APOA II, FABP1 and APOA I liver-specific genes were the most strongly downregulated. Conversely, the upregulated genes are known to be involved in several biological processes, and in particular in cell proliferation/differentiation/apoptosis (AKT3, IFI16, LGALS1, TRIM16), transcription regulation (ZIC2, PITX1, TRIM16), angiogenesis (EDIL3), cell–cell and cell–substrate interaction (LGALS1), and cell movement (LGALS1, MSN, Cdc42ep3). Several genes map to allelic imbalance chromosomal regions involved in HCC (Table 5). Interestingly, genes involved in cell proliferation (IFI16) and in transcription regulation (ZIC2, PITX1, TRIM16) mapped to allelic imbalance chromosomal regions involved in HCC. Moreover, previous data demonstrated that DLK1, GSTP1, MAGEA3 and LGALS1 gene expression in HCC is regulated by methylation status changes of the promoter (Table 5). The significant differential expression of these genes was validated by QRT-PCR using GAPDH and β-actin as housekeeping genes (Figure 1B, C).
Table 5.
Differentially expressed genes in HCC cell lines.
| Downregulated genes | ||||||||
|---|---|---|---|---|---|---|---|---|
| AFFY_ID | Gene | Gene symbol | mRNA NCBI accession numbera | Foldb | P valuec | Chromosomal location | Chromosomal aberration in HCCd | Epigenetic regulation in HCC |
| 203400_s_at | Transferrin | TF | NM_001063 | −8.988 | 0.042 | 3q22.1 | 3q22–24 (gain) | |
| 219465_at | Apolipoprotein A-II | APOA II | NM_001643 | −8.932 | 0.050 | 1q21–q23 | 1q21–23 (gain) | |
| 219466_s_at | Apolipoprotein A-II | APOA II | NM_001643 | −8.686 | 0.026 | 1q21–q23 | 1q21–23 (gain) | |
| 205892_s_at | Fatty acid binding protein 1, liver | FABP1 | NM_001443 | −7.260 | 0.048 | 2p11 | ||
| 209560_s_at | Delta-like 1 homolog (Drosophila) | DLK1 | NM_003836 and NM_001032997 | −6.914 | 0.017 | 14q32 | Upregulation due to deregulation of methylation | |
| 224588_at | X (inactive)-specific transcript | XIST | BX648323 | −6.746 | 0.002 | Xq13.2 | ||
| 214218_s_at | X (inactive)-specific transcript | XIST | BX648323 | −5.244 | 0.034 | Xq13.2 | ||
| 217073_x_at | Apolipoprotein A-I | APOA I | NM_000039 | −6.390 | 0.027 | 11q23–q24 | 11q23.1 (AI) | |
| 209505_at | Nuclear receptor subfamily 2, group F, member 1 | NR2F1 | NM_005654 | −5.292 | 0.054 | 5q14 | ||
| 209459_s_at | 4-Aminobutyrate aminotransferase | ABAT | NM_020686 and NM_000663 | −5.195 | 0.020 | 16p13.2 | 16p13 (AI) | |
| 242375_x_at | Phenylalanine hydroxylase | PAH | NM_000277 | −5.103 | 0.015 | 12q22–q24.2 | 12q22–q23 (breakpoints of chromosome rearrangement) | |
| 204059_s_at | Malic enzyme 1, NADP(+)-dependent, cytosolic | ME1 | NM_002395 | −5.029 | 0.038 | 6q12 | ||
| 200824_at | Glutathione S-transferase pi | GSTP1 | NM_000852 | −4.999 | 0.045 | 11q13 | Silenced by hypermethylation | |
| 225424_at | Glycerol-3-phosphate acyltransferase, mitochondrial | GPAM | NM_020918 | −4.771 | 0.008 | 10q25.2 | ||
| 206130_s_at | Asialoglycoprotein receptor 2 | ASGR2 | NM_001181, NM_080912, NM_080913, and NM_080914 | −4.510 | 0.044 | 17p | 17p1–p2 (MDR); 17p13.1 (LOH of p53 locus); 17p11.2–p13.3 (AI); 17p12-pter (LOH) | |
| 205352_at | Serine (or cysteine) proteinase inhibitor, clade I (neuroserpin), member 1 | SERPINI1 | NM_005025 | −4.484 | 0.043 | 3q26.1 | 3q25-qter (gain) | |
| 211237_s_at | Fibroblast growth factor receptor 4 | FGFR4 | NM_002011, NM_022963, and NM_213647 | −4.228 | 0.050 | 5q35.1-qter | 5q35-qter (LOH) | |
| 201917_s_at | Hypothetical protein FLJ10618 (solute carrier family 25, member 36) | SLC25A36 | NM_018155 | −3.026 | 0.031 | 3q23 | ||
| 201918_at | Hypothetical protein FLJ10618 (solute carrier family 25, member 36) | SLC25A36 | NM_018155 | −2.862 | 0.043 | 3q23 | ||
| 207819_s_at | ATP-binding cassette, sub-family B (MDR/TAP), member 4 | ABCB4 | NM_000443, NM_018849, and NM_018850 | −2.035 | 0.001 | 7q21.1 | 7q21–32 (gain); 7q21.3–7q22 (amplification of CYP3A locus) | |
| 213198_at | Activin A receptor, type IB | ACVR1B | NM_004302, NM_020327, and NM_020328 | −1.963 | 0.023 | 12q13 | ||
| 1552474_a_at | Guanidinoacetate N-methyltransferase | GAMT | NM_000156, and NM_138924 | −1.749 | 0.023 | 19p13.3 | 19p13.3 (AI) | |
| 219569_s_at | Transmembrane protein 22 | TMEM22 | NM_025246 | −1.487 | 0.007 | 3q22.3 | 3q22–24 (gain) | |
| Upregulated genes | ||||||||
| 44120_at | aarF domain containing kinase 2 | ADCK1 | NM_020421 | 1.349 | 0.037 | 14q24.3 | 14q24–q32 (LOH in less than 10% of HCC cases) | |
| 228737_at | Chromosome 20 open reading frame 100 (TOX high mobility group box family member 2) | TOX2 | NM_032883 | 1.937 | 0.025 | 20q13.12 | ||
| 219587_at | Tetratricopeptide repeat domain 12 | TTC12 | NM_017868 | 2.192 | 0.016 | 11q23.1 | 11q23.1 (AI) | |
| 212295_s_at | Solute carrier family 7 (cationic amino acid transporter, y+ system), member 1 | SLC7A1 | NM_003045 | 2.323 | 0.034 | 13q12–q14 | 13q13–14 (LOH of Rb locus); 13q12.1–q12.3 (AI); 13q12–q13 (deletion of BRCA2 locus); 13q13.3 –q22.1 (loss) | |
| 219582_at | Opioid growth factor receptor-like 1 | OGFRL1 | NM_024576 | 2.582 | 0.026 | 6q13 | ||
| 233540_s_at | CDK5 regulatory subunit associated protein 2 | CDK5RAP2 | NM_018249 and NM_001011649 | 2.812 | 0.054 | 9q33.2 | 9p13–9q33 (LOH) | |
| 212607_at | v-akt Murine thymoma viral oncogene homolog 3 (protein kinase B, gamma) | AKT3 | NM_005465 and NM_181690 | 2.832 | 0.002 | 1q43–q44 | Amplification of AKT3 gene | |
| 208502_s_at | Paired-like homeodomain transcription factor 1 | PITX1 | NM_002653 | 3.178 | 0.032 | 5q31 | 5q31 (amplification of SMAD5 gene) | |
| 201189_s_at | Inositol 1,4,5-triphosphate receptor, type 3 | ITPR3 | NM_002224 | 3.315 | 0.011 | 6p21 | ||
| 217339_x_at | Cancer/testis antigen 1 | CTAG1 | NM_139250 and NM_001327 | 3.650 | 0.020 | Xq28 | ||
| 211966_at | Collagen, type IV, α 2 | COLIVa2 | NM_001846 | 3.743 | 0.038 | 13q34 | 13q34 (gain) | |
| 225147_at | Pleckstrin homology, Sec7 and coiled-coil domains 3 | PSCD3 | NM_004227 | 3.830 | 0.049 | 7p22.1 | ||
| 1552390_a_at | Hypothetical protein FLJ39553 | C8orf47 | NM_173549 | 3.922 | 0.033 | 8q22.2 | 8q22–24 (gain) | |
| 241418_at | cDNA DKFZp686B14224 (from clone DKFZp686B14224) | LOC344887 | BX640843 | 4.222 | 0.029 | 3q27.2 | 3q25-qter (gain) | |
| 1553830_s_at | Melanoma antigen, family A, 3 | MAGEA3 | NM_005362 | 4.296 | 0.007 | Xq28 | Demethylation of MAGEA3 gene | |
| 212223_at | Iduronate 2-sulfatase (Hunter syndrome) | IDS | NM_000202 and NM_006123 | 4.413 | 0.029 | Xq28 | ||
| 219279_at | Dedicator of cytokinesis 10 | DOCK10 | NM_014689 | 4.716 | 0.039 | 2q36.2 | ||
| 223642_at | Zic family member 2 (odd-paired homolog, Drosophila) | ZIC2 | NM_007129 | 4.745 | 0.025 | 13q32 | 13q32-qter (AI); 13q31–34 (gain) | |
| 204341_at | Tripartite motif-containing 16 | TRIM16 | NM_006470 | 4.933 | 0.008 | 17p11.2 | 17p11.2–p13.3 (AI) | |
| 208966_x_at | Interferon, γ-inducible protein 16 | IFI16 | NM_152501, NM_198928, NM_198929, and NM_198930 | 5.510 | 0.037 | 1q22 | 1q21–q22 (gain); 1q22–q23 (gain) | |
| 209288_s_at | CDC42 effector protein (Rho GTPase binding) 3 | Cdc42ep3 | NM_006449 | 5.802 | 0.015 | 2p21 | ||
| 200600_at | Moesin | MSN | NM_002444 | 6.446 | 0.012 | Xq11.2-q12 | ||
| 204955_at | Sushi-repeat-containing protein, X-linked | SRPX | NM_006307 | 6.835 | 0.020 | Xp21.1 | Xp21-pter (gain) | |
| 201105_at | Lectin, galactoside-binding, soluble, 1 (galectin 1) | LGALS1 | NM_002305 | 6.850 | 0.005 | 22q13.1 | Hypomethylation of LGALS1 gene | |
| 225275_at | EGF-like repeats and discoidin I-like domains 3 | EDIL3 | NM_005711 | 7.133 | 0.009 | 5q14 | ||
| 204268_at | S100 calcium binding protein A2 | S100A2 | NM_005978 | 7.183 | 0.039 | 1q21 | 1q21–23 (gain) | |
| 209160_at | Aldo-keto reductase family 1, member C3 (3-α hydroxysteroid dehydrogenase, type II) | AKR1C3 | NM_003739 | 7.595 | 0.024 | 10p15-p14 | ||
For the genes that have alternatively spliced variants the NCBI accession numbers of each alternatively spliced variant are shown.
The changes in gene expression of JHH6 versus HuH7 are shown as log2.
P value adjusted according to the Bonferroni method.
LOH, loss of heterozygosity; MDR, minimal delition region; AI, allelic imbalance.
Figure 1.

Gene expression profile in HCC cell lines. (A) Gene ontology analysis of genes identified by microarray analysis. Percentages indicate the percentage of genes within each functional category. Differential expression of downregulated (B) and upregulated (C) genes was validated by QRT-PCR. For each gene the change in expression of JHH-6 compared with HuH-7 (mean fold change = 2−(average ΔΔCt)) is shown relative to GAPDH (dark gray line) and β-actin (gray line). The fold from microarray analysis (light gray line) is also shown. Error bars are (mean fold change) × (2SEM − 1). P ≤ 0.05; Student t test.
Gene Expression Profile in Human HCC Specimens
We analyzed the expression profile of differentially expressed genes in 20 human HCC, SLC and DLC specimens by QRT-PCR using β-actin (Figure 2) and rRNA 18S (Supplementary Figure 1) as housekeeping genes. Eleven genes (EDIL3, C8orf47, COLIVA2, AKR1C3, LGALS1, MSN, OGFRL1, PSCD3, SERPINI1, TRIM16 and ZIC2) showed a significant differential expression profile with both β-actin (Figure 2B) and rRNA 18S (Supplementary Figure 1B). We confirmed the previously reported upregulation of EDIL3 (36), LGALS1 (28) and SERPINI1 (37) genes and observed the upregulation of AKR1C3, C8orf47, COLIVA2, MSN, OGFRL1, PSCD3, TRIM16 and ZIC2 genes. The upregulation of SERPINI1, C8orf47, COLIVA2 and ZIC2 genes is in agreement with their location on chromosomal regions gained in HCC. Moreover, the TRIM16 gene maps to an allelic imbalance chromosomal region involved in HCC (Table 5). We performed a gene ontology analysis on the 11 identified genes. As shown in Table 6, the most representative classes were GO:0007275 and GO:0048856. Both terms are present in LGALS1 annotation. The remaining genes did not show a significant differential expression profile with both β-actin and rRNA 18S (data not shown).
Figure 2.

Gene expression profile in humans. The figure shows the statistically significant differentially expressed genes in human HCC, SLC and DLC specimens from 20 patients. (A) Trend of expression relative to β-actin for the 11 analyzed genes, (B) the median (minimum–maximum) values for each gene and (C) the box-plot of each gene are shown. P value was calculated by Kruskal–Wallis test.
Table 6.
Functional annotation of 11 identified genes.a
| Gene symbol | GOTERMb | KEGG pathways |
|---|---|---|
| MSN | GO:0006928,cell motility; | hsa04670:Leukocyte transendothelial migration; |
| GO:0051674,localization of cell | hsa04810:Regulation of actin cytoskeleton | |
| OGFRL1 | — | — |
| LGALS1 | GO:0007154,cell communication; | — |
| GO:0007275,multicellular organismal development; | ||
| GO:0016265,death; | ||
| GO:0048468,cell development; | ||
| GO:0048856,anatomical structure development; | ||
| GO:0048869,cellular developmental process; | ||
| GO:0050789,regulation of biological process; | ||
| GO:0050794,regulation of cellular process | ||
| C8orf47 | — | — |
| PSCD3 | GO:0006810,transport; | — |
| GO:0007154,cell communication; | ||
| GO:0050789,regulation of biological process; | ||
| GO:0050794,regulation of cellular process; | ||
| GO:0051234,establishment of localization | ||
| COL4A2 | GO:0006810,transport; | hsa01430:Cell Communication; |
| GO:0007275,multicellular organismal development; | hsa04510:Focal adhesion; | |
| GO:0009653,anatomical structure morphogenesis; | hsa04512:ECM-receptor interaction; | |
| GO:0016043,cellular component organization and biogenesis; | hsa05222:Small cell lung cancer | |
| GO:0048646,anatomical structure formation; | ||
| GO:0048856,anatomical structure development; | ||
| GO:0050789,regulation of biological process; | ||
| GO:0051234,establishment of localization | ||
| AKR1C3 | GO:0006091,generation of precursor metabolites and energy; | hsa00590:Arachidonic acid metabolism; |
| GO:0044237,cellular metabolic process; | hsa00980:Metabolism of xenobiotics by cytochrome P450 | |
| GO:0044238,primary metabolic process | ||
| SERPINI1 | GO:0007275,multicellular organismal development; | — |
| GO:0048856,anatomical structure development | ||
| TRIM16 | — | — |
| EDIL3 | GO:0007155,cell adhesion; | — |
| GO:0007275,multicellular organismal development | ||
| ZIC2 | GO:0006810,transport; | hsa04340:Hedgehog signaling pathway |
| GO:0007155,cell adhesion; | ||
| GO:0007275,multicellular organismal development; | ||
| GO:0009653,anatomical structure morphogenesis; | ||
| GO:0009790, embryonic development; | ||
| GO:0048066,pigmentation during development; | ||
| GO:0048856,anatomical structure development; | ||
| GO:0048869,cellular developmental process; | ||
| GO:0051234, establishment of localization |
GO terms in bold are in common with those of LGALS1.
Gene ontology term (Biological Process, level analysis 2).
Gal-1 Expression in Human Specimens
We analyzed the Gal-1 expression profile in human normal liver, cirrhotic tissue and HCC specimens by immunohistochemical analysis on TMA. Gal-1 was detected both in hepatocytes (hepatocyte expression) and stroma cells (stromal expression) in all three types of specimens (Figure 3A). Gal-1 hepatocyte expression was significantly higher in normal liver specimens than cirrhotic and HCC specimens (P < 0.001). The opposite trend was observed for Gal-1 stromal expression, with expression significantly lower in normal liver specimens than cirrhotic and HCC specimens (P = 0.006) (Figure 3B). We compared Gal-1 hepatocyte or stromal expression of normal liver versus cirrhotic specimens, and of cirrhotic versus HCC specimens. A significant differential expression was found between normal liver and cirrhotic specimens relative to Gal-1 hepatocyte expression (P < 0.001; Mann–Whitney test).
Figure 3.

Gal-1 expression in humans. (A) Gal-1 expression in normal, cirrhotic and HCC liver specimens. The fold magnification was 200×. (B) The trends of Gal-1 hepatocyte and stromal expression in normal liver and cirrhotic and HCC liver specimens are shown. *P < 0.01, Kruskal–Wallis test.
A significant association was found between increased expression of Gal-1 in HCC and the presence of metastasis (odds ratio = 2.33; 95% confidence interval, 1.00–5.40; P = 0.04). No significant associations were found with other clinicopathological parameters (sex, age, size, grading [Edmondson] [33], tumor stage, node stage, etiology), although a trend of increased Gal-1 expression in HCC with vascular invasion was observed (odds ratio = 1.97; 95% confidence interval, 0.97–4.01; P = 0.06) (Table 7).
Table 7.
Association analysis between Gal-1 expression in HCC specimens and clinicopathological parameters.
| Staining intensity |
|||
|---|---|---|---|
| 0 or 1 | 2 or 3 | P | |
| Sex, male/female | 118/35 | 32/12 | 0.55 |
| Age, years | (n = 151) | (n = 44) | 0.65 |
| Mean (SD) | 70.5 (11.7) | 69.1 (13.4) | |
| Median | 71.0 | 69.5 | |
| Specimen size, cm | (n = 141) | (n = 40) | 0.09 |
| Mean (SD) | 5.4 (4.5) | 6.7 (4.8) | |
| Median | 3.7 | 5.0 | |
| Grading (Edmondson) | (n = 149) | (n = 44) | 0.72 |
| I–II/III–IV | 62/87 | 17/27 | |
| Tumor stage | (n = 135) | (n = 39) | 0.13 |
| 1–2/3–4 | 97/38 | 23/16 | |
| Node stage | (n = 144) | (n = 42) | 0.22 |
| Lymph node invasion: no/yes | 135/9 | 37/5 | |
| Metastasis stage | (n = 144) | (n = 42) | 0.04 |
| No metastasis/metastasis | 125/19 | 31/11 | |
| Vascular invasion | (n = 128) | (n = 42) | 0.06 |
| No invasion/invasion | 85/43 | 21/21 | |
| Etiology | (n = 104) | (n = 31) | 0.07 |
| Viral/not viral | 75/29 | 17/14 | |
Gal-1 Contributes to Cell Migration and Invasion
The LGALS1 gene expression in JHH-6 cells was significantly increased compared with HuH-7 cells (P = 0.004) (Figure 4A). In line with LGALS1 gene expression, Gal-1 was expressed at a very high level in JHH-6 cells, whereas it was not detectable in HuH-7 cells (Figure 4B). To evaluate the contribution of Gal-1 to aggressiveness of HCC cells, the cDNA of LGALS1 was amplified from JHH-6 total RNA and cloned in a pcDNA3.1 expression vector. HuH-7 cells transfected with the plasmid containing LGALS1 cDNA showed a significant increase of LGALS1 gene expression compared with cells transfected with empty vector (Figure 4C). In line with the increased LGALS1 expression in the transfected cells, Gal-1 expression was significantly increased in HuH-7 cells transfected with the plasmid containing LGALS1 cDNA compared with cells transfected with empty vector (Figure 4D). To determine the effect of Gal-1 on HuH-7 cell migration and invasion, in vitro cell migration and invasion assays were performed. The expression of Gal-1 strongly increased both the migration (Figure 4E) and invasion (Figure 4F) ability of HuH-7 cells transfected with the plasmid containing LGALS1 cDNA compared with HuH-7 cells transfected with empty vector. In summary, this result showed that Gal-1 was positively associated with the invasiveness of HuH-7 cells.
Figure 4.

Effect of Gal-1 on migration and invasion. (A) LGALS1 expression relative to β-actin in HuH-7 and JHH-6 cells. The histograms show the mean values of 2(−ΔCt) in HuH-7 and JHH-6 cells. The error bars in the histogram were determined by SEM of ΔCt values. *P = 0.004, Student t test. (B) Immunoblotting analysis was performed on total protein extracts (30 μg/lane) from HuH-7 and JHH-6 cells. A very high level of Gal-1 expression was observed in more aggressive JHH-6 cells. (C) LGALS1 expression relative to β-actin in HuH-7 cells transfected with plasmid containing LGALS1 cDNA or empty vector. The histograms show the mean values of 2(−ΔCt) in HuH-7 transfected cells. The error bars in the histogram were determined by SEM of ΔCt values. *P = 0.004, Student t test. The graph shows one of three independent experiments with similar results. (D) Immunoblotting analysis was performed on total protein extracts (15 μg/lane) from HuH-7 cells transfected with plasmid containing LGALS1 cDNA or empty vector. The panel shows one of three independent experiments, performed in duplicate, with similar results. (E) Migration assay for the LGALS1-overexpressing HuH-7 cells. The LGALS1 overexpression results in an increase in the average number of HuH-7 migrating cells transfected with plasmid containing LGALS1 cDNA (number of migrated cells/field = 125; SEM = 19.83) compared with the migrating cells transfected with empty vector (control) (number of migrated cells/field = 60; SEM = 0.83). (F) Invasion assay for the LGALS1-overexpressing HuH-7 cells. The LGALS1 overexpression results in a significant increase in the average number of HuH-7 invading cells transfected with plasmid containing LGALS1 cDNA (number of invaded cells/field = 348.42; SEM = 35.08) compared with the invading cells transfected with empty vector (control) (number of invaded cells/field = 199.17; SEM = 0.5). *P = 0.05, Student t test.
Gal-1 Induces Syk Phosphorylation in HuH-7 Transfected Cells
To verify the activation of the Syk signaling pathway by Gal-1, we performed immunoblotting analysis on total protein extracts from HuH-7 cells transfected with empty vector and with the plasmid containing LGALS1 cDNA. HuH-7 cells transfected with the plasmid containing LGALS1 cDNA showed an increased phosphorylation of Syk protein compared with cells transfected with empty vector (Figure 5).
Figure 5.
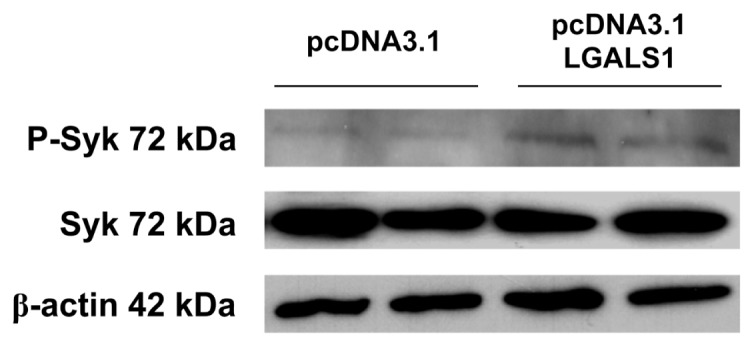
Gal-1 induces Syk phosphorylation. Immunoblotting analysis was performed on total protein extracts (15 μg/lane) from HuH-7 cells transfected with plasmid containing LGALS1 cDNA or empty vector. β-Actin was used as the loading control.
DISCUSSION
HCC is one of the most common and aggressive human malignancies (1). Although much is known about both the cellular changes that lead to HCC and the etiological agents responsible for the majority of HCC, the molecular pathogenesis of this disease is not well understood (5). Moreover, the severity of the disease and its clinical heterogeneity combined with the lack of good diagnostic markers and therapeutic strategies makes the treatment of HCC a major challenge.
This study was designed to acquire further insights into the molecular mechanisms of HCC. Several previous study groups have used microarray technology to explore the molecular mechanisms of HCC to possibly find markers or patterns for early detection and diagnosis and for stage classification and prognosis. A typical application of microarrays in HCC study is to classify patients with different disease status. Such studies include the classification of cancer versus nontumor samples, high versus low histological grade, early versus late stage, favorable versus poor prognosis and HCC patients with HBV versus HCV infection. Gene expression signatures were identified to discriminate HBV-positive HCC from nontumor liver tissues (38) and DNs from HCC in HBV (39) and HCV patients (40), and to monitor the pathological progression of HCV-induced hepatocarcinogenesis at each stage (cirrhosis, dysplasia, early HCC and advanced HCC) (41). Molecular profiling of HCCs unraveled molecular subtypes of HCC associated with specific signaling-pathway alterations (42,43). Moreover tumor-derived gene expression patterns have been associated with patient survival (44), and gene expression signatures of nontumoral liver tissue adjacent to the tumor have been shown to be associated with survival and late recurrence of HCC (45) and with vascular invasion (46). Although these results showed promise, they appeared rather inconsistent, possibly owing to differences in experimental platforms and/or the underlying biological heterogeneity of the disease.
Our approach identified an HCC molecular signature of 11 genes. Although EDIL3, LGALS1 and SERPINI1 genes have been previously reported to be overexpressed in HCC ((28,36,37)), the remaining identified genes in this study have never previously been reported. Several of these genes are involved in important biological processes such as transcription regulation (ZIC2, TRIM16), angiogenesis (EDIL3), cell–cell and cell–substrate interactions (LGALS1) and cell movement (LGALS1, MSN), and accordingly these genes may play an important role in HCC development and progression. Functional studies are necessary to elucidate the role of these genes in HCC pathogenesis and determine their potential as molecular targets for the development of new HCC therapeutic approaches.
EDIL3 is a member of a family of extracellular matrix proteins with multiple EGF-like repeats. EDIL3 is a minor splicing variant of Del1, for which there is extensive literature on its role in promotion of angiogenesis, via interaction with inte-grin a(v)b3, and the metastatic process (47,48). EDIL3 is induced by angiogenesis-related factors, including VEGF1 (49), a factor known to be produced by HCCs (50). PSCD3 belongs to the PSCD family, whose members are guanine nucleotide-exchange proteins, which serve as regulators of ADP ribosylation factors involved in vesicular trafficking and cytoskeletal regulation (51). Interestingly, the knockdown of PSCD3 mRNA determined the mitotic arrest of the cell cycle (52). ZIC2 belongs to the ZIC gene family of zinc-finger transcription factors, which are essential for a wide array of developmental programs, including the central nervous system, muscle and skeletal development and the establishment of left-right asymmetry in the early embryo (53). Human mutations in ZIC family members determine many clinically significant congenital abnormalities (54). Moreover, aberrant expression of ZIC2 has been observed in medulloblastomas (55), small cell lung cancers (56), endometrial cancer with node metastasis (57) and in bladder, colon and breast cancer (56). OGFRL1 encodes the opioid growth factor receptor–like 1, whose biological function is unknown. The opioid growth factor–opioid growth factor receptor interaction plays an inhibitory role in cancerous cell proliferation (58,59), cellular renewal in homeostasis, wound healing, development, angiogenesis and cancer (60). Moesin (membrane-organizing extension spike protein) is a member of the ERM (ezrin-radixin-moesin) protein family. These proteins act as molecular linkers between cell adhesion molecules and the cytoskeleton, regulating cell morphology. These proteins have also been implicated in regulating signaling molecules (61). In particular, Moesin is localized in the intracellular core of microextensions known as filopodia, microvilli, microspikes, and retraction fibers. This subcellular distribution closely follows the dynamic changes in cell shape that take place when cells attach, spread and move spontaneously, or in response to extracellular signals. Therefore, Moesin could be involved in the dynamic restructuring of such microdomains by regulating binding interactions between the plasma membrane and the actin cytoskeleton (62). TRIM16 is a member of the RING-B box-coiled–coil protein family; its biological function has not been well characterized. However, evidence seems to suggest that TRIM16 may play a role in the response of tissues to differentiating agents (63), have a pivotal role in the retinoid anticancer signal (64,65) and play a role in innate immunity by enhancing the alternative secretion pathway of interleukin 1β (66). AKR1C3 converts adrenal androgens such as an-drostenedione and dehydroepiandros-terone into intraprostatic testosterone. AKR1C3 regulates ligand access to steroid hormone and prostaglandin receptors and may stimulate proliferation of prostate and breast cancer cells (67,68). Increased expression of AKR1C3 has been shown to strongly correlate with prostatic carcinogenesis (69,70), malignant breast lesions (71) and endometrial cancer (72), indicating AKR1C3 plays a role in prostate, breast and endometrial carcinogenesis. Therefore, AKR1C3 is a potential target in treating prostate, breast and endometrial cancers (73).
We focused our attention on the LGALS1 gene, which encodes Gal-1 protein. Although differential expression of LGALS1 in human HCC specimens was not the most important one statistically, this gene is the most interesting among those identified because Gal-1 is involved in various aspects of tumorigenesis and has been described as a promising cancer target (11–13). The mechanisms related to how Gal-1 contributes to cancer progression and metastasis have been proposed: it regulates tumor cell growth (74), triggers the death of infiltrating T cells (75), suppresses T-cell–derived proinflammatory cytokine secretion (76), mediates cell–cell or cell–extracellular matrix adhesion (77,78), is involved in tumor angiogenesis (79) and promotes cancer cell migration (24,80).
We observed the increased expression of LGALS1 in HCC specimens compared with cirrhotic tissues. Furthermore, we observed preferential accumulation of Gal-1 in the delicate stromal tissue surrounding neoplastic hepatocytes of HCC tumors. Because Gal-1 protein is secreted and can be found on the extra-cellular side of all cell membranes as well as in the extracellular matrices of various normal and neoplastic tissues ((77,80–85)), we hypothesize that the significant decrease of Gal-1 expression in the hepatocytes of HCC and its significant corresponding increase in the stromal tissue surrounding neoplastic hepatocytes of HCC could be due to the increased secretion of Gal-1 by neoplastic hepatocytes and its accumulation in the stroma surrounding HCC. In support of our hypothesis, an increased secretion of Gal-1 in conditioned medium of JHH-6 cells compared with HuH-7 cells was observed (data not shown). Our findings are in accordance with previously reported studies showing Gal-1 increased expression in human thyroid (14–16), endometrium (17), head and neck (18), thymus (19), bladder (20), pancreas (21) and colon cancers (22) and cholangiocarcinoma (23) and glioma (24). Moreover, preferential accumulation of Gal-1 in the peritumoral stroma has been reported for thyroid (16), head and neck (18), colon (22), ovary (77) and prostate carcinoma (86). Gal-1 expression was significantly increased in HCCs with metastasis compared with those without metastatic disease. The correlation between Gal-1 expression and metastasis was validated by in vitro functional studies. Our findings show Gal-1 expression affects the invasiveness of HCC cells. In line with the findings of Fulcher et al. (87), the Gal-1–induced migration and invasion in HuH-7 cells were mediated by the stimulation of Syk phosphorylation. Therefore, our data correlate Gal-1 expression with tumor aggressiveness, which is in accordance with findings in breast cancer (25), neuroblastoma (26), oral squamous cell carcinoma and lung adenocarcinoma (27). Metastasis is a multistep process during which cancer cells escape from their original tissue, invade the surrounding tissues of the primary tumor, penetrate a lymphatic or blood vessel, reach distal sites, extravasate and colonize in the second organ (88,89). Increased invasiveness of cancer cells is a critical step in tumor metastasis and requires many changes; for example, cancer cells loosen their adhesion to neighboring cells and the extracellular matrix, degrade adjacent tissues and elevate their motility (90). Aberrant gene expression changes or gene mutations in tumor cells or carcinoma-associated stromal cells increase their malignancy and accelerate cancer progression. Several chromosomal aberrations and genes were positively related to HCC invasion and metastasis (91,92). Our data provide evidence that Gal-1 also affects the invasive ability of HCC cells. Therefore, further studies should be conducted both to fully unravel the role of Gal-1 in HCC pathogenesis and to evaluate Gal-1 as a molecular therapeutic target for HCC.
In conclusion, this study provides a portfolio of targets useful for future investigations into molecular-marker discovery studies on many patients and functional assays. These further studies could lead to the identification of markers that can be used to predict diagnosis and prognosis of HCC, may provide further insight into the mechanisms of pathogenesis and could also highlight new potential therapeutic targets for patients with this disease.
Supplemental Data
ACKNOWLEDGMENTS
This work was supported by grants from MIUR (P35/126/IND), Regione Campania (DGRC 2362/07), Associazione Italiana per la Ricerca sul Cancro AIRC and in-house grant of Centro Studi Fegato from Fondazione Italiana Fegato . The salary of D Spano was supported by Ministero dell’Università e della Ricerca Italiano, grants for MUR-P35/126/IND and by BIOGEM s.c.a.r.L., grant for European Transcriptome, Regulome & Cellular Commitment (EUTRACC) N. 037445. M Capasso is a fellow of Fondazione Italiana per la Ricerca sul Cancro, FIRC. We thank the Array Facility at BIOGEM Institute for the array hybridization. This study was approved by the Ethics Committee of the University “Federico II” of Naples. All participants of this study signed an informed consent form.
Footnotes
Online address: http://www.molmed.org
DISCLOSURE
The authors declare that they have no competing interests as defined by Molecular Medicine, or other interests that might be perceived to influence the results and discussion reported in this paper.
REFERENCES
- 1.Parkin DM, Bray F, Ferlay J, Pisani P. Global cancer statistics, 2002. CA Cancer J Clin. 2005;55:74–108. doi: 10.3322/canjclin.55.2.74. [DOI] [PubMed] [Google Scholar]
- 2.Tang ZY. Hepatocellular carcinoma—cause, treatment and metastasis. World J Gastroenterol. 2001;7:445–54. doi: 10.3748/wjg.v7.i4.445. [DOI] [PMC free article] [PubMed] [Google Scholar]
- 3.Yuki K, Hirohashi S, Sakamoto M, Kanai T, Shimosato Y. Growth and spread of hepato-cellular carcinoma: a review of 240 consecutive autopsy cases. Cancer. 1990;66:2174–9. doi: 10.1002/1097-0142(19901115)66:10<2174::aid-cncr2820661022>3.0.co;2-a. [DOI] [PubMed] [Google Scholar]
- 4.Nakakura EK, Choti MA. Management of hepatocellular carcinoma. Oncology (Williston Park) 2000;14:1085–98. [PubMed] [Google Scholar]
- 5.El-Serag HB, Rudolph KL. Hepatocellular carcinoma: epidemiology and molecular carcinogenesis. Gastroenterology. 2007;132:2557–76. doi: 10.1053/j.gastro.2007.04.061. [DOI] [PubMed] [Google Scholar]
- 6.Nakabayashi H, Taketa K, Miyano K, Yamane T, Sato J. Growth of human hepatoma cells lines with differentiated functions in chemically defined medium. Cancer Res. 1982;42:3858–63. [PubMed] [Google Scholar]
- 7.Nakabayashi H, et al. Phenotypical stability of a human hepatoma cell line, HuH-7, in long-term culture with chemically defined medium. Gann. 1984;75:151–8. [PubMed] [Google Scholar]
- 8.Nakabayashi H, Taketa K, Yamane T, Oda M, Sato J. Hormonal control of alpha-fetoprotein secretion in human hepatoma cell lines proliferating in chemically defined medium. Cancer Res. 1985;45:6379–83. [PubMed] [Google Scholar]
- 9.Fujise K, et al. Integration of hepatitis B virus DNA into cells of six established human hepatocellular carcinoma cell lines. Hepatogastroenterology. 1990;37:457–60. [PubMed] [Google Scholar]
- 10.Nagamori S, et al. Protein secretion of human cultured liver cells. Hum Cell. 1988;1:382–90. [PubMed] [Google Scholar]
- 11.Liu FT, Rabinovich GA. Galectins as modulators of tumour progression. Nat Rev Cancer. 2005;5:29–41. doi: 10.1038/nrc1527. [DOI] [PubMed] [Google Scholar]
- 12.Rabinovich GA. Galectin-1 as a potential cancer target. Br J Cancer. 2005;92:1188–92. doi: 10.1038/sj.bjc.6602493. [DOI] [PMC free article] [PubMed] [Google Scholar]
- 13.Salatino M, et al. Galectin-1 as a potential therapeutic target in autoimmune disorders and cancer. Expert Opin Biol Ther. 2008;8:45–57. doi: 10.1517/14712598.8.1.45. [DOI] [PubMed] [Google Scholar]
- 14.Chiariotti L, et al. Increased expression of the negative growth factor, galactoside-binding protein, gene in transformed thyroid cells and in human thyroid carcinomas. Oncogene. 1992;7:2507–11. [PubMed] [Google Scholar]
- 15.Chiariotti L, et al. Expression of galectin-1 in normal human thyroid gland and in differentiated and poorly differentiated thyroid tumors. Int J Cancer. 1995;64:171–5. doi: 10.1002/ijc.2910640305. [DOI] [PubMed] [Google Scholar]
- 16.Xu XC, el-Naggar AK, Lotan R. Differential expression of galectin-1 and galectin-3 in thyroid tumours: potential diagnostic implications. Am J Pathol. 1995;147:815–22. [PMC free article] [PubMed] [Google Scholar]
- 17.van den Brule FA, et al. Expression of the 67-kD laminin receptor, galectin-1, and galectin-3 in advanced human uterine adenocarcinoma. Hum Pathol. 1996;27:1185–91. doi: 10.1016/s0046-8177(96)90313-5. [DOI] [PubMed] [Google Scholar]
- 18.Gillenwater A, Xu XC, el-Naggar AK, Clayman GL, Lotan R. Expression of galectins in head and neck squamous cell carcinoma. Head Neck. 1996;18:422–32. doi: 10.1002/(SICI)1097-0347(199609/10)18:5<422::AID-HED5>3.0.CO;2-7. [DOI] [PubMed] [Google Scholar]
- 19.Hafer-Macko C, Pang M, Seilhamer JJ, Baum LG. Galectin-1 is expressed by thymic epithelial cells in myasthenia gravis. Glycoconj J. 1996;13:591–7. doi: 10.1007/BF00731447. [DOI] [PubMed] [Google Scholar]
- 20.Cindolo L, et al. Galectin-1 and galectin-3 expression in human bladder transitional-cell carcinomas. Int J Cancer. 1999;84:39–43. doi: 10.1002/(sici)1097-0215(19990219)84:1<39::aid-ijc8>3.0.co;2-e. [DOI] [PubMed] [Google Scholar]
- 21.Berberat PO, et al. Comparative analysis of galectins in primary tumours and tumour metastasis in human pancreatic cancer. J Histochem Cytochem. 2001;49:539–49. doi: 10.1177/002215540104900414. [DOI] [PubMed] [Google Scholar]
- 22.Sanjuán X, et al. Differential expression of galectin 3 and galectin 1 in colorectal cancer progression. Gastroenterology. 1997;113:1906–15. doi: 10.1016/s0016-5085(97)70010-6. [DOI] [PubMed] [Google Scholar]
- 23.Shimonishi T, et al. Expression of endogenous galectin-1 and galectin-3 in intrahepatic cholangiocarcinoma. Hum Pathol. 2001;32:302–10. doi: 10.1053/hupa.2001.22767. [DOI] [PubMed] [Google Scholar]
- 24.Rorive S, et al. Galectin-1 is highly expressed in human gliomas with relevance for modulation of invasion of tumour astrocytes into the brain parenchyma. Glia. 2001;33:241–55. doi: 10.1002/1098-1136(200103)33:3<241::aid-glia1023>3.0.co;2-1. [DOI] [PubMed] [Google Scholar]
- 25.Jung EJ, et al. Galectin-1 expression in cancer-associated stromal cells correlates tumor invasiveness and tumor progression in breast cancer. Int J Cancer. 2007;120:2331–8. doi: 10.1002/ijc.22434. [DOI] [PubMed] [Google Scholar]
- 26.Cimmino F, et al. Galectin-1 is a major effector of TrkB-mediated neuroblastoma aggressiveness. Oncogene. 2009;28:2015–23. doi: 10.1038/onc.2009.70. [DOI] [PubMed] [Google Scholar]
- 27.Wu MH, et al. Galectin-1-mediated tumor invasion and metastasis, up-regulated matrix metalloproteinase expression, and reorganized actin cytoskeletons. Mol Cancer Res. 2009;7:311–8. doi: 10.1158/1541-7786.MCR-08-0297. [DOI] [PubMed] [Google Scholar]
- 28.Kondoh N, et al. Activation of Galectin-1 gene in human hepatocellular carcinoma involves methylation-sensitive complex formations at the transcriptional upstream and downstream elements. Int J Oncol. 2003;23:1575–83. [PubMed] [Google Scholar]
- 29.Irizarry RA, et al. Summaries of Affymetrix GeneChip probe level data. Nucleic Acids Res. 2003;31:e15. doi: 10.1093/nar/gng015. [DOI] [PMC free article] [PubMed] [Google Scholar]
- 30.Capasso M, et al. Cytokine gene polymorphisms in Italian preterm infants: association between interleukin-10 –1082 G/A polymorphism and respiratory distress syndrome. Pediatr Res. 2007;61:313–7. doi: 10.1203/pdr.0b013e318030d108. [DOI] [PubMed] [Google Scholar]
- 31.Livak KJ, Schmitteng TD. Analysis of relative gene expression data using real-time quantitative PCR and the 2(-Delta Delta C(T)) Methods. 2001;25:402–8. doi: 10.1006/meth.2001.1262. [DOI] [PubMed] [Google Scholar]
- 32.Bruix J, Sherman M Practice Guidelines Committee, American Association for the Study of Liver Diseases. Management of hepatocellular carcinoma. Hepatology. 2005;42:1208–36. doi: 10.1002/hep.20933. [DOI] [PubMed] [Google Scholar]
- 33.Edmondson HA, Steiner PE. Primary carcinoma of the liver: a study of 100 cases among 48,900 necropsies. Cancer. 1954;7:462–503. doi: 10.1002/1097-0142(195405)7:3<462::aid-cncr2820070308>3.0.co;2-e. [DOI] [PubMed] [Google Scholar]
- 34.Zanca C, et al. PED is overexpressed and mediates TRAIL resistance in human non-small cell lung cancer. J Cell Mol Med. 2008;12:2416–26. doi: 10.1111/j.1582-4934.2008.00283.x. [DOI] [PMC free article] [PubMed] [Google Scholar]
- 35.Cimmino F, et al. Comparative proteomic expression profile in all-trans retinoic acid differentiated neuroblastoma cell line. J Proteome Res. 2007;6:2550–64. doi: 10.1021/pr060701g. [DOI] [PubMed] [Google Scholar]
- 36.Luo JH, et al. Transcriptomic and genomic analysis of human hepatocellular carcinomas and hepatoblastomas. Hepatology. 2006;44:1012–24. doi: 10.1002/hep.21328. [DOI] [PMC free article] [PubMed] [Google Scholar]
- 37.Jia HL, et al. Gene expression profiling reveals potential biomarkers of human hepatocellular carcinoma. Clin Cancer Res. 2007;13:1133–9. doi: 10.1158/1078-0432.CCR-06-1025. [DOI] [PubMed] [Google Scholar]
- 38.Kim BY, et al. Feature genes of hepatitis B virus-positive hepatocellular carcinoma, established by its molecular discrimination approach using prediction analysis of microarray. Biochim Biophys Acta. 2004;1739:50–61. doi: 10.1016/j.bbadis.2004.07.004. [DOI] [PubMed] [Google Scholar]
- 39.Nam SW, et al. Molecular changes from dysplastic nodule to hepatocellular carcinoma through gene expression profiling. Hepatology. 2005;42:809–18. doi: 10.1002/hep.20878. [DOI] [PubMed] [Google Scholar]
- 40.Llovet JM, et al. A molecular signature to discriminate dysplastic nodules from early hepatocellular carcinoma in HCV cirrhosis. Gastroenterology. 2006;131:1758–67. doi: 10.1053/j.gastro.2006.09.014. [DOI] [PubMed] [Google Scholar]
- 41.Wurmbach E, et al. Genome-wide molecular profiles of HCV-induced dysplasia and hepatocellular carcinoma. Hepatology. 2007;45:938–47. doi: 10.1002/hep.21622. [DOI] [PubMed] [Google Scholar]
- 42.Breuhahn K, et al. Molecular profiling of human hepatocellular carcinoma defines mutually exclusive interferon regulation and insulin-like growth factor II overexpression. Cancer Res. 2004;64:6058–64. doi: 10.1158/0008-5472.CAN-04-0292. [DOI] [PubMed] [Google Scholar]
- 43.Chiang DY, et al. Focal gains of VEGFA and molecular classification of hepatocellular carcinoma. Cancer Res. 2008;68:6779–88. doi: 10.1158/0008-5472.CAN-08-0742. [DOI] [PMC free article] [PubMed] [Google Scholar]
- 44.Lee JS, et al. Classification and prediction of survival in hepatocellular carcinoma by gene expression profiling. Hepatology. 2004;40:667–76. doi: 10.1002/hep.20375. [DOI] [PubMed] [Google Scholar]
- 45.Hoshida Y, et al. Gene expression in fixed tissues and outcome in hepatocellular carcinoma. N Engl J Med. 2008;359:1995–2004. doi: 10.1056/NEJMoa0804525. [DOI] [PMC free article] [PubMed] [Google Scholar]
- 46.Braconi C, et al. Candidate therapeutic agents for hepatocellular cancer can be identified from phenotype-associated gene expression signatures. Cancer. 2009;115:3738–48. doi: 10.1002/cncr.24417. [DOI] [PubMed] [Google Scholar]
- 47.Aoka Y, et al. The embryonic angiogenic factor Del1 accelerates tumor growth by enhancing vascular formation. Microvasc Res. 2002;64:148–61. doi: 10.1006/mvre.2002.2414. [DOI] [PubMed] [Google Scholar]
- 48.Niu JX, et al. The role of adhesion molecules, alpha v beta 3, alpha v beta 5 and their lig-ands in the tumor cell and endothelial cell adhesion. Eur J Cancer Prev. 2007;16:517–27. doi: 10.1097/CEJ.0b013e3280145c00. [DOI] [PubMed] [Google Scholar]
- 49.Aoki M, et al. Expression of developmentally regulated endothelial cell locus 1 was induced by tumor-derived factors including VEGF. Biochem Biophys Res Commun. 2005;333:990–5. doi: 10.1016/j.bbrc.2005.06.009. [DOI] [PubMed] [Google Scholar]
- 50.Hirohashi K, et al. CD44 and VEGF expression in extrahepatic metastasis of human hepato-cellular carcinoma. Hepatogastroenterology. 2004;51:1121–3. [PubMed] [Google Scholar]
- 51.Jackson CL, Casanova JE. Turning on ARF: the Sec7 family of guanine-nucleotide-exchange factors. Trends Cell Biol. 2000;10:60–7. doi: 10.1016/s0962-8924(99)01699-2. [DOI] [PubMed] [Google Scholar]
- 52.Kittler R, et al. An endoribonuclease-prepared siRNA screen in human cells identifies genes essential for cell division. Nature. 2004;432:1036–40. doi: 10.1038/nature03159. [DOI] [PubMed] [Google Scholar]
- 53.Merzdorf CS. Emerging roles for zic genes in early development. Dev Dyn. 2007;236:922–40. doi: 10.1002/dvdy.21098. [DOI] [PubMed] [Google Scholar]
- 54.Grinberg I, Millen KJ. The ZIC gene family in development and disease. Clin Genet. 2005;67:290–6. doi: 10.1111/j.1399-0004.2005.00418.x. [DOI] [PubMed] [Google Scholar]
- 55.Yokota N, et al. Predominant expression of human zic in cerebellar granule cell lineage and medulloblastoma. Cancer Res. 1996;56:377–83. [PubMed] [Google Scholar]
- 56.Güre AO, et al. Serological identification of embryonic neural proteins as highly immunogenic tumor antigens in small cell lung cancer. Proc Natl Acad Sci U S A. 2000;97:4198–203. doi: 10.1073/pnas.97.8.4198. [DOI] [PMC free article] [PubMed] [Google Scholar]
- 57.Bidus MA, et al. Prediction of lymph node metastasis in patients with endometrioid endometrial cancer using expression microarray. Clin Cancer Res. 2006;12:83–8. doi: 10.1158/1078-0432.CCR-05-0835. [DOI] [PubMed] [Google Scholar]
- 58.Cheng F, Zagon IS, Verderame MF, McLaughlin PJ. The opioid growth factor (OGF)-OGF receptor axis uses the p16 pathway to inhibit head and neck cancer. Cancer Res. 2007;67:10511–8. doi: 10.1158/0008-5472.CAN-07-1922. [DOI] [PubMed] [Google Scholar]
- 59.Cheng F, McLaughlin PJ, Verderame MF, Zagon IS. The OGF-OGFr axis utilizes the p21 pathway to restrict progression of human pancreatic cancer. Mol Cancer. 2008;7:5. doi: 10.1186/1476-4598-7-5. [DOI] [PMC free article] [PubMed] [Google Scholar]
- 60.Zagon IS, Verderame MF, McLaughlin PJ. The biology of the opioid growth factor receptor (OGFr) Brain Res Brain Res Rev. 2002;38:351–76. doi: 10.1016/s0165-0173(01)00160-6. [DOI] [PubMed] [Google Scholar]
- 61.Niggli V, Rossy J. Ezrin/radixin/moesin: versatile controllers of signaling molecules and of the cortical cytoskeleton. Int J Biochem Cell Biol. 2008;40:344–9. doi: 10.1016/j.biocel.2007.02.012. [DOI] [PubMed] [Google Scholar]
- 62.Amieva MR, Furthmayr H. Subcellular localization of moesin in dynamic filopodia, retraction fibers, and other structures involved in substrate exploration, attachment, and cell-cell contacts. Exp Cell Res. 1995;219:180–96. doi: 10.1006/excr.1995.1218. [DOI] [PubMed] [Google Scholar]
- 63.Beer HD, et al. The estrogen-responsive B box protein: a novel regulator of keratinocyte differentiation. J Biol Chem. 2002;277:20740–9. doi: 10.1074/jbc.M111233200. [DOI] [PubMed] [Google Scholar]
- 64.Cheung BB, et al. The estrogen-responsive B box protein is a novel regulator of the retinoid signal. J Biol Chem. 2006;281:18246–56. doi: 10.1074/jbc.M600879200. [DOI] [PubMed] [Google Scholar]
- 65.Raif A, et al. The estrogen-responsive B box protein (EBBP) restores retinoid sensitivity in retinoid-resistant cancer cells via effects on his-tone acetylation. Cancer Lett. 2009;277:82–90. doi: 10.1016/j.canlet.2008.11.030. [DOI] [PubMed] [Google Scholar]
- 66.Munding C, et al. The estrogen-responsive B box protein: a novel enhancer of interleukin-1beta secretion. Cell Death Differ. 2006;13:1938–49. doi: 10.1038/sj.cdd.4401896. [DOI] [PubMed] [Google Scholar]
- 67.Penning TM, et al. Human 3a-hydroxysteroid dehydrogenase isoforms (AKR1C1–AKR1C4) of the aldo-keto reductase superfamily: functional plasticity and tissue distribution reveals roles in the inactivation and formation of male and female sex hormones. Biochem J. 2000;351:67–77. doi: 10.1042/0264-6021:3510067. [DOI] [PMC free article] [PubMed] [Google Scholar]
- 68.Penning TM, et al. Aldo-keto reductase (AKR) 1C3: role in prostate disease and the development of specific inhibitors. Mol Cell Endocrinol. 2006;248:182–91. doi: 10.1016/j.mce.2005.12.009. [DOI] [PubMed] [Google Scholar]
- 69.Lin HK, Steckelbroeck S, Fung KM, Jones AN, Penning TM. Characterization of a monoclonal antibody for human aldo-keto reductase AKR1C3 (type 2 3alpha-hydroxysteroid dehydro-genase/type 5 17beta-hydroxysteroid dehydro-genase); immunohistochemical detection in breast and prostate. Steroids. 2004;69:795–801. doi: 10.1016/j.steroids.2004.09.014. [DOI] [PubMed] [Google Scholar]
- 70.Fung KM, et al. Increased expression of type 2 3alpha-hydroxysteroid dehydrogenase/ type 5 17beta-hydroxysteroid dehydrogenase (AKR1C3) and its relationship with androgen receptor in prostate carcinoma. Endocr Relat Cancer. 2006;13:169–80. doi: 10.1677/erc.1.01048. [DOI] [PubMed] [Google Scholar]
- 71.Amin SA, et al. Paracrine-stimulated gene expression profile favors estradiol production in breast tumors. Mol Cell Endocrinol. 2006;253:44–55. doi: 10.1016/j.mce.2006.04.029. [DOI] [PubMed] [Google Scholar]
- 72.Rizner TL, Smuc T, Rupreht R, Sinkovec J, Penning TM. AKR1C1 and AKR1C3 may determine progesterone and estrogen ratios in endometrial cancer. Mol Cell Endocrinol. 2006;248:126–35. doi: 10.1016/j.mce.2005.10.009. [DOI] [PubMed] [Google Scholar]
- 73.Bauman DR, Steckelbroeck S, Penning TM. The roles of aldo-keto reductases in steroid hormone action. Drug News Perspect. 2004;17:563–78. doi: 10.1358/dnp.2004.17.9.872570. [DOI] [PubMed] [Google Scholar]
- 74.Yamaoka K, et al. Expression of galectin-1 mRNA correlates with the malignant potential of human gliomas and expression of antisense galectin-1 inhibits the growth of 9 glioma cells. J Neurosci Res. 2000;59:722–30. doi: 10.1002/(SICI)1097-4547(20000315)59:6<722::AID-JNR4>3.0.CO;2-H. [DOI] [PubMed] [Google Scholar]
- 75.Perillo NL, Pace KE, Seilhamer JJ, Baum LG. Apoptosis of T cells mediated by galectin- 1. Nature. 1995;378:736–9. doi: 10.1038/378736a0. [DOI] [PubMed] [Google Scholar]
- 76.Rabinovich GA, et al. Specific inhibition of T-cell adhesion to extracellular matrix and proinflammatory cytokine secretion by human recombinant galectin-1. Immunology. 1999;97:100–6. doi: 10.1046/j.1365-2567.1999.00746.x. [DOI] [PMC free article] [PubMed] [Google Scholar]
- 77.van den BrÛle F, et al. Galectin-1 accumulation in the ovary carcinoma peritumoural stroma is induced by ovary carcinoma cells and affects both cancer cell proliferation and adhesion to laminin-1 and fibronectin. Lab Invest. 2003;83:377–86. doi: 10.1097/01.lab.0000059949.01480.40. [DOI] [PubMed] [Google Scholar]
- 78.Grassadonia A, et al. 90K (Mac-2 BP) and galectins in tumor progression and metastasis. Glycoconj J. 2004;19:551–6. doi: 10.1023/B:GLYC.0000014085.00706.d4. [DOI] [PubMed] [Google Scholar]
- 79.Thijssen VL, et al. Galectin-1 is essential in tumor angiogenesis and is a target for antiangiogenesis therapy. Proc Natl Acad Sci U S A. 2006;103:15975–80. doi: 10.1073/pnas.0603883103. [DOI] [PMC free article] [PubMed] [Google Scholar]
- 80.Camby I, et al. Galectin-1 modulates human glioblastoma cell migration into the brain through modifications to the actin cytoskeleton and levels of expression of small GTPases. J Neuropathol Exp Neurol. 2002;61:585–96. doi: 10.1093/jnen/61.7.585. [DOI] [PubMed] [Google Scholar]
- 81.Cooper DN, Barondes SH. Evidence for export of a muscle lectin from cytosol to extracellular matrix and for a novel secretory mechanism. J Cell Biol. 1990;110:1681–91. doi: 10.1083/jcb.110.5.1681. [DOI] [PMC free article] [PubMed] [Google Scholar]
- 82.Van den BrÛle FA, et al. Differential expression of galectin-1 and galectin-3 during first trimester human embryogenesis. Dev Dyn. 1997;209:399–405. doi: 10.1002/(SICI)1097-0177(199708)209:4<399::AID-AJA7>3.0.CO;2-D. [DOI] [PubMed] [Google Scholar]
- 83.Clausse N, van den BrÛle F, Waltregny D, Garnier F, Castronovo V. Galectin-1 expression in prostate tumor-associated capillary endothelial cells is increased by prostate carcinoma cells and modulates heterotypic cell-cell adhesion. Angiogenesis. 1999;3:317–25. doi: 10.1023/a:1026584523789. [DOI] [PubMed] [Google Scholar]
- 84.Danguy A, Camby I, Kiss R. Galectins and cancer. Biochim Biophys Acta. 2002;1572:285–93. doi: 10.1016/s0304-4165(02)00315-x. [DOI] [PubMed] [Google Scholar]
- 85.von Wolff M, Wang X, Gabius HJ, Strowitzki T. Galectin fingerprinting in human endometrium and decidua during the menstrual cycle and in early gestation. Mol Hum Reprod. 2005;11:189–94. doi: 10.1093/molehr/gah144. [DOI] [PubMed] [Google Scholar]
- 86.van den BrÛle FA, Waltregny D, Castronovo V. Increased expression of galectin-1 in carcinoma-associated stroma predicts poor outcome in prostate carcinoma patients. J Pathol. 2001;193:80–7. doi: 10.1002/1096-9896(2000)9999:9999<::AID-PATH730>3.0.CO;2-2. [DOI] [PubMed] [Google Scholar]
- 87.Fulcher JA, et al. Galectin-1 co-clusters CD43/CD45 on dendritic cells and induces cell activation and migration through Syk and protein kinase C signaling. J Biol Chem. 2009;25;284:26860–70. doi: 10.1074/jbc.M109.037507. [DOI] [PMC free article] [PubMed] [Google Scholar]
- 88.Deryugina EI, Quigley JP. Matrix metallo-proteinases and tumor metastasis. Cancer Metastasis Rev. 2006;25:9–34. doi: 10.1007/s10555-006-7886-9. [DOI] [PubMed] [Google Scholar]
- 89.Fidler IJ. The pathogenesis of cancer metastasis: the ‘seed and soil’ hypothesis revisited. Nat Rev Cancer. 2003;3:453–8. doi: 10.1038/nrc1098. [DOI] [PubMed] [Google Scholar]
- 90.Steeg PS. Tumor metastasis: mechanistic insights and clinical challenges. Nat Med. 2006;12:895–904. doi: 10.1038/nm1469. [DOI] [PubMed] [Google Scholar]
- 91.Feitelson MA, et al. Genetic mechanisms of hepatocarcinogenesis. Oncogene. 2002;21:2593–604. doi: 10.1038/sj.onc.1205434. [DOI] [PubMed] [Google Scholar]
- 92.Tang ZY, et al. A decade’s studies on metastasis of hepatocellular carcinoma. J Cancer Res Clin Oncol. 2004;130:187–96. doi: 10.1007/s00432-003-0511-1. [DOI] [PMC free article] [PubMed] [Google Scholar]
Associated Data
This section collects any data citations, data availability statements, or supplementary materials included in this article.