Abstract
Background & Aims:
Cholestasis is one of the principal manifestations of liver disease and often results from disorders involving bile duct epithelia rather than hepatocytes. A range of disorders affects biliary epithelia, and no unifying pathophysiologic event in these cells has been identified as the cause of cholestasis. Here we examined the role of the inositol 1,4,5-trisphosphate receptor (InsP3R)/Ca2+ release channel in Ca2+ signaling and ductular secretion in animal models of cholestasis and in patients with cholestatic disorders.
Methods:
The expression and distribution of the InsP3R and related proteins were examined in rat cholangiocytes before and after bile duct ligation or treatment with endotoxin. Ca2+ signaling was examined in isolated bile ducts from these animals, whereas ductular bicarbonate secretion was examined in isolated perfused livers. Confocal immunofluorescence was used to examine cholangiocyte InsP3R expression in human liver biopsy specimens.
Results:
Expression of the InsP3R was selectively lost from biliary epithelia after bile duct ligation or endotoxin treatment. As a result, Ca2+ signaling and Ca2+-mediated bicarbonate secretion were lost as well, although other components of the Ca2+ signaling pathway and adenosine 3′,5′-cyclic monophosphate (cAMP)-mediated bicarbonate secretion both were preserved. Examination of human liver biopsy specimens showed that InsP3Rs also were lost from bile duct epithelia in a range of human cholestatic disorders, although InsP3R expression was intact in noncholestatic liver disease.
Conclusions:
InsP3-mediated Ca2+ signaling in bile duct epithelia appears to be important for normal bile secretion in the liver, and loss of InsP3Rs may be a final common pathway for cholestasis.
Bile secretion is one of the primary functions of the liver, and disorders that result in cholestasis are among the most serious forms of liver disease. Over 20% of liver transplants in the United States are performed for chronic cholestatic conditions, and 50% of liver transplants among pediatric patients are performed for such disorders.1 Most cholestatic liver disorders result from diseases affecting the epithelia that line the biliary tree.2,3 The most thoroughly characterized pathway for fluid and electrolyte secretion in bile duct epithelia is activated by secretin, mediated by adenosine 3′,5′-cyclic monophosphate (cAMP), and links to chloride and bicarbonate secretion via the cystic fibrosis transmembrane conductance regulator (CFTR).4,5 Secretin and its second messenger cAMP also stimulate other aspects of secretion in bile duct epithelia, including targeting and insertion of apical aquaporins6 and stimulation of exocytosis.7 However, components of these secretory pathways are not decreased in animal models of cholestasis,8,9 and there is no evidence that these pathways generally are defective in human cholestatic conditions. Therefore, the molecular basis for cholestasis in such conditions has been unclear.
There is also an alternative, Ca2+-mediated pathway for secretion in bile duct epithelia.4 These cells express both basolateral M3 muscarinic acetylcholine (ACh) receptors10 and apical P2Y nucleotide receptors,11,12 and stimulation of either type of receptor leads to inositol 1,4,5-trisphosphate (InsP3)-mediated Ca2+ signaling.13 Increases in cytosolic Ca2+ (Cai2+) in turn activate Ca2+-dependent chloride channels and subsequently chloride-bicarbonate exchange, which ultimately results in net bicarbonate secretion into bile.14,15 Therefore, we examined whether Cai2+ signaling pathways are impaired in cholestasis. This was investigated in rats subjected to common bile duct ligation (BDL), which is a widely used and well-characterized animal model of cholestasis,3 and in patients with a range of common cholestatic disorders.
Materials and Methods
Animals and Materials
Male Sprague-Dawley rats (Camm Research Lab Animals, Wayne, NJ) weighing 250–300 g were used for all experiments. Animals were housed in temperature- and light-controlled rooms and maintained on a standard diet. ACh was purchased from Sigma Chemical (St. Louis, MO). The Ca2+ dye fluo-4 in acetoxymethyl ester form, the lipophilic membrane dye DiD, and rhodamine-conjugated phalloidin were from Molecular Probes (Eugene, OR). Lipopolysaccharide (LPS) from Salmonella typhimurium and α-napthylisothiocyanate were from Sigma Chemical.
Antibodies
Type I InsP3 receptor (InsP3R) antibodies were from affinity-purified specific rabbit polyclonal antiserum directed against the 19 C-terminal residues of the mouse type I InsP3R,16 and were custom produced by Research Genetics (Huntsville, Alabama). Type II InsP3R antibodies were from affinity-purified specific rabbit polyclonal antiserum directed against the 18 C-terminal residues of the rat type II InsP3R,17 and were kindly provided by Richard J. Wojcikiewicz (State University of New York at Syracuse, Syracuse, NY). A monoclonal antibody from Transduction Laboratories (Lexington, KY) was used to label the N-terminal region of the human type III InsP3R.18 Monoclonal antibodies directed against the 19 C-terminal residues of Gαq/α11 and the 20 C-terminal residues of PLCβ319 were from Santa Cruz Biotechnology (Santa Cruz, CA). Monoclonal antibody M35 directed against the M3 muscarinic ACh receptor10 was obtained from Argene (Varilhes, France). Polyclonal antibody R3195 directed against CFTR20 was kindly provided by Christopher R. Marino (University of Tennessee, Memphis, TN). Monoclonal antibody AC-15 directed against β-actin was obtained from Sigma. The secondary antibodies were Alexa 488 anti-rabbit and anti-mouse and Alexa 647 anti-rabbit immunoglobulin G (Molecular Probes).
Cell Isolation
Bile duct epithelia were isolated from rats under normal conditions, and 48 hours, 1 week, and 2 weeks after common BDL.13,21 Bile duct epithelia also were isolated from rats after treatment with LPS or α-napthylisothiocyanate. Cholestasis of sepsis was induced by intraperitoneal injection of LPS (1 mg/kg) 24 hours before liver isolation and perfusion.22 Drug-induced cholestasis was induced by feeding a refined diet containing 0.1% α-napthylisothiocyanate (Dyets, Bethlehem, PA) for 3 weeks, as described previously.23 Briefly, rat livers were isolated and then perfused with buffer containing collagenase (Boehringer Manheim Biochemicals, Indianapolis, IN). The portal tissue residue was separated mechanically, then either cut into strips for Ca2+ measurements or processed further to obtain protein for immunoblots. For Ca2+ studies, DiD and fluo-4/acetoxymethyl ester were first co-injected into the common bile duct to facilitate identification of bile duct epithelia within portal strips.21
Immunoblot Analysis
All immunoblots were performed on bile duct cells that were prepared as described earlier. Protein concentration of cell homogenates was determined, and then proteins were separated by sodium dodecyl sulfate–polyacrylamide gel electrophoresis and transferred to nitrocellulose membranes.21,24 Membranes were blocked overnight and probed for 2 hours with isoform-specific InsP3R primary antibodies,21 then washed, incubated for 1 hour with peroxidase-conjugated anti-rabbit or anti-mouse immunoglobulin G secondary antibody, and revealed using an enhanced chemiluminescence kit from Amersham (Arlington Heights, IL). Immunoreactivity for each immunoblot was quantified using a BioRad GS-700 imaging densitometer (BioRad, Richmond, CA).
Confocal Immunofluorescence Microscopy
Immunochemistry was performed on 5-μm thick frozen sections of rat liver containing bile ducts and on paraffin-embedded sections of human liver biopsy specimens. Rat liver sections were fixed by cold acetone, blocked, labeled with primary antibody, rinsed with phosphate-buffered saline, and incubated with Alexa 488 – conjugated secondary antibody. Rat tissue also was labeled with rhodamine-conjugated phalloidin to facilitate identification of the plasma membrane21 because phalloidin labels submembranous actin. Paraffin-embedded sections were pretreated with 1 mmol/L citrate buffer at 100°C, then labeled with Alexa 488– and Alexa 647–conjugated secondary antibodies. Negative controls were performed under each experimental condition by incubating tissue with secondary antibodies but not anti-InsP3R (primary) antibodies. Only paraffin-embedded human liver specimens were available, so neither immunoblots nor Ca2+ signaling studies could be performed with cholangiocytes from these specimens. Specimens were examined using a Zeiss LSM 510 Laser Scanning Confocal Microscope (Thornwood, NY). To ensure specificity of staining, images were obtained using machine settings at which no fluorescence was detectable in negative control samples. Double-labeled rat liver specimens were excited serially at 488 nm and observed at greater than 515 nm to detect Alexa 488, then excited at 568 nm and observed at greater than 585 nm to detect rhodamine, whereas human liver specimens were excited serially at 488 nm and observed at greater than 515 nm to detect Alexa 488, then excited at 647 nm and observed at greater than 660 nm to detect Alexa 647.
Cytosolic Ca2+ Measurements
DiD (25 μmol/L) and fluo-4/acetoxymethyl ester (18 μmol/L) were co-injected into the common bile duct, then bile duct segments were isolated as described earlier, transferred to a perfusion chamber, and observed using a BioRad MRC 1024 confocal imaging system. Tissue was excited at 647 nm and observed at greater than 680 nm to identify individual DiD-labeled bile duct cells, then Cai2+ was monitored in these cells by exciting the specimen at 488 nm and detecting fluo-4 emission signals above 515 nm.21 Cells were observed with a spatial resolution of 0.20 μm/pixel and a temporal resolution of 6 ms during line scanning.21,25 Increases in Cai2+ were expressed as percent increases in fluorescence intensity of fluo-4.13,21,25
Isolated Perfused Rat Liver Studies
Liver perfusions were performed as described previously.15 Bivascular (i.e., combined portal venous and hepatic arterial) perfusions were performed in livers isolated from normal rats, whereas portal vein perfusions were performed in livers isolated after bile duct ligation. For bivascular perfusions, the liver was isolated and transferred to a temperature-controlled perfusion chamber, where both the hepatic artery and portal vein were perfused in a nonrecirculating fashion.15 Krebs-Ringer's bicarbonate buffer was infused at a speed of 30 mL/min into the portal vein and at 10 mL/min into the hepatic artery. For studies performed 2 weeks after common BDL, the isolated liver was perfused via the portal vein with Krebs-Ringer's bicarbonate at 40 mL/min. For all perfused liver studies, bile was collected gravimetrically and portal pressure was monitored continuously. Biliary bicarbonate was measured using a blood gas analyzer. Viability of each liver preparation was ascertained by monitoring perfusion pressure and O2 consumption during the course of the experiment, and by determining trypan blue distribution on completion.15
Statistics
Data are presented as mean ± SEM. For statistical analysis, means between groups were compared by the Student t test. A P value <0.05 was considered significant.
Results
InsP3Rs Are Lost From Bile Duct Epithelia After BDL
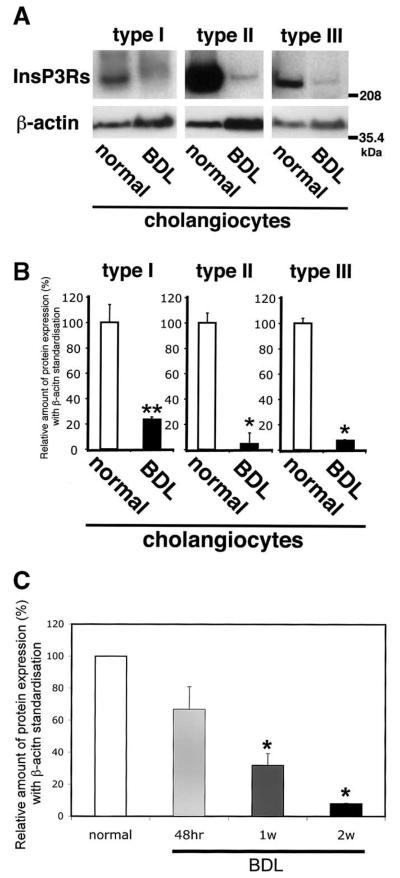
The InsP3R is the only intracellular Ca2+ release channel in bile duct epithelia, and all 3 isoforms of the receptor are expressed in these cells.21 Immunoblot analysis was performed to compare the relative protein expression of the type I, II, and III isoforms in bile duct cells before and 2 weeks after BDL. Immunoblot analysis confirmed that all 3 isoforms were expressed in normal bile duct cells, but showed that expression of each was reduced markedly after BDL (Figure 1A). Densitometric analysis (Figure 1B) showed that the type I InsP3R was reduced to 23.8% ± 1.8% of baseline (mean ± SEM), the type II isoform was reduced to 4.6% ± 8.7% of baseline, and the type III isoform was reduced to 7.9% ± 0.4% (P < 0.01 for each; n = 3). The type III InsP3R is the predominant isoform in cholangiocytes, accounting for over 80% of InsP3Rs in this cell type.21 Therefore, expression of this isoform was examined at earlier time points after BDL as well (Figure 1C). Expression of the type III InsP3R decreased progressively at 48 hours, and at 1 and 2 weeks after BDL. These data suggest that loss of InsP3Rs is a very early event in the development of cholestasis.
Figure 1.
Expression of each InsP3R isoform decreases after BDL in bile duct epithelia. (A) Western analysis using isoform-specific antibodies. Immunoblot using a polyclonal type I–specific InsP3R antibody identifies a single band in lysates from normal bile duct cells and very weak band in lysates from bile duct cells 2 weeks after BDL. Type II isoform-specific antibody CT2 identifies a strong band in lysates from normal bile duct cells and a weak band in lysates after BDL. A monoclonal type III isoform-specific InsP3R antibody also identifies a strong band in lysates from normal bile duct cells and weak band in lysates after BDL. Data were normalized by β-actin expression determined in the same blots. Amount of protein used was 100 μg in each lane. (B) Densitometric analysis of immunoblots normalized by β-actin expression. The expression of each InsP3 isoform was markedly decreased 2 weeks after BDL. Results are mean ± SEM of 3 independent experiments (*P < 0.01). (C) Type III InsP3R expression decreases progressively over time after BDL. InsP3R expression in cholangiocytes was 63.4% of baseline 48 hours after BDL, a value that was of marginal statistical significance (P = 0.07). InsP3R expression decreased to 27.2% and 7.9% of baseline 1 and 2 weeks after BDL, respectively (*P < 0.01). Results are mean ± SEM of 3 independent experiments.
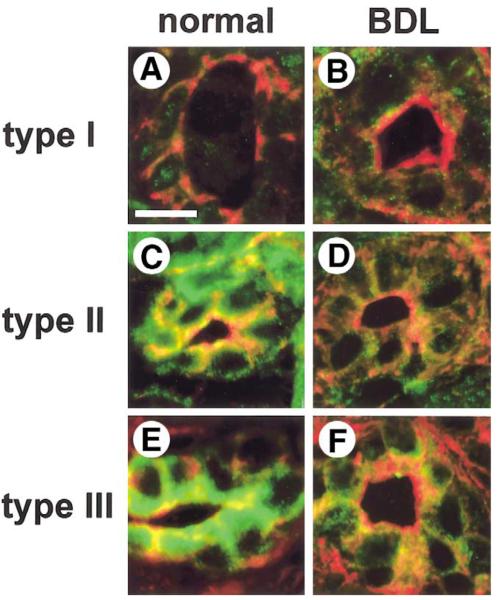
Each InsP3R isoform is distributed in a characteristic subcellular pattern in biliary epithelia,21 which may in turn affect the pattern of Cai2+ signals. Therefore, confocal immunofluorescence was performed to determine whether the subcellular distribution of the type I, II, and III InsP3Rs in bile duct cells is altered after BDL. Rat liver sections were labeled with isoform-specific InsP3R antibodies and colabeled with rhodamine-conjugated phalloidin to facilitate identification of bile duct landmarks (Figure 2). In bile ducts from normal rats, the types I and II InsP3Rs were distributed diffusely throughout the cytosol (Figure 2A and C), whereas the type III InsP3R was most concentrated in the apical region (Figure 2E), as has been described previously.21 Normal bile ducts expressed small amounts of the type I InsP3R (Figure 2A), and expression remained low 2 weeks after BDL (Figure 2B). The decrease in type II InsP3R expression after BDL was detectable more readily (Figure 2D), whereas the decrease in labeling of the type III isoform was most marked (Figure 2F). In particular, apical expression of the type III InsP3R was nearly absent after BDL. InsP3R expression also was examined in bile ducts of different sizes. In control animals, each size of cholangiocyte expressed all isoforms of the InsP3R. After BDL, expression of all 3 isoforms was decreased in each type of cholangiocyte, although the loss was most dramatic in small cholangiocytes (data not shown). Taken together with the immunoblot results, these findings show that there is a marked loss of each InsP3R isoform in bile duct epithelia 2 weeks after BDL.
Figure 2.
Subcellular distribution of each InsP3R isoform in bile duct epithelia before and after BDL, as determined by confocal immunofluorescence. Each image is double labeled with an isoform-specific antibody directed against the InsP3R (green), plus rhodamine-phalloidin (red) to identify actin beneath the plasma membrane. (A) A liver section obtained from normal rat liver, labeled with a monoclonal antibody directed against the type I InsP3R. Weak type I InsP3R labeling is seen throughout each bile duct cell. Scale bar, 10 μm. (B) A liver section obtained 2 weeks after BDL, labeled with the same type I InsP3R antibody. This shows that type I InsP3R labeling is nearly absent. (C) Distribution of the type II InsP3R in normal rat bile duct epithelia. Type II InsP3R labeling is seen throughout each cell. (D) Distribution of the type II InsP3R 2 weeks after BDL. Labeling of this isoform now is almost absent from bile duct cells. (E) A section obtained from normal rat liver, labeled with a monoclonal antibody directed against the type III InsP3R. Note that type III InsP3R labeling is concentrated in the apical region. (F) A liver section obtained 2 weeks after BDL. Type III InsP3R labeling now is nearly absent, especially apically.
Ca2+ Signaling and Ca2+-Mediated Secretion Are Disrupted After BDL
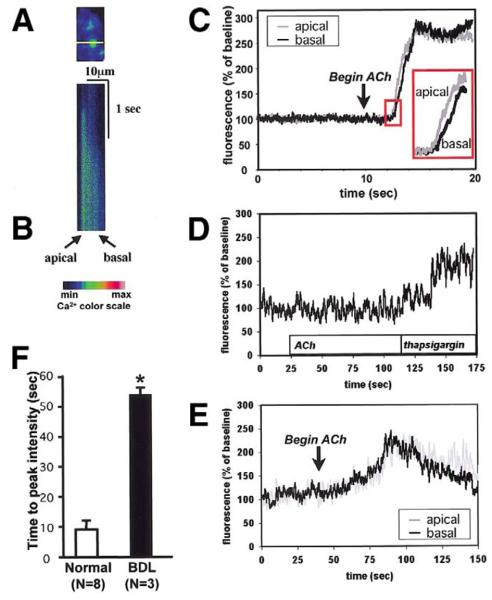
The loss of InsP3Rs in bile duct epithelia suggests that BDL would impair Cai2+ signaling as well. To investigate this, we isolated intrahepatic bile duct segments from normal and bile duct–ligated rat livers, and then examined Cai2+ signaling in individual cells within the bile duct segments using confocal microscopy (Figure 3A).21,25 Bile ducts were stimulated with ACh, which causes an InsP3-mediated increase in Cai2+ in this cell type.13 In cells from normal rat liver, ACh (10 μmol/L) caused an apical-to-basal Cai2+ wave (Figure 3B and C), similar to what has been reported previously in this21 and other25,26 polarized epithelia. In contrast to what was observed in normal bile ducts, ACh increased Cai2+ in only 3 of 19 bile duct cells after BDL. Subsequent stimulation with the Ca2+-adenosine triphosphatase (ATPase) inhibitor thapsigargin (2 μmol/L) increased Cai2+ in 17 of those cells (Figure 3D), showing that Ca2+ stores nonetheless remain intact. Moreover, in the few cells that responded to ACh after BDL, the increase in Cai2+ was much slower than in normal bile duct cells (time to peak: 53.3 ± 2.6 sec vs. 9.1 ± 2.7 sec, P < 0.01; Figure 3E and F). Moreover, no clear initiation site for Cai2+ signals was observed in bile duct-ligated cells. However, there was no difference in peak fluorescence intensity between normal bile duct cells stimulated with ACh and those cells that responded to ACh after BDL (207.8% ± 31.9% vs. 257.9% ± 12.6 %, P = 0.191). These findings suggest that the loss of expression of InsP3Rs after BDL is associated with impaired Cai2+ signaling in biliary epithelia.
Figure 3.
Cai2+ signaling is impaired in bile duct cells after BDL. (A) Confocal image of a segment from a portal tract, excited at a wavelength to reveal loading with the Ca2+ dye fluo-4. The line used for confocal line scanning microscopy is shown in yellow. The line crosses the apical-to-basal axis of one of the cells. This and the subsequent image are pseudocolored according to the color scale shown. (B) Confocal line scanning image of the cell shown in the previous image. The tissue was stimulated with ACh (100 μmol/L) as confocal fluorescence along the line was collected every 6 ms. A Cai2+ wave crosses from the apical to the basolateral pole of the cell. (C) Tracing of the apical and basolateral components of the Cai2+ signal in the cell stimulated in the previous image. Inset shows the apical increase in Cai2+ precedes the basolateral Cai2+ increase, reflecting an apical-to-basal Cai2+ wave. (D) After BDL, ACh (100 μmol/L) fails to increase Cai2+, even though Cai2+ is increased by subsequent exposure to the Ca2+-ATPase inhibitor thapsigargin (2 μmol/L). Result is representative of that seen in 16 of 19 bile duct cells. (E) The pattern of Cai2+ signaling is altered in the few cells that do respond to ACh after BDL. The Cai2+ signal reaches its peak gradually, during which time no clear apical-to-basal Cai2+ gradient is observed. (F ) Time to peak intensity of Cai2+ signals is delayed markedly after BDL. The Cai2+ increase after BDL (n = 3) was much slower than in normal bile duct cells (n = 8; *P < 0.01).
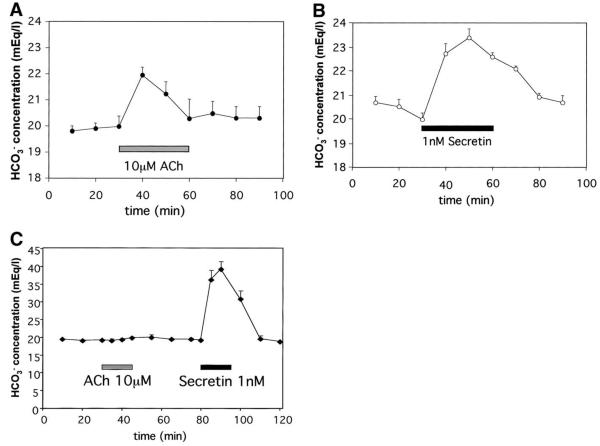
Cai2+ signaling regulates biliary bicarbonate secretion independent of cAMP.15 Therefore, biliary bicarbonate secretion was examined in the isolated perfused rat liver to determine the physiologic significance of the impaired Cai2+ signaling that occurs after BDL. Infusion of either the Ca2+ agonist ACh (10 μmol/L) or the cAMP agonist secretin (1 nmol/L) into the hepatic artery increased the biliary bicarbonate concentration under normal conditions (Figure 4A and B), consistent with previous reports.15 Much lower amounts of secretin are needed to obtain the same secretory effect as ACh, presumably because secretin is an endocrine hormone, whereas ACh is a neurotransmitter. After BDL, ACh or secretin instead was infused via the portal vein because adhesions and collateral vessel enlargement and proliferation around the hepatic artery made arterial perfusions impractical. Infusion of ACh no longer affected biliary bicarbonate, even though secretin-induced bicarbonate secretion was preserved and even enhanced (Figure 4C). Because secretin was able to reach cholangiocytes via the portal vein after BDL, it is likely that ACh was able to reach cholangiocytes by this route as well. Thus, these findings suggest that BDL results in selective impairment of Ca2+-mediated biliary bicarbonate secretion. Moreover, cAMP-mediated secretion increases after BDL, which may be a compensatory response to loss of Ca2+-mediated secretion.
Figure 4.
Ca2+-mediated bicarbonate secretion is impaired after BDL. (A) ACh (10 μmol/L) increases biliary bicarbonate concentration in normal rat liver. ACh was infused via the hepatic artery in the isolated bivascularly perfused normal rat liver. Values here and in subsequent panels are mean ± SEM of 4 separate experiments. (B) Secretin (1 nmol/L) increases biliary bicarbonate concentration in normal rat liver. Secretin was infused via the hepatic artery in the isolated bivascularly perfused normal rat liver. (C) BDL impairs ACh-induced but not secretin-induced bicarbonate secretion. Biliary bicarbonate secretion was measured in the isolated perfused rat liver 2 weeks after ligation of the common bile duct. Note that secretin-induced bicarbonate secretion actually is increased.
Upstream Components of the Ca2+ Signaling Pathway Are Preserved After BDL
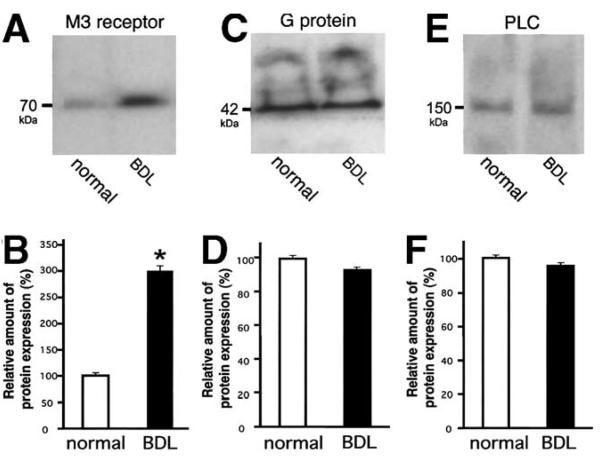
Several steps link ACh stimulation to activation of InsP3Rs to increase Cai2+ in bile duct cells. These steps include binding of ACh to the M3 muscarinic receptor, activation of an associated G protein, and then PLCβ activation.19 To determine whether any of these upstream signal transduction events also are affected by BDL, we examined expression of the M3 muscarinic ACh receptor, Gαq/α11 protein, and PLCβ3. Immunoblot analysis showed that M3 muscarinic receptor expression was not decreased after BDL (Figure 5A). In fact, densitometry showed that M3 muscarinic receptor expression actually was increased by 298% ± 9% relative to normal controls (P < 0.0005, Figure 5B), consistent with previous reports.8 The α subunits of the Gq and G11 G proteins, which are coupled to the M3 muscarinic receptor,19 were studied in normal and bile duct–ligated biliary epithelia by the same technique. The amounts of the subunits were similar under both conditions (Figure 5C and D); cells after BDL expressed 93.2% ± 2.1% of the amount of Gαq/α11 expressed by normal bile duct cells (P > 0.3). PLCβ3 was studied as well because it is the member of the PLCβ subfamily that is most sensitive to stimulation by Gαq subunits of G proteins27 and would couple to both M3 and P2Y receptors on bile duct cells.19 Protein expression after BDL was 95.2% ± 7.1% of the amount detected under normal conditions (P > 0.25). Thus, there was no significant difference in the amount of PLCβ3 in normal and bile duct-ligated bile duct cells (Figure 5E and F). Densitometric analyses for the M3 muscarinic ACh receptor, Gαq/α11 protein, and PLCβ3 also were performed using β-actin as an internal control. Those data confirm that there is a significant increase in M3 muscarinic ACh receptor (284.9% ± 51.6%, P < 0.0005) with no significant change in expression of either Gαq/α11 (38.6% ± 10.9%) or PLCβ3 (55.3% ± 1.87%) after BDL. The decreased trend for Gαq/α11 and PLCβ3 reflects the fact that β-actin expression increases slightly after BDL. Together, these findings show that the loss of responsiveness to ACh is owing to the selective loss of InsP3Rs, rather than to loss of upstream elements in the signal transduction pathway or loss of Ca2+ stores. In fact, an increase occurs in M3 receptor expression, which may represent a compensatory mechanism in response to decreased expression of InsP3R.
Figure 5.
Expression of proteins that are upstream of the InsP3R is preserved after BDL. (A) Immunoblot using M3 muscarinic ACh receptor-specific antibody identified a single band of the appropriate size in lysates from normal bile duct epithelia and a stronger band in lysates from cells isolated 2 weeks after BDL. In this and subsequent blots, 100 μg of protein was used in each lane. (B) Densitometry of M3 muscarinic receptor expression. Expression is increased after BDL (n = 3; *P < 0.01). (C) Immunoblot using Gαq/α11 protein–specific antibody identified a single band of the appropriate size in lysates from bile duct epithelia under normal conditions as well as 2 weeks after BDL (100 μg each). (D) Densitometry of Gαq/α11 protein expression. Protein expression is not altered significantly after BDL (n = 3 each). (E) Immunoblot using PLCβ3 protein–specific antibody identified a single band of the appropriate size in lysates from bile duct epithelia under normal conditions as well as 2 weeks after BDL. (F) Densitometry of PLCβ3 protein expression. Protein expression is not significantly altered after BDL (n = 3 each).
InsP3R Expression in Other Animal Models of Cholestasis
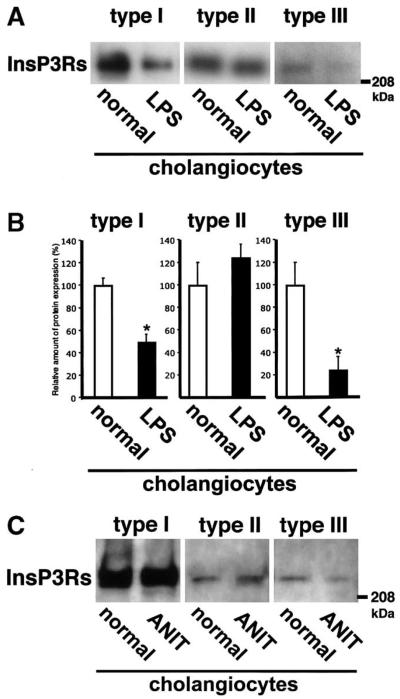
Expression of each InsP3R also was examined in 2 additional models of cholestasis. First, InsP3R expression was examined in rat cholangiocytes after treatment with LPS (Figure 6A and B) because inflammatory cytokines inhibit ductular secretion.28 Here, expression of the type I isoform was 48.8% ± 8.0% of control, whereas type III expression was 23.8% ± 13.1% of baseline (P = 0.019 and P < 0.005, respectively; n = 3). Type II InsP3R was not reduced (123.9% ± 13.1% compared with control; P = 0.27, n = 3). These data suggest that decreased InsP3R expression occurs not only during chronic cholestasis but in acute cholestatic conditions as well. InsP3R expression in rat cholangiocytes after α-napthylisothiocyanate feeding23 also was examined in a single animal. Expression of types I and II InsP3R was not reduced, but type III InsP3R expression was 42.6% of untreated controls (Figure 6C). Thus, expression of the principal InsP3R isoform in cholangiocytes is decreased in multiple models of cholestasis.
Figure 6.
InsP3R expression in animal models of cholestasis. (A) Endotoxin (LPS)-induced cholestasis. InsP3R isoform-specific immunoblots show that type I and III InsP3Rs decrease, whereas type II InsP3Rs do not. Cholestasis was induced by intraperitoneal injection of LPS (1 mg/kg) 24 hours before cholangiocyte isolation. (B) Densitometric analysis of immunoblots. The expression of type I and III InsP3 isoforms was decreased markedly 24 hours after LPS injection, whereas type III receptor expression was not. Results are mean ± SEM of 3 independent experiments (*P < 0.01). (C) Only the type III InsP3R decreases after α-napthylisothiocyanate feeding. Western blot for each isoform of the InsP3R is shown.
InsP3Rs Are Lost in Human Cholestatic Diseases
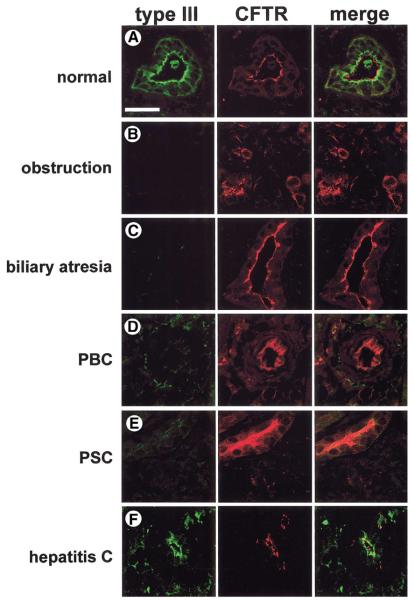
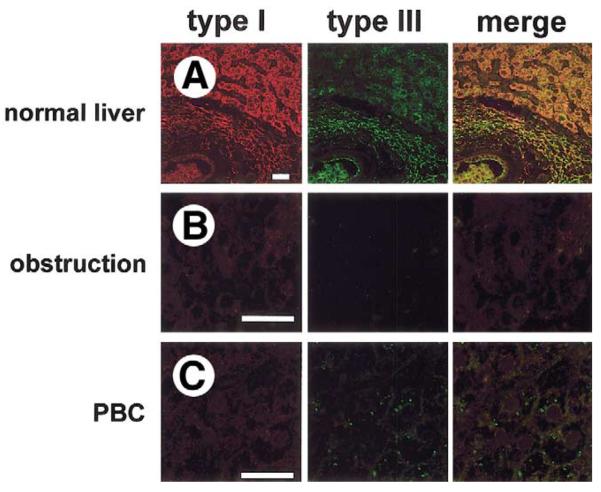
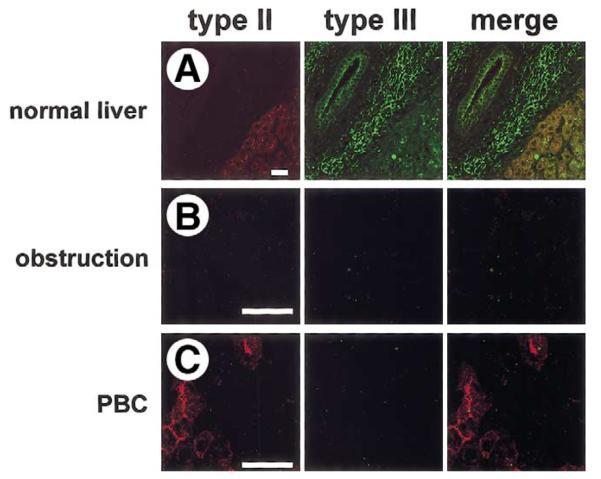
To examine the relevance of our animal studies for human disease, InsP3R expression was examined in liver biopsy specimens from normal individuals plus adult and pediatric patients with a range of cholestatic disorders. Specimens were stained with an antibody for the type III InsP3R, which is the predominant isoform in rat bile ducts.21 Because bile duct epithelia are the only cell type within liver that express CFTR,29 specimens were colabeled with an antibody for CFTR to facilitate identification of bile ducts. The type III InsP3R was expressed in human bile ducts and was concentrated in the apical region (Figure 7A), similar to what was observed in rats. InsP3R expression was decreased or absent in all patients studied who had chronic bile duct obstruction (n = 5; 3 cases from stone disease and 2 cases from malignancy; Figure 7B), also similar to what was observed in rats. Expression also was decreased or absent in all patients with biliary atresia (n = 8; age range, 4–16 wk; median, 10 wk; Figure 7C), a cholestatic condition that is the most frequent indication for liver transplant among pediatric patients. We also examined InsP3R expression in patients with primary biliary cirrhosis (n = 5; stage I: 2 cases; stage III: 3 cases; Figure 7D) and sclerosing cholangitis (n = 5; stage II, 1 case; stage III, 3 cases; stage IV, 1 case; Figure 7E), autoimmune cholestatic conditions of small and large intrahepatic bile ducts, respectively. Expression was decreased or absent in all patients tested with each of these conditions as well. Although InsP3R expression was diminished markedly in all 4 of the cholestatic conditions examined, expression of CFTR by bile duct cells was preserved. Finally, we examined InsP3R expression in a group of patients with varying stages of hepatitis C infection, ranging from portal inflammation to cirrhosis. This chronic viral infection typically damages hepatocytes but not bile duct epithelia, and generally does not result in cholestasis. Expression of the type III InsP3R was normal in these patients (n = 5; stage I, 2 cases; stage II, 2 cases; stage IV, 1 case; Figure 7F), suggesting that loss of InsP3Rs is associated with cholestatic conditions, and is not merely a nonspecific response to hepatic inflammation or injury. Expression of type I (Figure 8) and type II (Figure 9) InsP3Rs also was examined in a limited number of patient specimens. Consistent with what has been reported in rats,21 expression of both of these 2 isoforms was low in human cholangiocytes (Figures 8A and 9A). Moreover, expression of both isoforms was decreased even further in both biliary obstruction (Figures 8B and 9B) and primary biliary cirrhosis (Figures 8C and 9C). Together, these findings lend further support to the hypothesis that loss of InsP3Rs is associated with cholestasis.
Figure 7.
Expression of the type III InsP3R is decreased in the bile ducts of patients with cholestatic disorders. Confocal immunofluorescence images were obtained from paraffin-embedded liver biopsy specimens. Each tissue section was double-labeled with antibodies directed against the type III InsP3R (green) and CFTR (red). (A) Normal liver. Note that the InsP3R is localized to the apical region, but does not overlap with CFTR along the apical membrane. (B) Bile duct obstruction (n = 5; 3 cases from common duct stones and 2 cases from malignancy). Note that InsP3Rs are not detectable, even though CFTR expression is preserved. Bile duct proliferation can be seen as well, which is typical for this condition. (C) Biliary atresia (n = 8; age range, 4 -16 wk; median, 10 wk), (D) primary biliary cirrhosis (n = 5, stage I: 2 cases; stage III: 3 cases), and (E) sclerosing cholangitis (n = 5; stage II: 1 case; stage III: 3 cases; stage IV: 1 case). As in biliary obstruction, InsP3Rs also are not detectable in any of these 3 liver biopsy specimens, even though CFTR expression is preserved. (F) Hepatitis C virus (n = 5; stage I: 2 cases; stage II: 2 cases; stage IV: 1 case). InsP3R expression is preserved in this disease of hepatocytes rather than bile duct cells, despite marked inflammation in the portal region. Scale bar = 30 μm.
Figure 8.
Expression of the type I InsP3R in normal and cholestatic human liver. Confocal immunofluorescence images were obtained from paraffin-embedded liver biopsy specimens. Each tissue section was double-labeled with antibodies directed against the type I InsP3R (red) and type III InsP3R (green). Images include both hepatocytes and cholangiocytes so that relative InsP3R expression in the 2 cell types can be compared. (A) Normal liver. Expression of the type I InsP3R is low in cholangiocytes relative to hepatocytes, whereas the type III InsP3R is localized to the apical region of cholangiocytes and is absent in hepatocytes. Note that the type I InsP3R is distributed diffusely in hepatocytes, as has been reported.67. (B) Bile duct obstruction. Expression of type I InsP3R is preserved in hepatocytes, but neither type I nor type III InsP3R is detectable in cholangiocytes. Findings are representative of 3 separate biopsy specimens. (C) Primary biliary cirrhosis. Expression of type I InsP3Rs is preserved in hepatocytes, but neither type I nor type III InsP3Rs are detected in cholangiocytes. Findings are representative of 3 separate biopsy specimens. Each scale bar = 30 μm.
Figure 9.
Expression of the type II InsP3R in normal and cholestatic human liver. Confocal immunofluorescence images were obtained from paraffin-embedded liver biopsy specimens. Each tissue section was double-labeled with antibodies directed against the type I InsP3R (red) and type III InsP3R (green). (A) Normal liver. Expression of the type II InsP3R is low in normal cholangiocytes compared with hepatocytes, and the type III InsP3R is concentrated in the apical region of cholangiocytes. Note that the type II InsP3R is concentrated in the canalicular region of hepatocytes, as has been reported.67. (B) Bile duct obstruction. Neither the type II nor the type III InsP3R is detectable in cholangiocytes. Findings are representative of 3 separate biopsy examinations. (C) Primary biliary cirrhosis. Neither InsP3R isoform is detectable in cholangiocytes, even though hepatocytes continue to express the type II InsP3R. Findings are representative of 3 separate biopsy examinations. Scale bars = 30 μm.
Discussion
Bile secretion is the result of bile formation by hepatocytes, followed by further conditioning by bile duct epithelia. Although genetic or acquired disorders of hepatocyte transporters account for some cases of cholestasis,2 many instances instead are caused by diseases of the bile ducts.2,3 Perhaps the principal role of bile ducts is to regulate secretion of bicarbonate into bile.5,15 Positron emission tomography studies of bile formation in vivo suggest that hormone-induced bicarbonate secretion is reduced in patients with either bile duct obstruction or primary biliary cirrhosis, but is preserved in hepatocellular liver diseases.30 It generally has been thought that the principal pathway for ductular bicarbonate secretion is mediated by cAMP and CFTR.3,5 However, this pathway is preserved in animal models of cholestasis such as BDL8 and treatment with α-napthyl isothiocyanate.9 The current study raises the possibility that Ca2+-mediated bicarbonate secretion is not just an alternative pathway, but may in fact be important for biliary bicarbonate secretion to occur under normal conditions. Previous work in isolated cholangiocytes suggests that signaling via Ca2+ and cAMP regulates secretion in a cooperative fashion.10 However, the importance of this cross-talk between signaling pathways may be limited in the intact liver.15 The current observation that ACh-induced bicarbonate secretion is lost after BDL while secretin-induced secretion is enhanced provides further evidence that these 2 signaling pathways can be dissociated in vivo.
The finding that the type III InsP3R is present and concentrated in the apical region of human bile duct epithelia has several implications. First, the type III InsP3R is concentrated in the apical region in a number of rodent epithelia,21,31,32 and this study shows that human epithelia may follow the same paradigm. Second, Cai2+ signals generally begin as apical-to-basal Ca2+ waves in polarized epithelia,33 perhaps because the type III InsP3R is localized to the apical region.21,25,26 Biophysical properties of the type III isoform may enable it to trigger Cai2+ waves,18,34 although this is controversial.35,36 In any case, apical-to-basal Cai2+ waves are critical for secretion to occur in polarized epithelia such as bile duct cells because this type of Cai2+ wave mediates transport of fluid and electrolytes across the apical membrane.33,37 Third, unlike the type I InsP3R, the type III isoform is not inhibited by high local concentrations of Cai2+,18 so its presence in the apical region may permit the Cai2+ concentration there to reach 5–10 μmol/L.37,38 Such high concentrations are essential for local activation of synaptotagmin39 and other events related to membrane fusion.40-42 These events in turn are necessary for proper targeting and insertion of anion channels and ion transporters into the apical membrane and for exocytosis. Fourth, loss of InsP3Rs causes resistance to apoptosis,43 and the type III isoform may be particularly important for mediating apoptosis.44 Because proliferation of bile ducts is a hallmark of cholestasis, and agents that increase Cai2+ in duct cells inhibit bile duct proliferation,45,46 the loss of type III InsP3Rs from bile duct cells may in part be a defense mechanism that is responsible for bile duct proliferation. Together, these findings suggest that apical expression of the type III InsP3R may be important for proper biliary bicarbonate secretion, so that loss of this receptor would lead to bile duct proliferation and cholestasis.
A consistent finding here was the dramatic loss of InsP3R expression in cholangiocytes from both patients with cholestatic disorders and animal models of cholestasis. BDL and other cholestatic conditions generally increase bile acids within cholangiocytes, which in turn can activate nuclear bile acid receptors such as the farnesoid X receptor. Activation of the farnesoid X receptor decreases expression of certain hepatic proteins, such as the sodium-taurocholate cotransport polypeptide,47 whereas the farnesoid X receptor instead transactivates the promoter of other liver proteins, such as the bile salt export pump.48 It is not known whether the promoter regions of any of the InsP3R isoforms contain elements that are sensitive to the farnesoid X receptor, but retinoic acid decreases the activity of the promoter of the type I InsP3R.49 Cholestatic conditions often are associated with an inflammatory infiltrate in the portal region, which raises the question of whether proinflammatory cytokines contribute to the decreased expression of InsP3Rs. Proinflammatory cytokines do not decrease expression of anion exchanger-2, CFTR, or the secretin receptor in cholangiocytes, and also do not impair Ca2+-mediated secretion in these cells.28 Consistent with this, interleukin 1 increases rather than decreases transcription of the type I InsP3R gene.50 Alternatively, the loss of InsP3Rs observed in our study could be caused by increased degradation rather than decreased production. Indeed, stimulation of the InsP3R by secretagogues in pancreatic acinar cells leads to rapid ubiquitination and proteosomal degradation of the receptor.51 Thus, previous studies suggest that decreased production, increased degradation, or both, may contribute to the loss of InsP3Rs that occurs in cholestatic cholangiocytes.
Our findings also have implications for understanding the therapy of cholestasis. Currently, the only treatment of proven efficacy for a number of cholestatic disorders is ursodeoxycholic acid. This hydrophilic bile acid improves serum liver chemistries in both primary biliary cirrhosis52 and sclerosing cholangitis,53 as well as in cystic fibrosis,54 intrahepatic cholestasis of pregnancy,55 and cholestasis induced by total parenteral nutrition.56 Although the mechanism of action of ursodeoxycholic acid is controversial,57 this bile acid increases Cai2+ in bile duct epithelia.45 This action may in part be indirect because ursodeoxycholic acid induces secretion of ATP into bile,58 and bile duct epithelia express apical P2Y receptors that link to InsP3-mediated Cai2+ signaling and bicarbonate secretion.11 Stimulation of apical nucleotide receptors has been considered as a way to bypass defective CFTR in cystic fibrosis,59,60 but the current study suggests that Ca2+-mediated secretion in the liver is important even in conditions in which CFTR expression is preserved. Thus, stimulation of Cai2+ signaling in bile ducts may provide a general strategy for treatment of cholestatic disorders. Treatment by this approach may be complex though because ACh and ATP both stimulate Ca2+-mediated secretion,11,15 whereas direct application of ursodeoxycholic acid instead appears to inhibit secretion in a Ca2+-dependent fashion.45 Therefore, agonist-specific effects on Ca2+ and secretion must be understood better to design optimal therapies for cholestatic disorders.
The current findings may have broad significance beyond the field of liver disease. Cai2+ signaling provides a universal mechanism for cell regulation,61 and indeed InsP3R knock-out mice die in the perinatal period.62 Yet, there are few examples of human disease that result from molecular defects in Cai2+ signaling machinery.63 Such examples include ryanodine receptor dysfunction in malignant hyperthermia,64 defects in the Ca2+-ATPase of the plasma membrane in certain hereditary forms of hearing loss,65 and defects in the Ca2+-ATPase of the endoplasmic reticulum in certain inherited myopathies.66. However, each of these disorders is rare. The current work provides evidence that a specific, acquired abnormality in Ca2+ signaling may be the final common pathway for a wide range of liver diseases that share a relatively frequent clinical presentation. Is loss of type III InsP3Rs necessary for cholestasis to occur? In the current work, loss of type III InsP3Rs was a very early event in several models of cholestasis, occurring as early as 24 hours after administration of endotoxin. Disruption of type III InsP3R expression in cholangiocytes would provide definitive evidence that this isoform is necessary for ductular secretion. However, to our knowledge no knockout animal for this protein exists. Further work therefore will be needed to confirm the role of InsP3R expression in cholestatic liver disease, and to determine whether altered InsP3R expression is responsible for secretory disorders of other organs as well.
Acknowledgments
Supported by National Institutes of Health grants DK45710, DK57751, DK61747, and DK34989, and by an Established Investigator Grant and a Grant-in-Aid from the American Heart Association.
The authors thank James L. Boyer and Barbara E. Ehrlich for helpful comments on the manuscript, Richard J. Wojcikiewicz for kindly supplying CT2 antibody, and Christopher R. Marino for kindly supplying antibody R3195.
Abbreviations used in this paper
- ACh
acetylcholine
- BDL
bile duct ligation
- Cai2+
cytosolic Ca2+
- CFTR
cystic fibrosis transmembrane conductance regulator
- InsP3
inositol 1,4,5-trisphosphate
- InsP3R
inositol 1,4,5-trisphosphate receptor
- LPS
lipopolysaccharide
References
- 1.Department of Health and Human Services, Health Resources and Services Administration, Office of Special Programs, Division of Transplantation; Rockville, MD: 2001. Annual Report of the U.S. Organ Procurement and Transplantation Network and the Scientific Registry for Transplant Recipients: Transplant Data 1991–2000. [Google Scholar]
- 2.Trauner M, Meier PJ, Boyer JL. Molecular pathogenesis of cholestasis. N Engl J Med. 1998;339:1217–1227. doi: 10.1056/NEJM199810223391707. [DOI] [PubMed] [Google Scholar]
- 3.Roberts SK, Ludwig J, LaRusso NF. The pathobiology of biliary epithelia. Gastroenterology. 1997;112:269–279. doi: 10.1016/s0016-5085(97)70244-0. [DOI] [PubMed] [Google Scholar]
- 4.Boyer JL, Nathanson MH. Bile formation. In: Schiff ER, Sorrell MF, Maddrey WC, editors. Diseases of the liver. Lippincott-Raven; Philadelphia: 1999. pp. 119–146. [Google Scholar]
- 5.Kanno N, LeSage G, Glaser S, Alpini G. Regulation of cholangiocyte bicarbonate secretion. Am J Physiol. 2001;281:G612–G625. doi: 10.1152/ajpgi.2001.281.3.G612. [DOI] [PubMed] [Google Scholar]
- 6.Marinelli RA, Pham L, Agre P, LaRusso NF. Secretin promotes osmotic water transport in rat cholangiocytes by increasing aquaporin-1 water channels in plasma membrane. Evidence for a secretin-induced vesicular translocation of aquaporin-1. J Biol Chem. 1997;272:12984–12988. doi: 10.1074/jbc.272.20.12984. [DOI] [PubMed] [Google Scholar]
- 7.Kato A, Gores GJ, LaRusso NF. Secretin stimulates exocytosis in isolated bile duct epithelial cells by a cyclic AMP-mediated mechanism. J Biol Chem. 1992;267:15523–15529. [PubMed] [Google Scholar]
- 8.LeSage GD, Alvaro D, Benedetti A, Glaser S, Marucci L, Baiocchi L, Eisel W, Caligiuri A, Phinizy J, Rodgers R, Francis H, Alpini G. Cholinergic system modulates growth, apoptosis, and secretion of cholangiocytes from bile duct-ligated rats. Gastroenterology. 1999;117:191–199. doi: 10.1016/s0016-5085(99)70567-6. [DOI] [PubMed] [Google Scholar]
- 9.LeSage G, Glaser S, Ueno Y, Alvaro D, Baiocchi L, Kanno N, Phinizy JL, Francis H, Alpini G. Regression of cholangiocyte proliferation after cessation of ANIT feeding is coupled with increased apoptosis. Am J Physiol. 2001;281:G182–G190. doi: 10.1152/ajpgi.2001.281.1.G182. [DOI] [PubMed] [Google Scholar]
- 10.Alvaro D, Alpini G, Jezequel AM, Bassotti C, Francia C, Fraioli F, Romeo R, Marucci L, LeSage G, Glaser SS, Benedetti A. Role and mechanisms of action of acetylcholine in the regulation of rat cholangiocyte secretory function. J Clin Invest. 1997;100:1349–1362. doi: 10.1172/JCI119655. [DOI] [PMC free article] [PubMed] [Google Scholar]
- 11.Dranoff JA, Masyuk AI, Kruglov EA, LaRusso NF, Nathanson MH. Polarized expression and function of P2Y ATP receptors in rat bile duct epithelia. Am J Physiol. 2001;281:G1059–G1067. doi: 10.1152/ajpgi.2001.281.4.G1059. [DOI] [PubMed] [Google Scholar]
- 12.Salter KD, Fitz JG, Roman RM. Domain-specific purinergic signaling in polarized rat cholangiocytes. Am J Physiol. 2000;278:G492–G500. doi: 10.1152/ajpgi.2000.278.3.G492. [DOI] [PubMed] [Google Scholar]
- 13.Nathanson MH, Burgstahler AD, Mennone A, Boyer JL. Characterization of cytosolic Ca2+ signaling in rat bile duct epithelia. Am J Physiol. 1996;271:G86–G96. doi: 10.1152/ajpgi.1996.271.1.G86. [DOI] [PubMed] [Google Scholar]
- 14.Fitz JG, Basavappa S, McGill J, Melhus O, Cohn JA. Regulation of membrane chloride currents in rat bile duct epithelial cells. J Clin Invest. 1993;91:319–328. doi: 10.1172/JCI116188. [DOI] [PMC free article] [PubMed] [Google Scholar]
- 15.Hirata K, Nathanson MH. Bile duct epithelia regulate biliary bicarbonate excretion in normal rat liver. Gastroenterology. 2001;121:396–406. doi: 10.1053/gast.2001.26280. [DOI] [PubMed] [Google Scholar]
- 16.Mignery GA, Sudhof TC, Takei K, De Camilli P. Putative receptor for inositol 1,4,5-trisphosphate similar to ryanodine receptor. Nature. 1989;342:192–195. doi: 10.1038/342192a0. [DOI] [PubMed] [Google Scholar]
- 17.Wojcikiewicz RJH. Type I, II, and III inositol 1,4,5-trisphosphate receptors are unequally susceptible to down-regulation and are expressed in markedly different proportions in different cell types. J Biol Chem. 1995;270:11678–11683. doi: 10.1074/jbc.270.19.11678. [DOI] [PubMed] [Google Scholar]
- 18.Hagar RE, Burgstahler AD, Nathanson MH, Ehrlich BE. Type III InsP3 receptor channel stays open in the presence of increased calcium. Nature. 1998;396:81–84. doi: 10.1038/23954. [DOI] [PMC free article] [PubMed] [Google Scholar]
- 19.Strassheim D, Williams CL. P2Y2 purinergic and M3 muscarinic acetylcholine receptors activate different phospholipase C-β iso-forms that are uniquely susceptible to protein kinase C-dependent phosphorylation and inactivation. J Biol Chem. 2000;275:39767–39772. doi: 10.1074/jbc.M007775200. [DOI] [PubMed] [Google Scholar]
- 20.French PJ, Hikke van Doorninck J, Peters RHPC, Verbeek E, Ameen NA, Marino CR, De Jonge HR, Bijman J, Scholte BJ. A ΔF508 mutation in mouse cystic fibrosis transmembrane conductance regulator results in a temperature-sensitive processing defect in vivo. J Clin Invest. 1996;98:1304–1312. doi: 10.1172/JCI118917. [DOI] [PMC free article] [PubMed] [Google Scholar]
- 21.Hirata K, Dufour J-F, O'Neill AF, Bode H-P, Cassio D, St-Pierre MV, LaRusso NF, Leite MF, Nathanson MH. Regulation of Ca2+ signaling in bile duct epithelia by inositol 1,4,5-trisphosphate iso-forms. Hepatology. 2002;36:284–296. doi: 10.1053/jhep.2002.34432. [DOI] [PMC free article] [PubMed] [Google Scholar]
- 22.Nathanson MH, Burgstahler AD, Mennone A, Dranoff JA, Rios-Velez L. Stimulation of bile duct epithelial secretion by glybenclamide in normal and cholestatic rat liver. J Clin Invest. 1998;101:2665–2676. doi: 10.1172/JCI2835. [DOI] [PMC free article] [PubMed] [Google Scholar]
- 23.Alpini G, Lenzi R, Zhai WR, Slott PA, Liu MH, Sarkozi L, Tavoloni N. Bile secretory function of intrahepatic biliary epithelium in the rat. Am J Physiol. 1989;257:G124–G133. doi: 10.1152/ajpgi.1989.257.1.G124. [DOI] [PubMed] [Google Scholar]
- 24.Laemmli UK. Cleavage of structural proteins during the assembly of the head of bacteriophage T4. Nature. 1970;227:680–685. doi: 10.1038/227680a0. [DOI] [PubMed] [Google Scholar]
- 25.Hirata K, Nathanson MH, Sears ML. Novel paracrine signaling mechanism in the ocular ciliary epithelium. Proc Natl Acad Sci U S A. 1998;95:8381–8386. doi: 10.1073/pnas.95.14.8381. [DOI] [PMC free article] [PubMed] [Google Scholar]
- 26.Nathanson MH, Padfield PJ, O'Sullivan AJ, Burgstahler AD, Jamieson JD. Mechanism of Ca2+ wave propagation in pancreatic acinar cells. J Biol Chem. 1992;267:18118–18121. [PubMed] [Google Scholar]
- 27.Blank JL. Regulation of phosphoinositide-specific phospholipase C isoenzymes. In: Tobin AB, editor. The phospholipase C pathway: its regulation and desensitization. R.G. Landes Co; Austin, TX: 1996. pp. 177–206. [Google Scholar]
- 28.Spirli C, Nathanson MH, Fiorotto R, Duner E, Denson LA, Sanz JM, DiVirgilio F, Okolicsanyi L, Casagrande F, Strazzabosco M. Proinflammatory cytokines inhibit secretion in rat bile duct epithelium. Gastroenterology. 2001;121:156–169. doi: 10.1053/gast.2001.25516. [DOI] [PubMed] [Google Scholar]
- 29.Cohn JA, Strong TV, Picciotto MR, Nairn AC, Collins FS, Fitz JG. Localization of the cystic fibrosis transmembrane conductance regulator in human bile duct epithelial cells. Gastroenterology. 1993;105:1857–1864. doi: 10.1016/0016-5085(93)91085-v. [DOI] [PubMed] [Google Scholar]
- 30.Prieto J, Garcia N, Marti-Climent JM, Penuelas I, Richter JA, Medina JF. Assessment of biliary bicarbonate secretion in humans by positron emission tomography. Gastroenterology. 1999;117:167–172. doi: 10.1016/s0016-5085(99)70564-0. [DOI] [PubMed] [Google Scholar]
- 31.Nathanson MH, Fallon MB, Padfield PJ, Maranto AR. Localization of the type 3 inositol 1,4,5-trisphosphate receptor in the Ca2+ wave trigger zone of pancreatic acinar cells. J Biol Chem. 1994;269:4693–4696. [PubMed] [Google Scholar]
- 32.Hirata K, Nathanson MH, Burgstahler AD, Okazaki K, Mattei E, Sears ML. Relationship between inositol 1,4,5-trisphosphate receptor isoforms and subcellular Ca2+ signaling patterns in non-pigmented ciliary epithelia. Invest Ophthalmol Vis Sci. 1999;40:2046–2053. [PubMed] [Google Scholar]
- 33.Kasai H, Augustine GJ. Cytosolic Ca2+ gradients triggering unidirectional fluid secretion from exocrine pancreas. Nature. 1990;348:735–738. doi: 10.1038/348735a0. [DOI] [PubMed] [Google Scholar]
- 34.Mak DOD, McBride S, Raghuram V, Yue Y, Joseph SK, Foskett JK. Single-channel properties in endoplasmic reticulum membrane of recombinant type 3 inositol trisphosphate receptor. J Gen Physiol. 2000;115:241–256. doi: 10.1085/jgp.115.3.241. [DOI] [PMC free article] [PubMed] [Google Scholar]
- 35.Swatton JE, Morris SA, Cardy TJ, Taylor CW. Type 3 inositol trisphosphate receptors in RINm5F cells are biphasically regulated by cytosolic Ca2+ and mediate quantal Ca2+ mobilization. Biochem J. 1999;344:55–60. [PMC free article] [PubMed] [Google Scholar]
- 36.Vazquez G, Wedel BJ, Bird GSJ, Joseph SK, Putney JW. An inositol 1,4,5-trisphosphate receptor-dependent cation entry pathway in DT40 B lymphocytes. EMBO J. 2002;21:4531–4538. doi: 10.1093/emboj/cdf467. [DOI] [PMC free article] [PubMed] [Google Scholar]
- 37.Ito K, Miyashita Y, Kasai H. Micromolar and submicromolar Ca2+ spikes regulating distinct cellular functions in pancreatic acinar cells. EMBO J. 1997;16:242–251. doi: 10.1093/emboj/16.2.242. [DOI] [PMC free article] [PubMed] [Google Scholar]
- 38.Mak DOD, McBride S, Foskett JK. Regulation by Ca2+ and inositol 1,4,5-trisphosphate (InsP3) of single recombinant type 3 InsP3 receptor channels: Ca2+ activation uniquely distinguishes types 1 and 3 InsP3 receptors. J Gen Physiol. 2001;117:435–446. doi: 10.1085/jgp.117.5.435. [DOI] [PMC free article] [PubMed] [Google Scholar]
- 39.Fernandez-Chacon R, Konigstorfer A, Gerber S, Garcia J, Matos M, Stevens C, Brose N, Rizo J, Rosenmund C, Sudhof TC. Synaptotagmin I functions as a calcium regulator of release probability. Nature. 2001;410:41–49. doi: 10.1038/35065004. [DOI] [PubMed] [Google Scholar]
- 40.Hu K, Carroll J, Fedorovich S, Rickman C, Sukhodub A, Davletov B. Vesicular restriction of synaptobrevin suggests a role for calcium in membrane fusion. Nature. 2002;415:646–650. doi: 10.1038/415646a. [DOI] [PubMed] [Google Scholar]
- 41.Peters C, Mayer A. Ca2+/calmodulin signals the completion of docking and triggers a late step of vacuole fusion. Nature. 1998;396:575–580. doi: 10.1038/25133. [DOI] [PubMed] [Google Scholar]
- 42.Mackler JM, Drummond JA, Loewen CA, Robinson IM, Reist NE. The C2B Ca2+-binding motif of synaptotagmin is required for synaptic transmission in vivo. Nature. 2002;418:340–344. doi: 10.1038/nature00846. [DOI] [PubMed] [Google Scholar]
- 43.Jayaraman T, Marks AR. T cells deficient in inositol 1,4,5-trisphosphate receptor are resistant to apoptosis. Mol Cell Biol. 1997;17:3005–3012. doi: 10.1128/mcb.17.6.3005. [DOI] [PMC free article] [PubMed] [Google Scholar]
- 44.Khan AA, Soloski MJ, Sharp AH, Schilling G, Sabatini DM, Li S-H, Ross CA, Snyder SH. Lymphocyte apoptosis: mediation by increased type 3 inositol 1,4,5-trisphosphate receptor. Science. 1996;273:503–507. doi: 10.1126/science.273.5274.503. [DOI] [PubMed] [Google Scholar]
- 45.Alpini G, Baiocchi L, Glaser S, Ueno Y, Marzioni M, Francis H, Phinizy JL, Angelico M, LeSage G. Ursodeoxycholate and tauroursodeoxycholate inhibit cholangiocyte growth and secretion of BDL rats through activation of PKC alpha. Hepatology. 2002;35:1041–1052. doi: 10.1053/jhep.2002.32712. [DOI] [PubMed] [Google Scholar]
- 46.Glaser S, Benedetti A, Marucci L, Alvaro D, Baiocchi L, Kanno N, Caligiuri A, Phinizy JL, Chowdury U, Papa E, LeSage G, Alpini G. Gastrin inhibits cholangiocyte growth in bile duct-ligated rats by interaction with cholecystokinin-B/Gastrin receptors via D-myoinositol 1,4,5-triphosphate-, Ca(2+)-, and protein kinase C alpha-dependent mechanisms. Hepatology. 2000;32:17–25. doi: 10.1053/jhep.2000.8265. [DOI] [PubMed] [Google Scholar]
- 47.Denson LA, Sturm E, Echevarria W, Zimmerman TL, Makishima M, Mangelsdorf DJ, Karpen SJ. The orphan nuclear receptor, shp, mediates bile acid-induced inhibition of the rat bile acid transporter, ntcp. Gastroenterology. 2001;121:140–147. doi: 10.1053/gast.2001.25503. [DOI] [PubMed] [Google Scholar]
- 48.Ananthanarayanan M, Balasubramanian N, Makishima M, Mangelsdorf DJ, Suchy FJ. Human bile salt export pump promoter is transactivated by the farnesoid X receptor/bile acid receptor. J Biol Chem. 2001;276:28857–28865. doi: 10.1074/jbc.M011610200. [DOI] [PubMed] [Google Scholar]
- 49.Deelman LE, Jonk LJ, Henning RH. The isolation and characterization of the promoter of the human type 1 inositol 1,4,5-trisphosphate receptor. Gene. 1998;207:219–225. doi: 10.1016/s0378-1119(97)00630-6. [DOI] [PubMed] [Google Scholar]
- 50.Bradford PG, Maglich JM, Kirkwood KL. IL-1 beta increases type 1 inositol trisphosphate receptor expression and IL-6 secretory capacity in osteoblastic cell cultures. Mol Cell Biol Res Commun. 2000;3:73–75. doi: 10.1006/mcbr.2000.0194. [DOI] [PubMed] [Google Scholar]
- 51.Wojcikiewicz RJH, Ernst SA, Yule DI. Secretagogues cause ubiquitination and down-regulation of inositol 1,4,5-trisphosphate receptors in rat pancreatic acinar cells. Gastroenterology. 1999;116:1194–1201. doi: 10.1016/s0016-5085(99)70023-5. [DOI] [PubMed] [Google Scholar]
- 52.Poupon RE, Balkau B, Eschwege E, Poupon R. A multicenter, controlled trial of ursodiol for the treatment of primary biliary cirrhosis. N Engl J Med. 1991;324:1548–1554. doi: 10.1056/NEJM199105303242204. [DOI] [PubMed] [Google Scholar]
- 53.Beuers U, Spengler U, Kruis W, Aydemir U, Wiebecke B, Heldwein W, Weinzierl M, Pape GR, Sauerbruch T, Paumgartner G. Ursodeoxycholic acid for treatment of primary sclerosing cholangitis: a placebo-controlled trial. Hepatology. 1992;16:707–714. doi: 10.1002/hep.1840160315. [DOI] [PubMed] [Google Scholar]
- 54.Colombo C, Battezzati PM, Podda M, Bettinardi N, Giunta A. Ursodeoxycholic acid for liver disease associated with cystic fibrosis: a double-blind multicenter trial. Hepatology. 1996;23:1484–1490. doi: 10.1002/hep.510230627. [DOI] [PubMed] [Google Scholar]
- 55.Palma J, Reyes H, Ribalta J, Hernandez I, Sandoval L, Almuna R, Liepins J, Lira F, Sedano M, Silva O, Toha D, Silva JJ. Ursodeoxycholic acid in the treatment of cholestasis of pregnancy: a randomized, double-blind study controlled with placebo. J Hepatol. 1997;27:1022–1028. doi: 10.1016/s0168-8278(97)80146-8. [DOI] [PubMed] [Google Scholar]
- 56.Spagnuolo MI, Iorio R, Vegnente A, Guarino A. Ursodeoxycholic acid for treatment of cholestasis in children on long-term total parenteral nutrition: a pilot study. Gastroenterology. 1996;111:716–719. doi: 10.1053/gast.1996.v111.pm8780577. [DOI] [PubMed] [Google Scholar]
- 57.Paumgartner G, Beuers U. Ursodeoxycholic acid in cholestatic liver disease: mechanisms of action and therapeutic use revisited. Hepatology. 2002;36:525–531. doi: 10.1053/jhep.2002.36088. [DOI] [PubMed] [Google Scholar]
- 58.Nathanson MH, Burgstahler AD, Masyuk AI, LaRusso NF. Stimulation of ATP secretion in the liver by therapeutic bile acids. Biochem J. 2001;358:1–5. doi: 10.1042/0264-6021:3580001. [DOI] [PMC free article] [PubMed] [Google Scholar]
- 59.Knowles MR, Clarke LL, Boucher RC. Activation by extracellular nucleotides of chloride secretion in the airway epithelia of patients with cystic fibrosis. N Engl J Med. 1991;325:533–538. doi: 10.1056/NEJM199108223250802. [DOI] [PubMed] [Google Scholar]
- 60.Parr CE, Sullivan DM, Paradiso AM, Lazarowski ER, Burch LH, Olsen JC, Erb L, Weisman GA, Boucher RC, Turner JT. Cloning and expression of a human P2U nucleotide receptor, a target for cystic fibrosis pharmacotherapy. Proc Natl Acad Sci U S A. 1994;91:3275–3279. doi: 10.1073/pnas.91.8.3275. [DOI] [PMC free article] [PubMed] [Google Scholar]
- 61.Berridge MJ, Lipp P, Bootman MD. The versatility and universality of calcium signalling. Nat Rev Mol Cell Biol. 2000;1:11–21. doi: 10.1038/35036035. [DOI] [PubMed] [Google Scholar]
- 62.Matsumoto M, Nakagawa T, Inoue T, Nagata E, Tanaka K, Takano H, Minowa O, Kuno J, Sakakibara S, Yamada M, Yoneshima H, Miyawaki A, Fukuuchi Y, Furuichi T, Okano H, Mikoshiba K, Noda T. Ataxia and epileptic seizures in mice lacking type 1 inositol 1,4,5-trisphosphate receptor. Nature. 1996;379:168–171. doi: 10.1038/379168a0. [DOI] [PubMed] [Google Scholar]
- 63.Carafoli E. Calcium signaling: a tale for all seasons. Proc Natl Acad Sci U S A. 2002;99:1115–1122. doi: 10.1073/pnas.032427999. [DOI] [PMC free article] [PubMed] [Google Scholar]
- 64.Lynch PJ, Tong J, Lehane M, Mallet A, Giblin L, Heffron JJA, Vaughan P, Zafra G, MacLennan DH, McCarthy TV. A mutation in the transmembrane/luminal domain of the ryanodine receptor is associated with abnormal Ca2+ release channel function and severe central core disease. Proc Natl Acad Sci U S A. 1999;96:4164–4169. doi: 10.1073/pnas.96.7.4164. [DOI] [PMC free article] [PubMed] [Google Scholar]
- 65.Street VA, McKee-Johnson JW, Fonseca RC, Tempel BL, Noben-Trauth K. Mutations in a plasma membrane Ca2+-ATPase gene cause deafness in deafwaddler mice. Nat Genet. 1998;19:390–394. doi: 10.1038/1284. [DOI] [PubMed] [Google Scholar]
- 66.Odermatt A, Taschner PE, Khanna VK, Busch HF, Karpati G, Jablecki CK, Breuning MH, MacLennan DH. Mutations in the gene-encoding SERCA1, the fast-twitch skeletal muscle sarcoplasmic reticulum Ca2+ ATPase, are associated with Brody disease. Nat Genet. 1996;14:191–194. doi: 10.1038/ng1096-191. [DOI] [PubMed] [Google Scholar]
- 67.Hirata K, Pusl T, O'Neill AF, Dranoff JA, Nathanson MH. The type II inositol 1,4,5-trisphosphate receptor can trigger Ca2+ waves in hepatocytes. Gastroenterology. 2002;122:1088–1100. doi: 10.1053/gast.2002.32363. [DOI] [PubMed] [Google Scholar]


