Abstract
This study represents a first attempt to assess the detection capability of a fluorescence-enhanced optical imaging system as quantified by the Hotelling observer. The imaging system is simulated by the diffusion approximation of the time-dependent radiative transfer equation, which describes near infra-red (NIR) light propagation through a breast phantom of clinically relevant volume. Random structures in the background are introduced using a lumpy-object model as a representation of anatomical structure as well as non-uniform distribution of disease markers. The systematic errors and noise associated with the actual experimental conditions are incorporated into the simulated boundary measurements to acquire imaging data sets. A large number of imaging data sets is considered in order to perform Hotelling observer studies. We find that the signal-to-noise ratio (SNR) of Hotelling observer (i) decreases as the strength of lumpy perturbations in the background increases, (ii) decreases as the target depth increases, and (iii) increases as excitation light leakage decreases, and reaches a maximum for filter optical density values of 5 or higher.
1. Introduction
Recently, numerous investigations have demonstrated the use of fluorescently labeled agents for molecularly-targeted imaging in small animal studies. Despite the potential advantages of non-radioactive and non-mutagenic imaging, to date, there have been no optical imaging studies of fluorescently labeled agents for molecular imaging in the clinic. While there has been demonstration of fluorescence-enhanced optical tomography in phantoms of clinically relevant volumes and homogeneous optical properties [1,2], there has been no systematic study predicting potential performance in detection tasks for the relevant case of non-uniform distribution of fluorescent contrast agents or heterogeneity of endogenous optical properties owing to normal anatomical tissue structure.
In this contribution, a lumpy-object model developed by Rolland and Barrett [3] is used to simulate the anatomical structure as well as the heterogeneous background expression of disease markers that lead to non-uniform background distribution of fluorescent imaging agent. The lumpy-object model has been utilized by previous researchers in (i) the simulation studies to incorporate variability present in the reconstructed images of clinical positron emission tomography (PET) and single photon emission computed tomography (SPECT) [4]; (ii) the generation of synthetic mammograms [5]; as well as (iii) the observer studies involving digital radiography [6]. Pineda et al. [7] have used lumpy-object model to explore the impact of normal anatomical tissue structure upon absorption imaging using time-dependent measurements of light propagation in the time-domain. We have employed lumpy-object model to demonstrate the ability to tomographically image fluorescent targets in the breast from frequency-domain measurements of fluorescence [8]. In fluorescence-enhanced optical imaging using frequency-domain techniques, intensity modulated NIR light is launched onto the tissue surface, wherein it propagates within the tissue, encounters a fluorophore, and generates emission light. Both emission and excitation light travel throughout the medium and the amplitude attenuation and phase delay of the emitted fluorescent light relative to the incident excitation light are detected at the surface. In order to tomographically image fluorescent targets deep inside the tissue, the boundary measurements are used within an optimization framework to determine interior distributions of the optical properties [1,2].
In this study, the Hotelling observer is used to assess the detection of a fluorescent target from boundary frequency-domain measurements. The Hotelling observer’s signal-to-noise ratio (SNRHot) is a measure of the task performance and has been widely used to evaluate the imaging hardware for tumor detection task in imaging modalities such as PET [9,10], SPECT [11,12], digital mammography [13,14], and optical coherence tomography [15]. Evaluation of imaging system for target detection tasks using the Hotelling observer requires a large number of imaging data sets and, thus, is not easily performed using patient image or experimentally obtained phantom data. However, the use of lumpy-objects to simulate heterogeneous distribution of optical properties that may be typical of human tissue allows generation of sizeable imaging data sets from computer simulation. Consequently, we simulate measurement data and incorporate expected systematic measurement error and noise of a fluorescence imaging system in order to use the Hotelling observer to assess performance in detection tasks. To our knowledge, this is the first time that an observer model is used to statistically assess the detection performance of a fluorescence-enhanced optical imaging system through analyzing the statistics of the imaging data sets.
In the following Methods section, we present (i) the imaging equation describing the propagation of modulated excitation and emission light in the tissue-like medium and the generation of emission light that is collected as measurements at the tissue boundary; (ii) a model to simulate the heterogeneous distribution of optical properties of biological tissues; (iii) the description of systematic measurement errors and noise; and (iv) an ideal linear observer and its figure of merit used to quantify the detection performance. The Results and Discussion section reports how the detection capability of the imaging system, as quantified by Hotelling observer’s SNR, is affected by: (i) perturbations in endogenous and exogenous optical properties; (ii) target depth; and (iii) excitation light leakage through rejection filters.
2. Methods
In the objective quality assessment of imaging systems, an imaging model is specified, an evaluation criterion is defined, and the observer evaluating the system is described. These basic components of the image quality assessment are described in this section for fluorescence-enhanced optical imaging. The various parameters used in this section are defined in the text as well as in Appendix II.
2.1 The imaging equation
The time-dependent generation and propagation of photon density waves diffusely transiting a highly scattering medium are described by the coupled diffusion equations, which are presented for the frequency-domain measurements as [16]:
| (1) |
| (2) |
Equation (1) describes the propagation of excitation light (subscript ‘x’) inside the tissue medium, whereas Eq. (2) describes the generation as well as the propagation of the emission light (subscript ‘m’). Here ω is the modulation frequency of the NIR source (rad/s); Dx,m is the photon diffusion coefficient (cm) at excitation/emission wavelengths at position r; c is the speed of light in the medium; Φx, m (r, ω) is the complex excitation/emission fluence rate (photons/(cm2s)) at position r ; S(r,ω ) is the photon source strength (photons/(cm3s)) at position r; φis fluorescence quantum; and τis fluorescence lifetime (s). Symbol μax, mi denotes the absorption due to endogenous chromophores in the tissue; and μax, mf denotes the absorption due to the exogenous fluorophores, which represent the only source of emission light from tissue. The diffusion coefficient is given by:
| (3) |
where μsx, m denotes the scattering coefficients at excitation/emission wavelength; and g is the coefficient of anisotropy of the medium. Collectively, the terms μaxi, μami, μsx, and μsm are referred to as endogenous optical properties; and, μaxf and μamf as exogenous optical properties. The coupled diffusion equations are solved with the Robin type boundary conditions [17]: x, m
| (4) |
where ⊥ denotes the normal direction outward to the surface, and γis a constant depending upon the optical refractive index mismatch at the boundary. Equation (1), (2), and (4) can be solved numerically to yield,
| (5) |
where θx, m is the measured phase lag and IAC is the measured amplitude of the photon density wave at the excitation/emission wavelengths. The background tissue optical properties andx, m values of the other parameters involved in Eq. (1) through (4) are listed in Table I. Herein, we chose the excitation and emission wavelengths to correspond to Cardio-Green as a typical fluorophore used in imaging agent development.
Table I.
Average background optical properties. The parameters used to solve the coupled diffusion equations are also tabulated.
| wavelength | μax,mi [cm−1] | μsx,m [cm−1] | μax,mf [cm−1] | ω [rad/s] | c [cm/s] | g [−] | φ[ −] | τ[s] |
|---|---|---|---|---|---|---|---|---|
| excitation (785 nm) | 0.02483
|
108.792
|
0.00299
|
6.28e8 | 2.25e10 | 0.9 | .016 | 0.56e-9 |
| emission (830 nm) | 0.0322 | 98.241 | 0.000506 |
For notational convenience, the process of imaging is often represented by the imaging equation
| (6) |
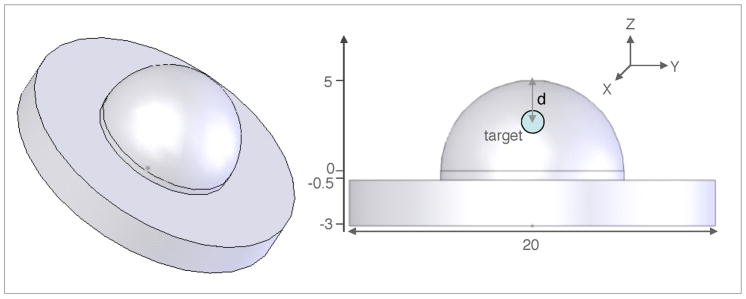
where f is the object being imaged; H is the imaging operator that describes how the imaging system maps the object into a vector of discrete measurements g; and n is the vector of noise in the measurement system. A Galerkin-type finite element method (FEM) is employed to solve Eq. (1), (2), and (4) over a breast-shaped geometry described in Fig. 1 and used in the prior experimental work in our laboratory [2]. The formulations in Eq. (1) through (5) are discretized for FEM representation and can be represented by Eq. (6). Accordingly, the nonlinear operator H is provided by the finite element representation of coupled diffusion equations described in Eq. (1) and (2); f is a vector containing the spatial values of the optical parameters to be imaged (in our case, the absorption coefficient owing to exogenous fluorophore, μax, mf) at each discrete point within the domain of breast geometry; and g is a vector containing the measurements of light intensity (IAC ) and phase lag (θ) at the specified boundary locations (denoted as detector points in Fig. 2). The only source of fluorescence is due to the exogenous fluorophore. From Eq. (6), one can see that vector g is the “noisy” image data returned by the imaging system. In this simulation study, the vector g is obtained by adding the FEM solution of the coupled diffusion equations to the noise modeled from experimental errors and considerations. The various noise considered in the imaging system is described in Section 2.3.2.
Fig. 1.
The breast-shaped geometry consisting of a 10 cm diameter hemispherical top to simulate a human breast. The bottom cylindrical base has 20 cm diameter and is 2.5 cm high. Also shown is 1 cm3 target at a depth d. All dimensions are in centimeters.
Fig. 2.
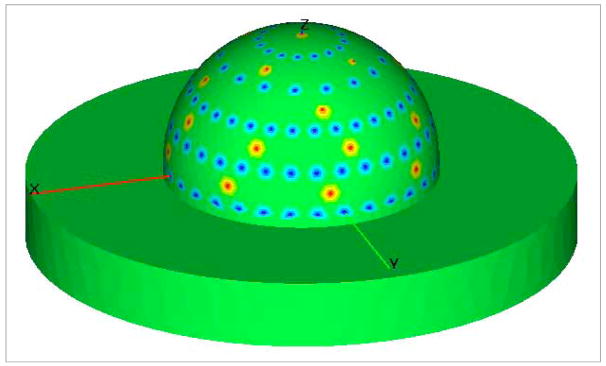
The locations of the point sources and detectors on the breast-shaped geometry. The red points denote the sources and the blue points denote the detectors.
2.2 Simulated background heterogeneity
The lumpy-object model [3] is employed to simulate the non-specific distribution of the fluorescent agent as well as the heterogeneity of the endogenous tissue optical properties due to the natural anatomical structure. Lumpy backgrounds consist of single structures or “blobs” located randomly within the domain. Mathematically, these structures are represented by:
| (7) |
where b(r) is the lumpy background; b0 is the spatial mean of the lumpy background; Np is the number of lumps; and rn is the uniformly distributed location of nth lump. The function lump has the following form:
| (8) |
In this expression, l0 is the lump strength; w is the lump width; Ω is the domain; and V( Ω ) is the volume of the domain. The volume integral term in Eq. (8) is designed such that the mean of function lump is zero; making the mean of the lumpy background equal to b0 [18]. This makes lumpy-object model useful for fluorescence imaging, because it enables user to specify an average value of any optical property and then introduce perturbations in that optical property using lumpy-objects to simulate the behavior of the natural biological tissue. This is also relevant because the average optical properties of human breast tissues are widely reported in the literature (see for review Table 1 in Ref. [8]).
In order to implement lumpy backgrounds and to solve the coupled diffusion equations using FEM, the breast geometry is discretized into 34413 regular tetrahedral elements comprising a total of 6956 nodes. The lump strength, l0, is set to be a prescribed percentage of the mean background value b0. The lump spread, w, and the number of lumps, Np, are set to be 5 mm and 100 respectively. While other works have used a Poisson distribution of lumps to represent non-uniform distribution of nuclear imaging agents [19,20], we chose a fixed number of lumps owing to our rationale to mimic heterogeneous tissue structure. The domain Ω in Eq. (8) is taken to be the hemispherical portion of the breast geometry shown in Fig. 1. For instance, 5% lumpy background of the scattering coefficient, μsx, indicates that 100 lumps are placed at locations uniformly distributed within the hemispherical portion of the breast geometry each having a strength 0.05 times the spatial average of μsx and a spatial spread of 5 mm. The process of generating lumpy background in an optical property at one wavelength and how it relates to the values at another wavelength is detailed elsewhere [8] and has been followed in this study. It is noteworthy that lump strengths that are less than or equal to 100% were assigned, thereby removing the possibility of negative optical property values. While there are other models, like clustered lumpy-object model which can describe anatomical heterogeneity [19], in this first work, we examine the simplest, which is the lumpy-object model. Anatomical tissue structure representation using the clustered lumpy-object model is one of the motivations of our future research work.
The generation of the optical property heterogeneity map and the solution of the coupled diffusion equations were performed on a LINUX workstation with AMD Opteron 250 (2.4 GHz) and 4.0 GB RAM. Twenty five points for illumination and 128 points for collection are employed on the breast geometry to generate the complex solution of the coupled diffusion equations. Figure 2 illustrates one view of the illumination and collection points on the breast geometry.
2.3.1 Excitation light leakage
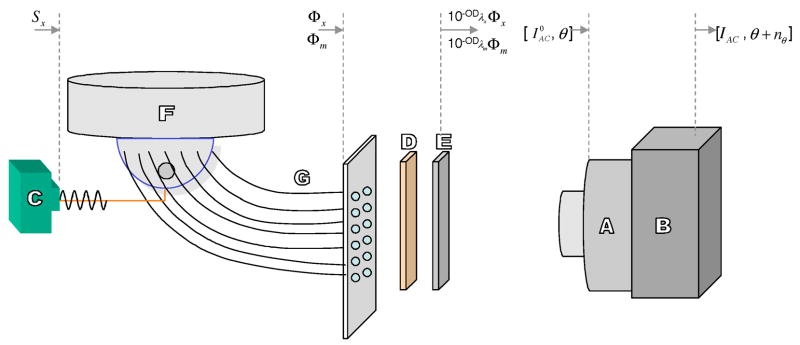
Figure 3 describes a typical experimental setup used in our laboratory for imaging studies on phantoms mimicking the shape and average optical properties of the human breast [2,21]. It includes: (1) a gain-modulated image intensifier; (2) a 16-bit cooled CCD camera; and (3) a modulated laser diode. The phantom is illuminated by the modulated excitation light delivered at discrete points on the surface by fiber optics and the emission light is collected from fiber optics and delivered to the intensified CCD camera for measurement. The collected light at the phantom surface is a mixture of both emission as well as excitation light. Since only the emission light is desired, a scheme to reject the excitation light is often employed. For this purpose in our laboratory, an 830-nm band-pass filter and a holographic filter are used to reject 785-nm excitation light and to selectively pass 830-nm emission light. The performance of a filter is quantified by the optical density (OD),
Fig. 3.
Schematic of the experimental setup. The various components are labeled to describe: (A) a gain-modulated image intensifier, (B) a 16-bit cooled CCD camera, (C) a modulated laser diode used as a light source, (D) an 830-nm band pass filter, (E) a holographic notch filter, (F) the breast shaped phantom, and (G) the detector fibers leading to an interfacing plate. The Fig. is not to scale.
| (9) |
Subscript λ denotes the dependence of OD on the wavelength of the light; T is the transmittance; I0 is the intensity of the incident light; and I is the intensity of the transmitted light. Equation (9) shows that the higher the OD, the lower the transmittance. The performance of the filters decreases when the angle of incidence of light deviates from zero. The filter specifications and OD values as a function of incident angle for emission and excitation light are given elsewhere [21].
It is noteworthy that the complete elimination of the excitation light from measurement of emission at the tissue boundary is not possible. The presence of a small amount of excitation light in the detected light is termed as excitation light leakage, and is a source of error in the imaging data set. Therefore the detected light is a mixture of the emission light and the excitation light which “leaks” through the filters. The overall intensity and phase of the detected light is thus affected by the excitation light leakage, and is obtained by adding the transmitted emission and excitation photon density waves, i.e. Φx and Φm. Accordingly, if the emission and excitation photon density waves at the collection points are given by ym = Im sin(ωt + θm), and yx = Ix sin(ωt + θx), respectively, then the overall photon density wave transmitted through filters is given by
| (10) |
where
| (11) |
| (12) |
Here ODλm and ODλx are the OD values of the filters for emission and excitation wavelengths, respectively.
The OD values of 0.3009 for emission light and 5.8470 for excitation light are taken for 830-nm band pass filter; whereas an OD value of 6 for the excitation light is taken for holographic filter [21]. The angle of incidence is assumed to be 0o while determining the above OD values. Zero degree incident angles can be achieved by allowing the fiber delivered light to pass through a GRIN lens before it arrives at the filters [22], or collimating the imaged plane before passing through the image quality filters [21].
In this study, the effect of using different filter efficiencies on the detection performance of the imaging system is studied. For this purpose, we simulated excitation light rejection with OD values varying from 3 to 7, simulating the range of ODs used in studies found in the literature and the potential deterioration of filter performance owing to the non-normal incidence of collected light.
2.3.2 Noise
In optical imaging systems, two main types of fundamental noise [23] are thermal and quantum noise. The thermal noise is a result of the random fluctuations in the current due to the thermal (Brownian) motion of charge carriers in any conductor. This is also known as dark current. An example of dark current in the charged-coupled device (CCD) system occurs when the thermal fluctuations in the CCD material releases electrons, which contribute to the overall number of photoelectrons. Similarly, the randomness incurring in the optical image measurements due to the counting of random arrival of photons is responsible for quantum noise. Both types of noise follow Poisson distribution and are often non-additive [24,25].
Amplification and quantization noise are the specific types of non-fundamental noise [26] in an optical imaging system. In any intensified CCD detector system, the random conversion of electrons to light gives rise to amplification noise. Quantization noise, however, is an inherent noise in the amplitude quantization process and occurs due to the finite resolution of the analog-to-digital converters (ADC). Both types of noise are additive and, in particular, amplification noise has a Gaussian distribution [25].
Imaging systems typically consist of many components which individually give rise to the noise in the measurement. Thus the resulting noise becomes too complex to be described by a single form of distribution. In most cases, researchers are forced to choose between one of these assumptions: (1) the noise from one particular component is dominant over that of other sources, and thus can be neglected; or (2) the noise associated with different components of the imaging system are additive, in which case the overall noise becomes Gaussian due to the central limit theorem. Therefore, the actual experimental setup (see Fig. 3) and the noise associated with its various components are analyzed to make proper assumption about the distribution of the overall noise. The CCD camera used in our laboratory has a regulated temperature control that keeps the chip temperature to as low as −41oC. At such low temperature, the typical dark current of the CCD is in the order of 0.1 electrons per pixel per second (e/p/s) of the exposure time. An exposure time of 400 ms further ensures that the dark current noise in the measurements is negligible. Hence the noise of the detector system is mainly governed by the image intensifier [27,28]. The image intensifier contains a wavelength specific photocathode, a micro channel plate (MCP), and a phosphor screen. The random striking of photons to the photocathode is the source of quantum noise. As this occurs before the amplification process, the noise becomes amplified in the MCP. In addition, the multiplication (gain) of electrons in the MCP introduces amplification error. These two noises are assumed to be additive, so that the cumulative noise of the image intensifier is Gaussian due to the central limit theorem. Since the quantum noise is dependent upon signal [29], the overall noise is also assumed to be signal-dependent. Thus the standard Gaussian noise with variance dependent upon the intensity of the light is used. Specifically, we add 5% Gaussian noise to the detected light (coming through the filters), so that final measured intensity is given by:
| (13) |
where is the intensity of the light before it enters the image intensifier; and ℕ(0,1)denotes a Gaussian distribution with zero mean and unit variance.
In contrast, a model to describe the noise in the phase measurements is not as simple. Therefore a typical experiment in our laboratory has been compared with the simulation, which shows that the noise in phase measurements follows approximately a uniform random distribution. Consequently, a random value in the interval (−2o, +2o) has been considered as the conservative noise estimate in the phase measurements. Mathematically, this noise can be described by
| (14) |
where ζ is a uniformly distributed random number in [0, 1]. The noise, nθ, is added to the phase of detected light, which is a mixture of both emission and excitation photon density waves, to obtain the noisy estimate of phase measurements.
2.4 Detection tasks
For detection tasks, there are two mutually exclusive hypotheses possible: (i) the signal-present hypothesis (H1) where the measurements are made from a patient/phantom with a target (t); and (ii) the signal-absent hypothesis (H0) where patient/phantom contains no target.
| (15) |
| (16) |
Here g = IAC exp(−iθ ) as described in Eq. (5); f represents the normal, non-target portion of the anatomy, while t represents the target (signal) portion. Both f and t are stochastic in real situations and vary from patient to patient. In the case of fluorescence imaging, the stochastic nature in f arises from both the non-specific fluorophore deposition as well as the heterogeneity of the endogenous tissue optical properties due to the natural anatomical structure. The stochastic nature of f is modeled using lumpy-objects as described in the previous section. This study involves “signal-known exactly” (SKE) cases wherein the size and location of target is known, and so the stochastic nature of t is not considered.
The target is taken to be a spherical volume of 1 cm3 centered in z-axis of the geometry shown in Fig. 1. The fluorescent uptake of the target is considered to be 10 times higher than the average background uptake, which means that its μaxf and μamf values are 10 times greater than the corresponding average background values. Five locations of the target are considered at depths varying from 1 cm to 5 cm. The depth of the target is measured as the distance between the tip of the hemispherical portion of the breast geometry (coordinates: 0, 0, 5) and the center of the spherical target volume.
2.4.1 Hotelling observer
The Hotelling observer is a linear discriminant that computes the confidence level using only the linear manipulations on the measurement data [25]. Its test statistic is given by the equation:
| (17) |
where Δḡe vector difference in the means of the vectors of discrete measurements under the H1 and H0 hypotheses; Kg is the average covariance of the vector g (assumed to be the same under each hypothesis); and superscript T denotes the transpose of the matrix. Mathematically, Kg = 〈(g – 〈g〉n, f)(g–〈g〉n, f )T 〉 n, f, where 〈...〉n, f denotes average over all noise, n, and object variations, f. While the covariance matrix maybe different under H1 and H0 hypotheses, we assume that for a weak fluorescent signal, it is the same [25].
The Hotelling observer is called an optimal linear observer because it maximizes a measure of separability between the two hypotheses, namely the target-present (H1) and target-absent (H0). The degree of overlap of the density functions of the Hotelling test statistic, χHot (g), determines the separability of the two hypotheses. As the degree of the overlap increases, the detectability of the target decreases. The SNR associated with the Hotelling test statistic is a measure of this overlap, and is given by the following expression:
| (18) |
Thus, the higher the value of the SNRHot, the higher the separability between the two hypotheses, and the lower the overlap of the density functions of χHot (g) under the two hypotheses. A higher value of the SNRHot corresponds to improved detectability of the target.
In both Eq. (17) and (18), the calculation of the average covariance matrix, Kg, is dependent upon the size of the measurement data sample. Sample size should be large enough to ensure a well conditioned covariance matrix, so that the inverse of the matrix, Kg−1, is stable [30]. Decomposition of Kg into two terms, one representing the stochastic nature of f and the other the noise in the system [31], improves its conditioning even when large numbers of g are not available. The decomposition approach is used to estimate the overall covariance matrix, Kg, as
| (19) |
The first term, Kḡ, is average-data covariance matrix, and the second term, K̄n, is average noise-covariance matrix. The two matrices are respectively given by Kḡ = 〈(〈g〉 n| f – 〈g〉 n, f)(〈g〉 n| f –〈g〉 n, f)T〉f, and K̄n = 〈nnT〉n, f, where nnT denotes the tensor product of n with itself. The advantage of this decomposition is that K̄n is usually diagonal and thus improves the conditioning of the overall covariance matrix, Kg.
2.5 Simulated measurements
As shown in Fig. 2, twenty five illumination and 128 collection points are used to obtain the boundary measurements of excitation/emission photon density wave amplitude (IACx, m) and phase delay (θx, m) by solving the coupled diffusion equations. The vector g has a dimension of 3200×1 for both intensity and phase measurements. The overall covariance matrix, Kg, has a dimension of 3200×3200. In order to obtain a reasonable estimate of Kg, 7000 measurement data sets (see Appendix I) were generated under both hypotheses (target-present and target-absent) using the lumpy backgrounds as described in Section 2.2. Noise computed by Eq. (13) and (14) were then added to g to evaluate the influence of noise. A Gaussian elimination method was used to compute the inverse of matrix Kg. It should be noted that Kḡ for a homogeneous background case becomes a null matrix, so we only considered K̄n when calculating Kg for such cases.
The calculations of SNRHot values were performed on a LINUX workstation with AMD Opteron 285 (2.6 GHz) and 8.0 GB RAM. The SNRHot was then used to quantify the detection capability of the imaging system and to assess how target detection task is affected by (i) strength of lumpy backgrounds, (ii) target depth, and (iii) filter performance in rejecting excitation light.
3. Results
The 7000 imaging data vectors, g, required ~94 hrs of CPU time to simulate target-present and target-absent cases. Additionally, the algorithm to compute the SNRHot value required ~2 hrs of CPU time.
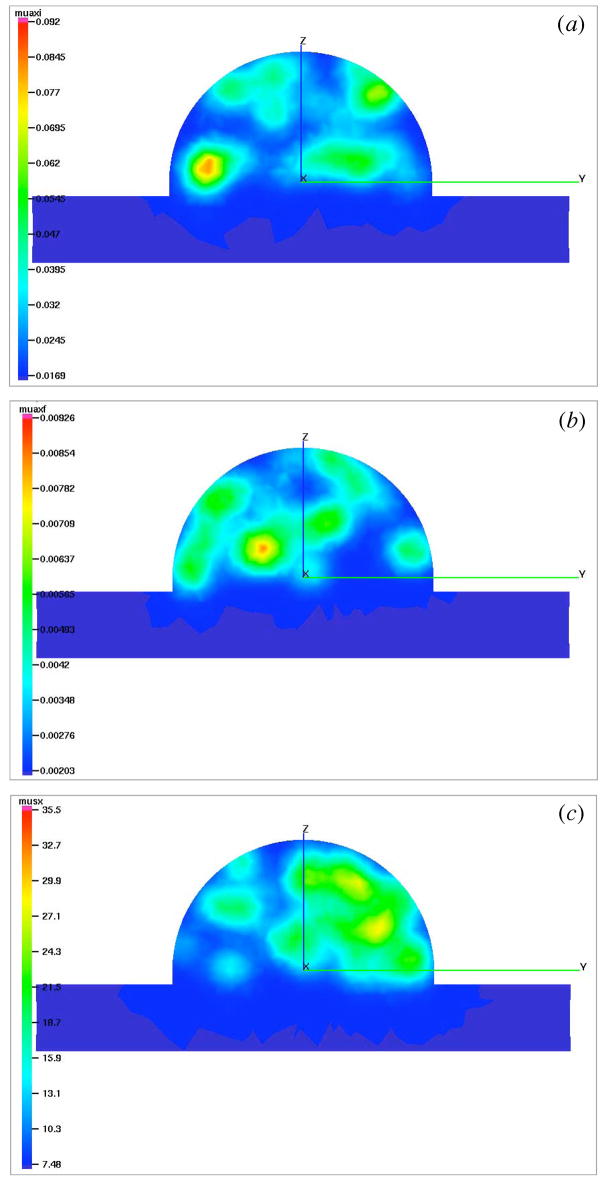
An example distribution of μaxi, μaxf, and μsx for the hundred percent exogenous and endogenous lumps in the background is illustrated in Fig. 4(a) through 4(c). The lumpy backgrounds for other lump strengths are not shown here for brevity.
Fig. 4.
Movies depicting the lumpy backgrounds of endogenous and exogenous optical properties using Lumpy object model. The lumps in μaxi (0.72 MB) (a), μaxf (0.78 MB) (b), and μsx (0.74 MB) (c) are shown as cutplanes to the breast geometry (Fig. 1) parallel to yz-plane. The snapshots shown above are cutplanes passing through x=−1 cm. In each case, one hundred lumps are uniformly generated in the hemispherical volume with spatial spreads of 5 mm and strength values equal to hundred percent of the average background values of optical properties as given in Table I.
3.1 Influence of lump strength
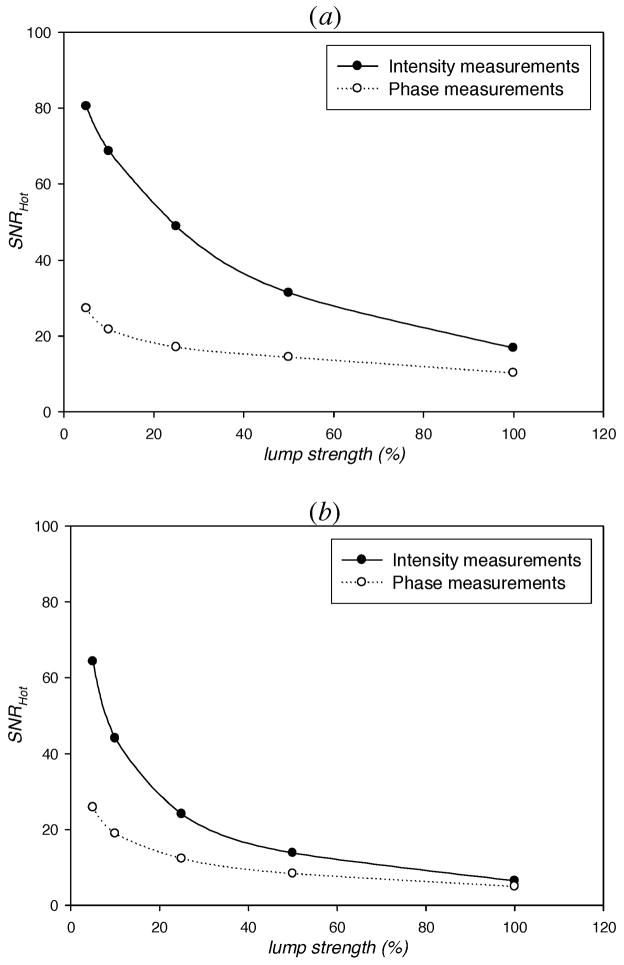
The detectability (SNRHot) of the fluorescent target superimposed in the lumpy backgrounds of endogenous and exogenous optical properties at a depth of 1 cm was first examined as a function of lump strength. Figure 5 illustrates how SNRHot of intensity (IAC) and phase (θ) measurements wanes as a function of the lump strength of (a) endogenous optical properties, and (b) endogenous as well as exogenous optical properties. Both Figs. show that the majority of the information is contained by intensity measurements, portrayed by the higher SNRHot values of intensity measurements than phase measurements. In both Figs., the SNRHot of intensity and phase measurements decrease as the lump strength increases. The decrease in SNRHot with increasing endogenous lump strengths indicates that endogenous lumps do affect the detectability of the target. This partially answers our concern in a previous study [8] where we showed single cases of tomographically reconstructed images and advocated the need to use sufficiently large imaging data in order to better understand the effect of lumpy backgrounds on target detection tasks. Eppstein et al. [32] have also reported difficulty in detecting a target when background variations in endogenous optical properties exceed a specific range. Similarly, the overall decrease in the information of both intensity and phase measurements as endogenous-and-exogenous lump strength increases is consistent with our previous study regarding the sensitivity of the detection performance on uneven distribution of disease markers in the background [8]. Indeed, when lumpy backgrounds in exogenous properties are added to an already heterogeneous background in endogenous properties, the information content is expectedly reduced. Nonetheless, in both cases of a heterogeneous anatomical backgrounds alone and of the addition of non-uniform background distribution of fluorescent contrast agent in a heterogeneous anatomical background, a large sample of reconstructed images may provide further insight into the effect of lumpy backgrounds on detection tasks.
Fig. 5.
SNRHot computed from simulated measurements of light intensity (filled circles) and phase (open circles) as a function of strength of lumps in (a) the endogenous optical properties (μaxi, μami, μsx, and μsm), and (b) endogenous as well as exogenous (μaxf, and μamf) optical properties vs. the strength of lumps. The target is a 1 cm3 spherical volume at a depth of 1 cm and contrasted from its surroundings by 10:1. The centroid of the target is at (0, 0, 4) inside the breast geometry (Fig. 1).
3.2 Influence of target depth
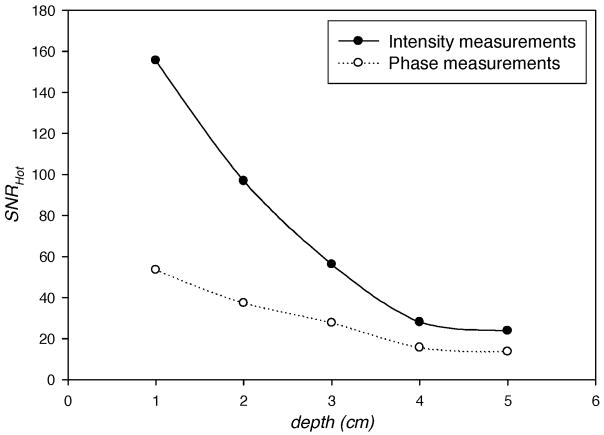
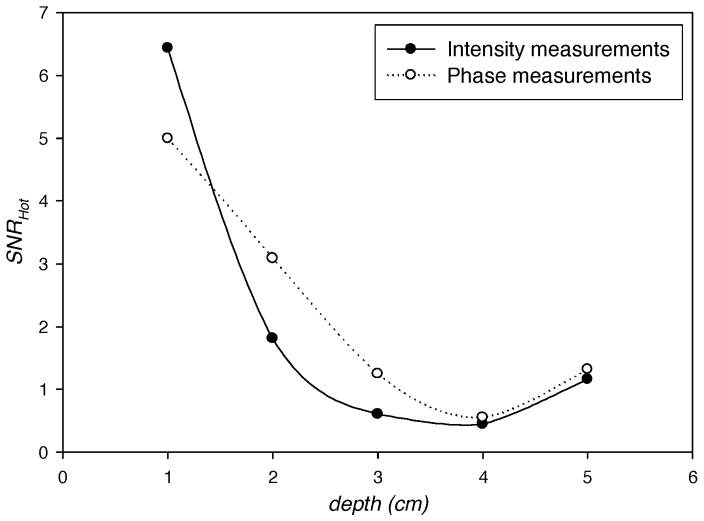
Figure 6 illustrates the plots of SNRHot with target depths varying from 1 cm to 5 cm in homogeneous backgrounds of the optical properties (i.e. the background optical properties have no spatial variations and are equal to the average values given in Table I). The plots show that the SNRHot for both intensity and phase measurements decreases as the target depth increases with intensity measurements providing more information as evident from higher SNRHot. However, the SNRHot does not follow this trend in the presence of heterogeneous backgrounds as shown in Fig. 7 which illustrates SNRHot versus target depth in the presence of lumpy backgrounds of endogenous as well as exogenous optical properties with hundred percent lump strengths. Figure 7 shows that the phase measurements contain more information (i.e. higher values of SNRHot) than the intensity measurements when depth is greater than ~1.5 cm. This indicates the importance of phase measurements in the fluorescence-enhanced imaging when the target is embedded deep within the tissue. However, it is not our intention to establish a general statement based exclusively on this result, and further investigations, including experimental validation, are needed. We have verified that the increase in SNRHot illustrated in Fig. 7 as the target depth increases from 4 to 5 cm is not due to mesh discretization levels, but more likely due to the increased signal from more detectors as the target is probed by more detectors in the hemispherical geometry. The increase in SNRHot of amplitude and phase measurements with target depth is consistent in our studies (see below in Fig. 8).
Fig. 6.
SNRHot computed from simulated measurements of light intensity (filled circles) and phase (open circles) in homogeneous background of optical properties vs. the depth of 1 cm3 spherical target contrasted from its surroundings by 10:1. The centroid of the target lies in the z-axis of breast geometry (Fig. 1). The target depth is measured as the distance from its centroid to the point (0, 0, 5) in breast geometry.
Fig. 7.
SNRHot computed from simulated measurements of light intensity (filled circles) and phase (open circles) in hundred percent lumpy backgrounds of endogenous (μaxi, μ ami, μsx, and μsm) as well as exogenous (μaxf, and μamf) optical properties vs. the depth of 1 cm3 spherical target contrasted from its surroundings by 10:1. The centroid of the target lies in the z-axis of breast geometry (Fig. 1). The target depth is measured as the distance from its centroid to the point (0, 0, 5) in breast geometry.
Fig. 8.
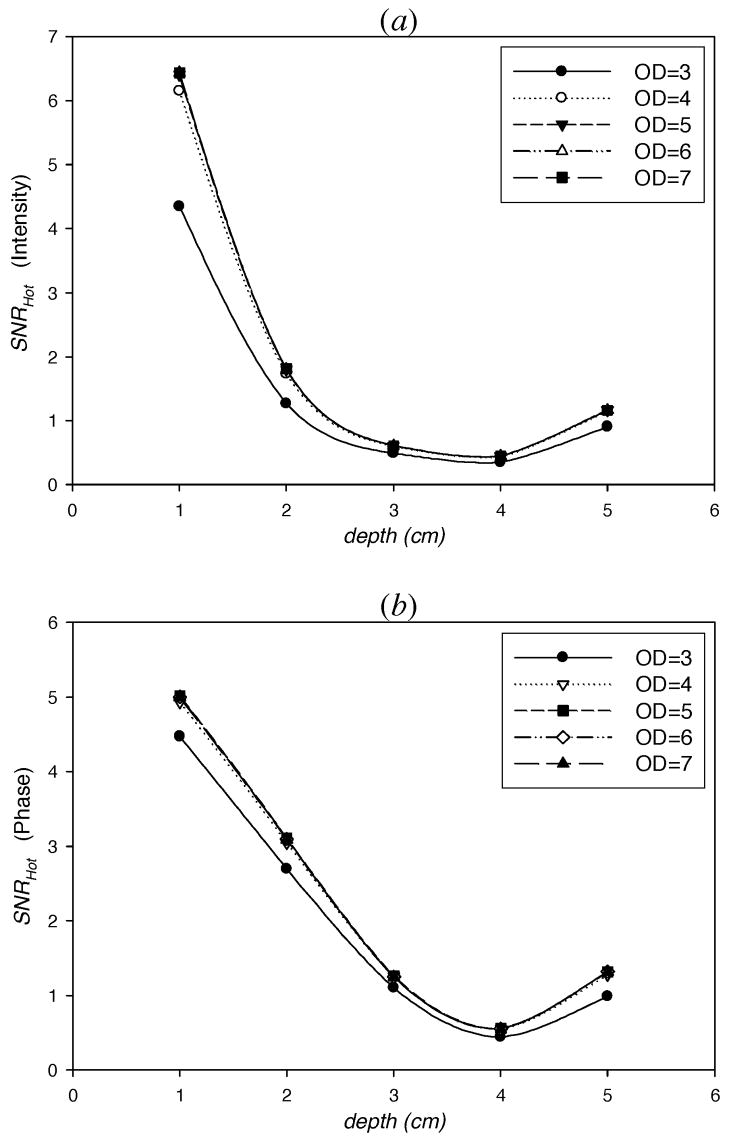
SNRHot computed from simulated measurements of (a) intensity, IAC, and (b) phase, θ, in one hundred percent lumpy backgrounds of endogenous as well as exogenous optical properties vs. the depth of 1 cm3 spherical target contrasted from its surroundings by 10:1. The centroid of the target lies in the z-axis and the target depth is measured as the distance from its centroid to the point (0, 0, 5) in breast geometry (Fig. 1). The various plots show the affect of varying optical densities (OD) of the excitation light rejection filter.
3.3 Influence of excitation light rejection efficiency
Figure 8 illustrates the changes in the SNRHot of (a) intensity and (b) phase measurements with varying target depths for increasing OD values. The target is present in lumpy backgrounds of both endogenous and exogenous optical properties with one hundred percent lump strengths. As anticipated, the SNRHot improves for all target depths as the OD value increases, a result of more efficient excitation light rejection. Surprisingly, the SNRHot becomes insensitive to OD when OD≥5 at all target depths. This result maybe reasonable when the emission fluence is greater than the excitation fluence so that the ‘leakage’ is not the dominant noise factor in heterogeneous backgrounds. However, as the background heterogeneity decreases, we might expect higher SNRHot with increased filter performance. Overall, the Hotelling analysis provides an important tool to optimize quality of the filters used in the imaging system under realistic situations.
4. Discussion
Most imaging modalities typically involve phantom studies as the first step before the clinical trials [33–35]. Phantom studies are used as a verification for the validity of the imaging method. In fluorescence-enhanced optical imaging, phantom studies that incorporate optical properties variations representative of heterogeneous tissue structure is a difficult task given that the anatomical structure of one patient is randomly different from another. Specifically, the optical properties of a tissue medium are characterized by the absorption and scattering coefficients. The absorption coefficient is a measure of the amount of light absorbed by: (i) oxy- and deoxy-hemoglobin in the blood flowing through blood capillaries, (ii) water retained in the tissue, and (iii) lipids present in the cell membrane [36]. The scattering coefficient is a measure of the amount of light scattered due to the refractive index mismatch between the extracellular and intracellular compartments in a tissue. These tissue properties affect the absorption and scattering of light in a tissue and vary spatially. The same may be said about the distribution of molecularly targeting, NIR fluorescent contrast agents. Heterogeneous distribution of imaging agent will depend upon the level of expression of the marker not only in the diseased target tissue, but also in the surrounding normal tissue.
The performance of an imaging system can be characterized by how an observer fares in the task of detecting a diseased target tissue. An observer, either a human or a computer algorithm, which performs the task of target detection, is specified; and the figures of merit to quantify the task performance are established [31,37,38]. Human observers can be assessed using psychophysical studies and receiver operating characteristic (ROC) curve analysis [39], but such studies do not separate the hardware from the reconstruction algorithms [40]. Thus, to directly assess the quality of an imaging system, mathematical observers that employ only the raw measurements are used [41]. This technique has been successfully used in PET and SPECT imaging and allows the imaging hardware to be optimized independently while still using task performance as the guide. The next step in this process is to assess human performance using reconstructed images.
5. Conclusions
In brief, we have presented and demonstrated a method of evaluating fluorescence-enhanced optical imaging systems using task-based methods. Specifically, we have investigated the SKE cases where the location, shape and contrast of the target are assumed to be known. We employed the Hotelling observer to directly assess the target-detection-based information content of the imaging measurements. This analysis has led to quantitative comparisons of the performance of our imaging system at varying target depths, light-rejection filter properties, and background strengths. In addition, fluorescence-enhanced optical imaging has typically been evaluated using a target in a homogeneous background of optical properties. We have used the lumpy-object model to simulate patient variability which is known to adversely affect task performance in other modalities and, thus, should be accounted for in fluorescence-enhanced optical imaging. Description of the image-reconstruction algorithms is not within the scope of this paper. However, upon assuming the Hotelling observer is a reasonable surrogate for the Bayesian observer, we have shown that we can assess and potentially optimize our imaging hardware independently from the reconstruction algorithm.
Specifically, the Hotelling observer study demonstrates that the detectability of the target decreases substantially when the lumpy backgrounds are considered to simulate the anatomical structure and/or the heterogeneous distribution of the disease markers that may be targeted by fluorescent contrast agents. We have demonstrated the importance of phase-information when detecting targets that are deep within the tissue. Finally the performance of the Hotelling observer provides an important tool to optimize the quality of the filters used in the imaging system. Future studies will address the reconstruction algorithms and the performance of human observers using reconstructed images.
Acknowledgments
This work is supported by NIH grant R01 CA112679. The authors acknowledge important technical conversations with Kildong Hwang and John Rasmussen on instrumentation associated with fluorescence-enhanced optical imaging.
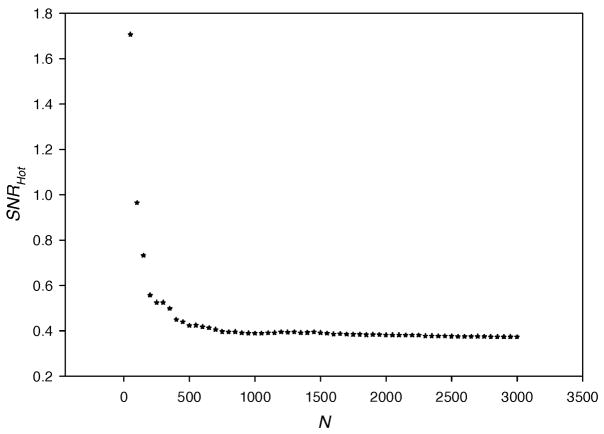
Appendix I: Bias in Hotelling SNR
In Section 2.4.1, Eq. (19) describes that the overall covariance matrix, Kg, is decomposed into two matrices, Kḡ and K̄n. The disadvantage of this decomposition is that it introduces bias in the estimate of the SNRHot. In other words, the estimate of SNRHot varies with the number, N, of imaging data sets, g. The value of SNRHot decreases as N increases and reaches a constant (true value of SNRHot) for large N. To illustrate using a smaller data set than described in the text, Fig. 9 describes a plot of SNRHot versus N, where the imaging measurements were conducted on the breast phantom with only one source lighted so that the length, M, of each vector g equals 128. Figure 9 shows that the true value of SNRHot is achieved for approximately N≥10×M. Sain et al. [30] also advocate using number of imaging data sets ten times more than the length of g. For this reason, the theoretical value of N for our study involving 25 sources and 128 detectors should be 10×25×128=32000. Due to the computation time limitations and the fact that the values of SNRHot are used only relatively for comparing different case studies (with constant M), we chose N=7000 to obtain reasonable estimates of SNRHot.
Fig. 9.
SNRHot computed from simulated measurements of intensity, IAC, in one hundred percent lumpy backgrounds of endogenous as well as exogenous optical properties vs. the number of imaging data sets, N. The centroid of the target lies in the z-axis and it is contrasted from its surroundings by 10:1. One twenty eight point detectors (as shown in Fig. 2) are used for the collection of light and only one source is lighted such that the measurement data set is a vector of 128×1.
Appendix II: Nomenclature
| b | The lumpy background |
| b0 | Spatial mean of the lumpy background |
| c | Speed of light in the medium |
| Dx,m | Photon diffusion coefficients at excitation/emission wavelengths |
| f | A vector containing the spatial values of the optical parameter being imaged |
| g | Coefficient of anisotropy of the medium |
| g | A vector containing the measurements at the specified boundary locations |
| Δḡ | Vector difference in the means of g under H1 and H0 hypotheses |
| H | The imaging operator |
| H0 | Signal-absent hypothesis |
| H1 | Signal-present hypothesis |
| I | Intensity of the transmitted light |
| I0 | Intensity of the incident light |
| IACx, m | Amplitudes of the photon density wave at excitation/emission wavelengths |
| Kg | Average covariance of the vector g |
| Kḡ | Average-data covariance matrix |
| K | Average noise-covariance matrix |
| n | |
| l0 | Lump strength |
| Np | Number of lumps |
| (0,1) | Gaussian distribution with zero mean and unit variance |
| n | Vector of noise in the measurement system |
| ODλ | Optical density value at some wavelength |
| r | Location of some point in a 3D space |
| rn | Uniformly distributed location of the nth lump |
| S | Photon source strength |
| SNRHot | The Hotelling observer’s signal-to-noise ratio |
| T | Transmittance |
| V (Ω) | Volume of the hemispherical portion of the breast geometry |
| w | Lump width |
| ⊥ | The normal direction outward to the surface |
| 〈...〉 n, f | Average over all noise and object variations |
| ∇ | The del operator |
| χHot | Hotelling observer’s test statistic |
| Φx, m | Excitation/emission photon fluence rates |
| φ | Fluorescence quantum |
| γ | Constant related to the optical refractive index mismatch at the boundary |
| μax, mf | Exogenous absorption coefficients at excitation/emission wavelengths |
| μax, mi | Endogenous absorption coefficients at excitation/emission wavelengths |
| μsx, m | Scattering coefficients at excitation/emission wavelengths |
| θx, m | Phase lags at excitation/emission wavelengths |
| τ | Fluorescence lifetime |
| Ω | The domain representing the hemispherical portion of the breast geometry |
| ω | Modulation frequency of the NIR source |
Contributor Information
Amit K. Sahu, Department of Chemical Engineering, Texas A&M University, College Station, TX 77843 Division of Molecular Imaging, Department of Radiology, Baylor College of Medicine, Houston, TX 77030
Amit Joshi, Division of Molecular Imaging, Department of Radiology, Baylor College of Medicine, Houston, TX 77030.
Matthew A. Kupinski, College of Optical Sciences and Department of Radiology, University of Arizona, Tucson, AZ 85721
Eva M. Sevick-Muraca, Division of Molecular Imaging, Department of Radiology, Baylor College of Medicine, Houston, TX 77030 evas@bcm.edu
References and links
- 1.Roy R, Thompson AB, Godavarty A, Sevick-Muraca EM. Tomographic fluorescence imaging in tissue phantoms: a novel reconstruction algorithm and imaging geometry. IEEE Trans Med Imaging. 2005;24:137–154. doi: 10.1109/tmi.2004.839359. [DOI] [PubMed] [Google Scholar]
- 2.Godavarty A, Eppstein MJ, Zhang C, Sevick-Muraca EM. Detection of single and multiple targets in tissue phantoms with fluorescence-enhanced optical imaging: feasibility study. Radiology. 2005;235:148–154. doi: 10.1148/radiol.2343031725. [DOI] [PubMed] [Google Scholar]
- 3.Rolland JP, Barrett HH. Effect of random background inhomogeneity on observer detection performance. J Opt Soc Am A. 1992;9:649–658. doi: 10.1364/josaa.9.000649. [DOI] [PubMed] [Google Scholar]
- 4.Abbey CK, Barrett HH. Human- and model- observer performance in ramp-spectrum noise: effects of regularization and object variability. J Opt Soc Am A. 2001;18:473–488. doi: 10.1364/josaa.18.000473. [DOI] [PMC free article] [PubMed] [Google Scholar]
- 5.Bakic PR, Albert M, Brzakovic D, Maidment ADA. Mammogram synthesis using a 3D simulation. I. Breast tissue model and image acquisition simulation. Med Phys. 2002;29:2131–2139. doi: 10.1118/1.1501143. [DOI] [PubMed] [Google Scholar]
- 6.Pineda AR, Barrett HH. Figures of merit for detectors in digital radiography. II. Finite number of secondaries and structured backgrounds. Med Phys. 2004;31:359–367. doi: 10.1118/1.1631427. [DOI] [PubMed] [Google Scholar]
- 7.Pineda AR, Barrett HH, Arridge SR. Spatially varying detectability for the optical tomography. Proceedings of SPIE Medical Imaging, Proc SPIE. 2000;3977:77–83. [Google Scholar]
- 8.Sahu AK, Roy R, Joshi A, Sevick-Muraca EM. Evaluation of anatomical structure and nonuniform distribution of imaging agent in near-infrared fluorescence-enhanced optical tomography. Opt Express. 2005;13:10182–10199. doi: 10.1364/opex.13.010182. http://www.opticsexpress.org/abstract.cfm?id=86462. [DOI] [PubMed]
- 9.Gifford HC, Wells RG, King MA. A comparison of human observer LROC and numerical observer ROC for tumor detection in SPECT images. IEEE Trans Nucl Sci. 1999;46:1032–1037. [Google Scholar]
- 10.Lartizien C, Kinahan PE, Comtat C. Volumetric model and human observer comparisons of tumor detection for whole-body positron emission tomography. Acad Radiol. 2004;11:637–648. doi: 10.1016/j.acra.2004.03.002. [DOI] [PubMed] [Google Scholar]
- 11.Wollenweber SD, Tsui BMW, Lalush DS, Frey EC, Gullberg GT. Evaluation of myocardial defect detection between parallel-hole and fan-beam SPECT using the Hotelling trace. IEEE Trans Nucl Sci. 1998;45:2205–2210. [Google Scholar]
- 12.Chen M, Bowsher JE, Baydush AH, Gilland KL, DeLong DM, Jaszczak RJ. Using the Hotelling observer on multislice and multiview simulated SPECT myocardial images. IEEE Trans Nucl Sci. 2002;49:661–667. [Google Scholar]
- 13.Gagne RM, Gallas BD, Myers KJ. Toward objective and quantitative evaluation of imaging systems using images of phantoms. Med Phys. 2005;33:83–95. doi: 10.1118/1.2140117. [DOI] [PubMed] [Google Scholar]
- 14.Chen L, Barrett HH. Task-based lens design with application to digital mammography. J Opt Soc Am A. 2005;22:148–167. doi: 10.1364/josaa.22.000148. [DOI] [PMC free article] [PubMed] [Google Scholar]
- 15.Cheong K, Clarkson E. Delectability study on OCT in the presence of speckle with Hotelling observer. Med Phys. 2005;32:1915–1915. [Google Scholar]
- 16.Hutchinson CL, Lakowicz JR, Sevick-Muraca EM. Fluorescence lifetime-based sensing in tissues: a computational study. Biophys J. 1995;68:1574–1582. doi: 10.1016/S0006-3495(95)80330-9. [DOI] [PMC free article] [PubMed] [Google Scholar]
- 17.Sevick-Muraca EM, Kuwana E, Godavarty A, Houston JP, Thompson AB, Roy R. Near infrared fluorescence imaging and spectroscopy in random media and tissues. In: Vo-Dinh J, editor. Chapter 33 in Biomedical Photonics Handbook. CRC Press; 2003. [Google Scholar]
- 18.Fortin ARP. PhD Thesis. The University of Arizona; Tucson, AZ: 2002. Detection-theoretic evaluation in digital radiography and optical tomography. [Google Scholar]
- 19.Kupinski MA, Clarkson E, Hoppin JW, Chen L, Barrett HH. Experimental determination of object statistics from noisy images. J Opt Soc Am A. 2003;20:421–429. doi: 10.1364/josaa.20.000421. [DOI] [PMC free article] [PubMed] [Google Scholar]
- 20.Park S, Clarkson E, Kupinski MA, Barrett HH. Efficiency of the human observer detecting random signals in random backgrounds. J Opt Soc Am A. 2005;22:3–26. doi: 10.1364/josaa.22.000003. [DOI] [PMC free article] [PubMed] [Google Scholar]
- 21.Hwang K, Houston JP, Rasmussen JC, Joshi A, Ke S, Li C, Sevick-Muraca EM. Improved excitation light rejection enhances small-animal fluorescencent optical imaging. J Mol Imaging. 2005;4:194–204. doi: 10.1162/15353500200505142. [DOI] [PubMed] [Google Scholar]
- 22.Hwang K, Sevick-Muraca EM. Influence of excitation light rejection on forward model mismatch. Med Phys. doi: 10.1088/0031-9155/51/22/011. in preparation. [DOI] [PubMed] [Google Scholar]
- 23.Referring to the corpuscular nature of light.
- 24.Lohinger H. Teach/Me Data Analysis. Springer-Verlag; Berlin-New York-Tokyo: 1999. [Google Scholar]
- 25.Barrett HH, Myers KJ. Foundations of Image Science. John Wiley & Sons, Inc; New Jersey: 2004. [Google Scholar]
- 26.Arising from the instrumentation of the system.
- 27.Glasgow BB, Glaser MS, Whitley RH. Remote imaging in the ultraviolet using intensified and nonintensified CCDs. Proc SPIE. 1994;2173:85–96. [Google Scholar]
- 28.Ientilucci EJ. PhD Thesis. Rochester Institute of Technology; Rochester, NY: 2000. Synthetic simulation and modeling of image intensified CCDs (IICCD) [Google Scholar]
- 29.In this context, the word “signal” means “the object being measured”, unlike “the object being detected” in the target detection tasks.
- 30.Sain JD, Barrett HH. Performance evaluation of a modular gamma using a detectability index. J Nucl Med. 2003;44:58–66. [PubMed] [Google Scholar]
- 31.Barrett HH. Objective assessment of image quality: effects of quantum noise and object variability. J Opt Soc Am A. 1990;7:1266–1278. doi: 10.1364/josaa.7.001266. [DOI] [PubMed] [Google Scholar]
- 32.Eppstein MJ, Dougherty DE, Hawrysz DJ, Sevick-Muraca EM. 3-D Bayesian optical imaging reconstruction with domain decomposition. IEEE Trans Med Imaging. 2001;20:147–161. doi: 10.1109/42.918467. [DOI] [PubMed] [Google Scholar]
- 33.Kalender WA, Polacin A, Suss C. A comparison of conventional and spiral CT - an experimental-study on the detection of spherical lesions. J Comput Assist Tomo. 1994;18:167–176. doi: 10.1097/00004728-199403000-00001. [DOI] [PubMed] [Google Scholar]
- 34.Weinberg I, Majewski S, Weisenberger A, Markowitz A, Aloj L, Majewski L, Danforth D, Mulshine J, Cowan K, Zujewski J, Chow C, Jones E, Chang V, Berg W, Frank J. Preliminary results for positron emission mammography: Real-time functional breast imaging in a conventional mammography gantry. Euro J Nucl Med. 1996;23:804–806. doi: 10.1007/BF00843710. [DOI] [PubMed] [Google Scholar]
- 35.Warren RML, Hayes C. Localization of breast lesions shown only on MRI - a review for the UK study of MRI screening for breast cancer. Brit J Radiol. 2000;73:123–132. doi: 10.1259/bjr.73.866.10884723. [DOI] [PubMed] [Google Scholar]
- 36.Tromberg BJ, Coquoz O, Fishkin J, Pham T, Anderson ER, Butler J, Cahn M, Gross JD, Venugopalan V, Pham D. Non-invasive measurements of breast tissue optical properties using frequency-domain photon migration. Philos Trans Biol Sciences. 1997;352:661–668. doi: 10.1098/rstb.1997.0047. [DOI] [PMC free article] [PubMed] [Google Scholar]
- 37.Barrett HH, Denny JL, Wagner RF, Myers KJ. Objective assessment of image quality. II. Fisher information, Fourier crosstalk, and figures of merit for task performance. J Opt Soc Am A. 1995;12:834–852. doi: 10.1364/josaa.12.000834. [DOI] [PubMed] [Google Scholar]
- 38.Barrett HH, Abbey CK, Clarkson E. Objective assessment of image quality. III. ROC metrics, ideal observers, and likelihood-generating functions. J Opt Soc Am A. 1998;15:1520–1535. doi: 10.1364/josaa.15.001520. [DOI] [PubMed] [Google Scholar]
- 39.Swets JA, Dawes RM, Monahan J. Psychological science can improve diagnostic decisions. Psych Science Public Interest. 2000;1:1–26. doi: 10.1111/1529-1006.001. [DOI] [PubMed] [Google Scholar]
- 40.Barrett HH, Yao J, Rolland JP, Myers KJ. Model observers for assessment of image quality. Proc Natl Acad Sci USA. 1993;90:9758–9765. doi: 10.1073/pnas.90.21.9758. [DOI] [PMC free article] [PubMed] [Google Scholar]
- 41.Barrett HH, Gooley T, Girodias K, Rolland JP, White T, Yao J. Linear discriminants and image quality. Image Vision Comput. 1992;10:451–460. [Google Scholar]


