

Abstract
Membranes fuse by forming highly curved intermediates, culminating in structures described as fusion pores. These hourglass-like figures that join two fusing membranes have high bending energies, which can be estimated using continuum elasticity models. Fusion pore bending energies depend strongly on shape, and the present study developed a method for determining the shape that minimizes bending energy. This was first applied to a fusion pore modeled as a single surface and then extended to a more realistic model treating a bilayer as two monolayers. For the two-monolayer model, fusion pores were found to have metastable states with energy minima at particular values of the pore diameter and bilayer separation. Fusion pore energies were relatively insensitive to membrane thickness but highly sensitive to spontaneous curvature and membrane asymmetry. With symmetrical bilayers and monolayer spontaneous curvatures of −0.1 nm−1 (a typical value) separated by 6 nm (closest distance determined by repulsive hydration forces), fusion pore formation required 43–65 kT. The pore radius of ∼2.25 nm fell within the range estimated from conductance measurements. With bilayer separation >6 nm, fusion pore formation required less energy, suggesting that protein scaffolds can promote fusion by bending membranes toward one another. With nonzero spontaneous monolayer curvature, the shape that minimized the energy change during fusion pore formation differed from the shape that minimized its energy after it formed. Thus, a nascent fusion pore will relax spontaneously to a new shape, consistent with the experimentally observed expansion of nascent fusion pores during viral fusion.
Keywords: Membrane fusion, Exocytosis, Membrane mechanics, Membrane elasticity
Introduction
Lipid bilayer membranes fuse under various conditions, and this process occurs during many biological functions such as synaptic release, viral infection, fertilization, embryogenesis and intracellular membrane trafficking. Membrane fusion requires large-scale deformations of lipid bilayers, and these energetically costly deformations impose major kinetic barriers. Initial theoretical efforts to investigate the role of membrane bending energetics in fusion employed continuum elasticity models, and this approach has provided a useful framework for exploring the energy landscape of membrane fusion (Markin et al. 1984; Kozlov et al. 1989; Siegel 1993; Chernomordik and Kozlov 2003, 2008; Cohen and Melikyan 2004). These studies have helped guide research on membrane fusion mechanisms by evaluating putative kinetic intermediates and stimulating the development of experimental approaches to test hypothetical mechanisms. Estimates of the membrane bending energy of fusion stalks, hemifusion diaphragms and fusion pores have had a considerable influence on research in the field of membrane fusion.
The membrane bending energy of a structure with a specified shape can be expressed as a surface integral of the mean curvature (see Eq. 1 below). Initial efforts assumed a toroidal shape for two important fusion intermediates fusion stalks and fusion pores (Markin et al. 1984; Kozlov et al. 1989; Chizmadzhev et al. 1995), but it is now widely recognized that the shape must be one that minimizes the elastic energy while satisfying the geometric constraints that arise from choosing key dimensions such as pore radius and length. Many studies have since invoked the shape of a catenoid, a surface of revolution with zero mean curvature (Kreyszig 1991), to argue that fusion intermediates can reduce their membrane bending energy essentially to zero (Kozlov and Chernomordik 1998; Markin and Albanesi 2002; Siegel 2006, 2008). However, a bilayer is composed of two monolayers, and since these monolayers are parallel surfaces, they cannot both be catenoidal simultaneously (Kozlovsky and Kozlov 2003). Thus, although a catenoid has zero mean curvature, when a bilayer has a catenoidal midplane the neutral surfaces of the two monolayers cannot be catenoidal. For this reason, invoking catenoidal geometry will underestimate the bending energy of a fusion pore.
Broadly speaking, with the elastic continuum models, toroidal geometries provide an analytically tractable upper bound to membrane bending energies of fusion intermediates and catenoidal geometries provide a zero-energy lower bound. Since these bounds are quite far apart, it would be useful to determine the shape of a fusion intermediate that explicitly minimizes the bending energy. The need for better solutions to the continuum model is heightened by the recent development of microscopic models for membrane fusion. A self-consistent field theory that incorporated molecular detail indicated that fusion pores can have stable energy minima at a specified radius (Katsov et al. 2004; Lee and Schick 2007). The toroidal version of the continuum model has a local energy minimum at a specified ratio of its length to its radius (Chizmadzhev et al. 1995), but the energy of a catenoid will be insensitive to its dimensions. Experiments indicate that fusion pores can be stable on time scales of hundreds of milliseconds or more (Chanturiya et al. 1997; Razinkov et al. 1998). At present, it is difficult to say whether these differences reflect a fundamental shortcoming of continuum models or more specific inadequacies related to the toroidal and catenoidal approximations.
The problem of determining shapes of minimum elastic energy has been addressed for the related problem of membrane fission (Kozlovsky and Kozlov 2003), and the present study determines shapes of minimum elastic energy for fusion pores. A general mathematical representation of the mean curvature of a surface of revolution is introduced and minimized with respect to shape. This method yielded shapes of minimum energy for fusion pores of specified dimensions composed of lipids with a specified spontaneous curvature. This method was then extended to the combined treatment of the two monolayers that make up a bilayer. This model generated results that differed both quantitatively and qualitatively from the results of the single-surface model. The two-monolayer model generated potential energy surfaces as a function of pore radius and interbilayer distance, providing energy landscapes relevant to the dynamics of membrane fusion. These landscapes offer interesting insights into how fusion pores form and how their structures evolve after formation.
Bending Energy and Membrane Curvature
Membrane bending energy can be calculated as an integral over a specified surface (Helfrich 1973; Boal 2002).
| (1) |
Bb is the bending or flexural rigidity of a lipid bilayer membrane, for which most experimental estimates fall in a range of 5–50 kT (Boal 2002; Marsh 2006). Bb = 20 kT is widely used in studies of membrane fusion, and this value was used in the present calculations. 1/R1 and 1/R2 are the principal curvatures of the surface (Kreyszig 1991). Cb-0 represents the spontaneous curvature of the lipid bilayer. For a symmetric bilayer, Cb-0 = 0. S denotes the surface for a particular fusion intermediate. At equilibrium and subject to a particular set of constraints a membrane will assume a shape that minimizes the integral in Eq. 1. Thus, finding the shape of a fusion pore is a problem in the calculus of variations. However, the standard method of solving the Euler–Lagrange differential equation does not appear to be tractable in this case. Indeed, because solving the shape problem is so daunting, investigators have often addressed problems in membrane bending mechanics by making a reasonable assumption about shape in order to generate an explicit form for Eq. 1 which can then be integrated. The approach taken here is to develop a representation for the shape in terms of explicit mathematical forms for R1, R2 and dS. This mathematical representation of the surface enables the minimization of Eq. 1 numerically by variation of parameters.
Equation 1 can also be applied to the two monolayers of a lipid bilayer, with the two energies added to give the total membrane bending energy. In fact, each monolayer has its own neutral surface near its polar headgroups (Leikin et al. 1996), and treating the separate bending energies of each monolayer takes this into account. The differences between treating a membrane as one neutral surface or as two will be examined in detail. The monolayer bending rigidity is generally taken as half the bilayer value, so Bm = 10 kT will be used. The bilayer spontaneous curvature, Cb-0, is replaced by the monolayer value, Cm-0; and asymmetric membranes can be treated by giving the two monolayers different spontaneous curvatures. After developing a method that minimizes the bending energy of a single-surface lipid bilayer, this method will be extended to the two-monolayer representation. In general, the energy minimized single-surface bilayer model underestimates the bending energy, and this difference can be large, especially for highly curved structures. The two-monolayer model is far more relevant to the energetics of fusion pores, so the results of this model will be studied in greater detail.
Equation 1 does not include membrane tension, which has been analyzed in some studies of this problem (Chizmadzhev et al. 1995) but will not be considered here. Equation 1 omits a term for the Gaussian curvature, which for a given topology is invariant to changes in shape and, thus, irrelevant to the problem of determining the shape of a fusion pore with minimum bending energy. Equation 1 does not treat chain tilting. Originally invoked as a response of membrane to torque (Helfrich 1973), the tilting of chains relative to the membrane normal has been shown to arise from essentially similar molecular processes as those that occur during membrane bending (Hamm and Kozlov 2000). Tilt makes an important contribution to the energetics of nonbilayer lipid phases (Hamm and Kozlov 1998), inclusions or defects (Hamm and Kozlov 2000), fusion stalks (Kuzmin et al. 2001; Kozlovsky and Kozlov 2002) and interfaces between bilayers of different composition such as rafts (Kuzmin et al. 2005). These cases all have in common an environment that induces hydrocarbon chains to tilt away from the membrane normal. However, for fusion pores the bilayer structure is preserved and as the membrane bends the hydrocarbon chains are expected to maintain their mean axis along the bilayer normal.
The present investigation will focus on the evaluation of Eq. 1 for various geometries. These integrals were evaluated numerically and minimized for different parameterized surfaces subject to various constraints. All numerical calculations were performed with Mathcad (PTC Corp, Needham, MA). All surfaces were surfaces of revolution around a vertical axis. Integrations of Eq. 1 were carried out over the area of membrane within the fusion pore. Outside of this region the shape of the membrane is irrelevant because it does not change when a fusion pore forms.
Ellipsoidal Fusion Pores
As a prelude to a more general analysis of shape, it is instructive to evaluate the energy for a fusion pore formed by a hemi-ellipse of revolution (Fig. 1b) and to compare this energy with results for a toroidal fusion pore (Fig. 1a) (Kozlov et al. 1989; Chizmadzhev et al. 1995). An ellipse that generates an ellipsoidal surface of revolution around a central axis at x = 0 (Fig. 1b) takes the form
Fig. 1.
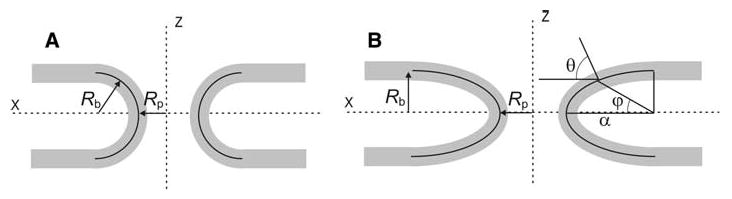
Fusion pores modeled as toroidal (a) and ellipsoidal (b) surfaces of revolution around the z-axis. Rp is the pore radius from the central axis to the central plane of the bilayer. Rb is half the limiting separation between the parallel bilayer midplanes (b) as well as a principal (meridian) radius of curvature of the toroid (a). The angle φ is used to parameterize the ellipse (Eqs. 2a and 2b). The horizontal axis and contour normal form an angle, θ, which is useful in calculating R2 (the parallel radius of curvature) with the aid of Meunier's theorem (see text)
| (2a) |
| (2b) |
x and z are coordinates with respect to the origin at the fusion pore center. α and Rb are half the dimensions of the ellipse. The angle φ ranges from −π/2 to π/2. The fusion pore is narrowest at z = 0 (or φ = 0), and this defines its radius, Rp, as the distance along the x-axis from the origin to the central plane of the bilayer. The lumen of a fusion pore has a radius of Rp minus half the thickness of a bilayer (∼1.75 nm). Rb is the limiting z-coordinate of the upper membrane, at its central plane far from the site of fusion (large x); Rb thus equals half the bilayer separation distance. 2Rb is roughly the length of the fusion pore. Repulsive forces between bilayers (Parsegian et al. 1979) set Rb ≥ 3 nm.
R1 and R2 for an ellipsoid of revolution were derived using standard formulas of differential geometry (Kreyszig 1991).
| (3) |
| (4) |
Note that in the present case, as well as for surfaces of revolution in general, Meunier's theorem gives the ratio {Rp + α[1 − cos(φ)]}/R2 as the cosine of the angle, θ, between the x-axis and the surface normal (Fig. 1b). This angle can be shown by a straightforward calculation to be , from which one can show that . This makes Eq. 4 transparent. Equation 1 (without Cb-0) now takes the form
| (5) |
This integral was evaluated and minimized numerically with respect to α and/or Rb. Fixing α = Rb yielded the toroidal results, as expected. Taking Rb/Rp = 0.6 (a value for which a toroidal fusion pore has an energy minimum of 75.82 kT [Chizmadzhev et al. 1995]) and minimizing Eq. 5 by varying only the parameter α yielded a value of 16.35 kT for α = 2.1 Rb. With respect to variations of all of the geometric parameters of Eq. 5, Eb had a minimum of 4.07 kT, with the parameters in the ratio α:Rb:Rp = 14.7:3.6:1. This analysis of the ellipsoidal model demonstrates that shape can have a profound effect on fusion pore membrane bending energy, as emphasized previously (Markin and Albanesi 2002). We will now turn to more general representations of shape to find the structure that minimizes the energy.
General Fusion Pore Shapes for a Single Neutral Surface: Analysis
To express fusion pore shape more generally, the radius of curvature of a curve through the x–z plane is taken as a function of distance, s, along that curve (Fig. 2). This function, Rn(s), fully defines a plane curve and in the present case represents what is often referred to as the radius of meridian curvature of the surface of revolution (taken here as R1 of Eq. 1). This representation is termed a natural equation of a curve (Kreyszig 1991, see Sect. 20).
Fig. 2.
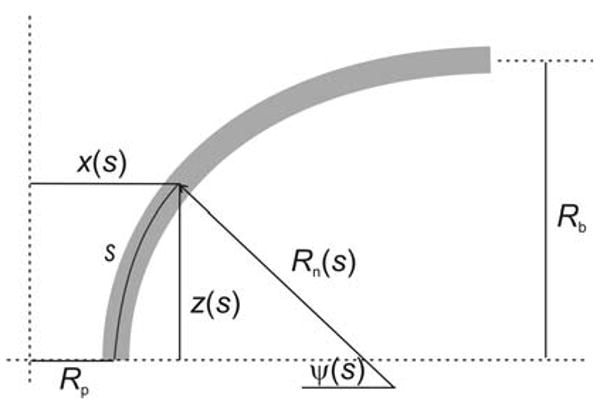
A representation of the curve used to generate a fusion pore as a surface of revolution. Rn(s) represents the meridian radius of curvature as a function of distance, s, along the curve. ψ(s), x(s) and z(s) are given by Eqs. 6, 7a and 7b, respectively
To obtain an expression for R2(s), the other principal radius of curvature (often referred to as the radius of parallel curvature of a surface of revolution), first note that the angle ψ, formed by the normal to the curve with respect to the horizontal axis (Fig. 2), changes with s as dψ = ds/Rn(s) so that
| (6) |
Note that this assumes contours are vertical at s = 0, i.e., ψ(0) = 0. It is possible for the upper and lower contours to come together with an inflection at s = 0 by allowing the chains to tilt, but tilt is neglected in the present analysis. For the x- and z-coordinates in this representation, the increments dx and dz are sin(ψ)ds and cos(ψ)ds, respectively. Using Eq. 6 for ψ and integrating gives
| (7a) |
| (7b) |
The radius of a horizontal section is readily recognized as x(s). With the aid of Meunier's theorem and Eqs. 6 and 7a, 7b, we then have
| (8) |
Using these expressions for the two principle radii of curvature, Eq. 1 gives the bending energy as
| (9) |
The integration over φ in the range (−π/2, π/2), as performed for the ellipsoid above, has been replaced by an integration over s in the range (0, smax). Since this represents half of the fusion pore above the mid-plane, the expression was multiplied by 2. smax is a parameter related (but not equal) to the lateral extent of the membrane deformation around the fusion pore. It defines the size of the relevant region of membrane and will be determined in the energy minimization procedure. Beyond s = smax the shape is irrelevant because that part of the membrane does not change during pore formation.
The goal is to minimize Eq. 9 by varying Rn(s). However, this function must satisfy two geometric constraints. First, the contour becomes horizontal at its end point (as in the circular and elliptical contours in Fig. 1). Thus, at s = smax, we have ψ = π/2. Equation 6 gives this constraint as
| (10) |
Furthermore, at s = smax the contour reaches a limiting z value of Rb. Equation 7b then gives
| (11) |
Equations 9–11 form a system with which an arbitrary choice of Rn(s) can be tested. The general strategy now is to express Rn(s) as a polynomial in s and vary the parameters to minimize Eq. 9 subject to the constraints in Eqs. 10 and 11. Rn(s) was tested as a polynomial
| (12) |
and as an inverse polynomial
| (13) |
Note that fixing Rn(s) = a in Eq. 20 or 1/a in Eq. 13 and integrating Eq. 9 numerically recapitulates the toroidal results, as expected.
The procedure was to vary the coefficients a, b, c,… in Eq. 12 or 13, together with smax, and minimize Eb computed from Eq. 9, subject to the constraints represented by Eqs. 10 and 11. This constrained minimization was carried out with Mathcad. Equation 9 was integrated numerically with either the Romberg or the adaptive-quadrature method. Minimization employed either the conjugate-gradient method or a quasi-Newton method. Different methods and initial guess values were tested and gave identical results except for extreme values of Rp/Rb, where the process was too time-consuming. The energy calculated by this minimization procedure was denoted as . It was found that polynomials in the form of Eq. 12 yielded energy minima lower than those obtained for an ellipsoidal pore, while inverse polynomials (Eq. 13) yielded energy minima that were higher. In general, third-order polynomials yielded energy minima that were not reduced significantly by the addition of fourth- and fifth-order terms. Because the coefficients of odd terms were often small, higher-order even polynomials were also tested; but the energies obtained by minimization were slightly higher than those obtained using a third-order polynomial. Thus, the third- or fourth-order form of Eq. 12 was judged a suitable representation of the curve that generates an energy minimized fusion pore as its surface of revolution. In the initial minimizations, the parameter a in Eq. 12 was sometimes found to be <2 nm. This means that Rn(0) is close to half the thickness of a lipid bilayer. To avoid this unphysical result, the constraint a > 2 was incorporated during the minimization; and to maintain Rn(s) > 2 as s increases, the constraint b > 0 was also imposed. These constraints produced relatively small increases in the minimum energy and yielded Rn(s) > 2 nm for the entire contour.
General Fusion Pore Shapes: Results
The minimum fusion pore bending energy, , was analyzed in detail. For Rp/Rb = 0.6, , which is significantly lower than the value of 16.3 kT obtained above for an ellipsoidal pore with Rp/Rb in the same ratio. For a given value of Rb, increasing Rp produced a monotonic increase in . This is illustrated in Fig. 3a with Rb = 3 nm and Cb-0 = 0. The plot only goes down to Rp = 2 nm, but further reductions in Rp down to 0.2 nm produced a monotonic reduction in (removing the constraints a > 2 and b > 0 mentioned above). determined in this process does not appear to have a local minimum for a particular set of dimensions, although computation times became prohibitive for Rp > 0.2 nm, so this could not be explored thoroughly. If this representation of the fusion pore has no energy minimum for a finite value of Rp, this would contrast the toroidal and ellipsoidal results above, as well as the two-monolayer model examined in the following section.
Fig. 3.
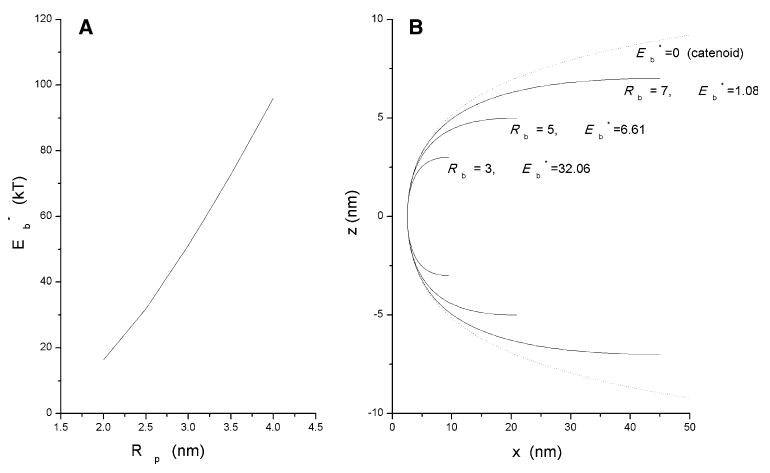
a Plots of fusion pore energy (Eb*) vs. fusion pore radius (Rp) for a single-contour bilayer. was obtained by minimizing Eq. 9 with Rn(s) represented as a polynomial (Eq. 12) of third order. b Shapes of curves that minimize (Eq. 9) for Rb = 3, 5 and 7 nm (Rp = 2.5 nm, C0 = 0). The larger values of Rb led to lower values of . The dashed curve is a catenary fitted by eye around the largest energy-minimized fusion pore. Note that the x- and z-axes have different scales in b
The smallest value plotted (Rp = 2.0 nm) gives a fusion pore energy, , of 16.4 kT. For fixed Rp = 2.5 nm, increasing Rb reduced . At Rb = 7 nm, was 1.08 kT; at Rb = 11 nm was 0.11 kT (Fig. 3b); at Rb = 16 nm was 0.00094 kT. The fusion pore contours illustrate how increasing Rb leads to shapes more closely resembling a catenoid (dashed curve in Fig. 3b). Thus, as membrane separation increases, the shape approaches a catenoid, for which membrane bending energy is zero (Kozlov and Chernomordik 1998; Siegel 2006, 2008). smax also increased (roughly as the square of Rb), indicating that the deformation spreads out to greater values of x. As with decreasing Rp noted above, increasing Rb reduced gradually without producing a local minimum within the range of values explored. However, as with very small values of Rp, with large values of Rb computation times became prohibitive.
The present analysis of bending energy for a single surface will be superseded by the following analysis of the two-monolayer model. The main value of the single-surface model was to develop and test the mathematical method. However, as a final point, the curvatures of the minimal energy surface will be presented. This permits an evaluation of the assumption of zero mean curvature (Markin and Albanesi 2002). Figure 4 presents plots of the parallel, meridian and mean curvatures vs. x for an energy minimized structure with Rp = 2.5 nm and Rb = 3 nm. This plot shows compensation between the two principal curvatures, but a finite mean curvature persists through the entire fusion pore. The absolute value of the meridian curvature is greater than that of the parallel curvature throughout, leading to a uniformly positive mean curvature.
Fig. 4.
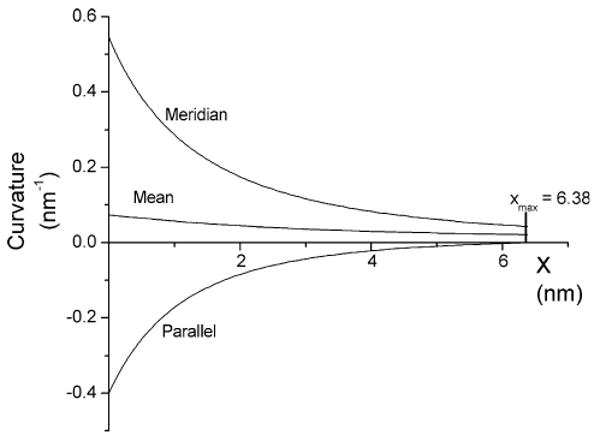
Plots of meridian, parallel and mean curvature vs. x for a fusion pore with Rp = 2.5 nm and Rb = 3 nm. (single-contour bilayer). Meridian curvature was calculated from Eq. 12 with a = 1.828, b = 0.0245, c = 0.359 and smax = 7.722. Parallel curvature was calculated from Eq. 8. The mean curvature was the arithmetic mean of the parallel and meridian curvatures
Bending Energy of a Bilayer Composed of Two Monolayers
A lipid bilayer is composed of two monolayers, each with a neutral surface displaced from the central plane of the bilayer. (At a neutral surface no lateral compression or expansion occurs during bending.) As a result, modeling an infinitesimally thin bilayer with a single neutral surface underestimates the membrane bending energy. This can be remedied by treating each monolayer as a separate surface (Markin and Albanesi 2002; Kozlovsky and Kozlov 2003). The neutral surfaces of the two monolayers of a bilayer cannot simultaneously satisfy their own condition of minimum energy. For example, a single-surface toroidal pore has a minimum energy at the ratio Rp/Rb = 0.6 (Chizmadzhev et al. 1995). If the central plane of a bilayer satisfies this ratio, then the inner monolayer along the pore interior (the trans or distal monolayers of the two fusing membranes) will have a neutral surface displaced to smaller Rp and larger Rb, while Rp and Rb of the cis or proximal monolayer will be displaced in the opposite way. Thus, one monolayer will have Rp/Rb > 0.6 while the other will have Rp/Rb < 0.6. Both of these deviations displace the monolayers from their energy minima, thus increasing the total energy. The toroidal fusion pore energies for each monolayer were evaluated using Eq. 4 of Chizmadzhev et al. (1995), with their neutral surfaces separated by 2 nm, Rb = 3 nm and Bm = 10 kT. Variation of Rp yielded a minimum of 157 kT at Rp/Rb = 0.784. Thus, the minimum energy of the toroidal two-monolayer model is a bit more than double that calculated for the corresponding bilayer (Markin and Albanesi 2002). Increasing Rb to 10 nm reduced the minimum energy to 83.2 kT at Rp/Rb = 0.623, and increasing Rb further led to the limit of the single-surface bilayer result. For radii of curvature approaching the bilayer thickness, bending energies are especially sensitive to the displacement of the monolayer neutral surfaces from the bilayer midplane. The two-monolayer model directly addresses this shortcoming of the single-surface representation of a lipid bilayer.
Two Monolayers: Analysis
To extend the above analysis to two monolayers, consider how their neutral surface contours are arranged within the x–z plane (Fig. 5). First, take the contour of the outer monolayer (farthest from the fusion pore axis, formed by the cis monolayers of the two fusing membranes) as Ro(so), where so is the distance along that contour. The x-coordinate for Ro(so) is similar to the x-coordinate of Rn(s) (Eq. 7a).
Fig. 5.
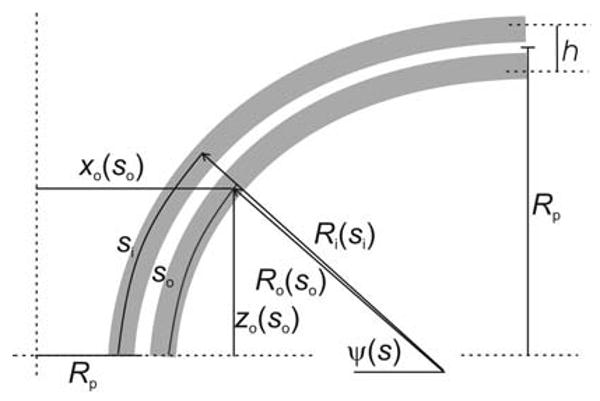
A bilayer composed of two monolayers. This model builds on the single-contour model of Fig. 2. The outer monolayer has a meridian curvature of Ro(so). The inner monolayer has a meridian curvature of Ri(si). Each monolayer has its corresponding x- and z-coordinates. The distance between the neutral planes of the two monolayers is h
| (14) |
The addition of h/2 (half the distance between the two monolayer neutral surfaces, see Fig. 5) to Rp reflects the displacement along the x-axis of the neutral plane of the monolayer from the midplane of the bilayer (Rp is still used for the distance from the z-axis to the bilayer midplane). The bending energy of the outer monolayer, Eb-o-m, is then Eq. 9 but with Bm, so, xo(so) and Ro(so) replacing Bb, s, x(s) and Rn(s), respectively.
| (15) |
Cm-o-0 is the spontaneous curvature of the outer monolayer.
We express the neutral surface contour of the inner monolayer as a contour parallel to that of the outer monolayer neutral surface, with a separation of h.
| (16) |
Note that so must be used as the independent variable for both Ri and Ro because the energy minimization depends on a common representation of the bending energies of both monolayers. The incremental displacement dsi along the outer contour is related to dso by the ratio of the two radii.
| (17) |
The x-coordinate for Ri(so) still employs Eq. 6 for ψ(so), but dsi (actually dti) must be replaced using Eq. 17.
| (18) |
Now, for the inner monolayer the analogous expression to Eq. 15 gives the bending energy as
| (19) |
Note that this monolayer has a spontaneous curvature of Cm-i-0, which can be different from Cm-o-0 of the outer monolayer. In comparing Eqs. 15 and 19, the following points should be mentioned. xi(so) from Eq. 18 has replaced xo(so). The signs of the principal curvatures are reversed between the two equations because the curvatures are opposite in the two opposing monolayers. h has been added to Ro(so) in the denominator of the first term (see Eq. 16). The final factor in Eq. 19 reflects the conversion of dsi to dso using Eq. 17.
The total bilayer bending energy of a fusion pore for the two-monolayer model, Eb-m, is obtained by adding Eqs. 15 and 19. The shapes of both monolayers are expressed in terms of Ro(so). Thus, using a polynomial representation of this function in the form of Eq. 12 provides a parametric representation of the total bending energy, which can be minimized numerically by varying the polynomial coefficients and so-max.
For the two-monolayer model the constraints represented by Eqs. 10 and 11 become
| (20) |
| (21) |
Just as varying smax and the polynomial coefficients in the representation of Rn(s) subject to the constraints of Eqs. 10 and 11 yielded as the minimum of the integral that represents the bilayer bending energy (Eq. 9), so the same method, varying so-max and the polynomial coefficients in the representation of Ro(so) subject to the constraints of Eqs. 20 and 21, yielded as the minimum for the sum of the two-monolayer bending energies (the sum of Eqs. 15 and 19).
Finally, for non-zero spontaneous monolayer curvatures, Cm-o-0 and Cm-i-0, prior to fusion pore formation, the flat regions of membrane that become the fusion pore have a non-zero bending energy. Once Ro(so) has been determined by minimization of the sum of Eqs. 15 and 19, it can be used to calculate the area of the deformed membrane. Because these regions are flat prior to fusion pore formation, the bending energies are obtained simply from and times the respective areas.
| (22) |
| (23) |
These expressions sum to give , the initial energy of the sections of membrane drawn into the fusion pore. Subtracting this from gives , the change in bending energy for formation of a fusion pore from the constituent monolayers of two flat lipid bilayers. For non-zero values of Cm-0, the energies defined by Eqs. 22 and 23 depend on Rb and Rp. This has the important consequence that and will exhibit different dependences on Rb and Rp. The energy landscape for the formation of a fusion pore will then differ from the energy landscape after it forms. This is illustrated in a supplemental file that shows plots of , and vs. Rp and how the minima of and differ slightly. The different minima mean that the shape of the fusion pore that is easiest to create from two flat membranes will differ from the shape with lowest energy, and a newly formed fusion pore will relax in shape to a different energy minimum. The reason for this is that for a given choice of Rb and Rp the areas of inner and outer leaflet drawn into the pore will vary. If the spontaneous curvatures of both monolayers equal zero, then the distinction between and disappears.
Two Monolayers: Results
Solutions to this two-monolayer minimization problem provide membrane bending energies that are more relevant to the process of membrane fusion than the energies computed above for a bilayer represented as a single surface. Aside from the basic dimensions of the pore, Rp and Rb, the minimal energy of the two-monolayer model depends on three other important parameters, h (Fig. 5), Cm-i-0 and Cm-o-0. To estimate h, we start with the determination by Markin and Albanesi (2002) that the neutral surface is 0.73 nm from the polar surface of dioleoylphosphatidylethanolamine (DOPE) (based on data from Fuller and Rand 2001). With a 3.6 nm bilayer thickness (Fuller and Rand 2001) this gives h = 2.1 nm. DOPE has 18-carbon acyl chains; but shorter chains are also common in biological membranes, so it will be useful to estimate h for phospholipids with 16-carbon acyl chains. This amounts to a roughly 0.4-nm reduction in the distance between the polar headgroups of a bilayer (Lewis and Engelman 1983), and since the neutral surface should stay at about the same distance relative to the polar headgroups, h will be reduced to 1.7 nm. Minimization was carried out for h = 1.7 and 2.1 nm, giving results with modest differences.
In a symmetric bilayer Cm-o-0 = Cm-i-0. Allowing the two monolayer spontaneous curvatures to differ will allow us to explore the consequences of bilayer asymmetry. Cm-0 for most phospholipids is negative. For dioleoylphosphatidylcholine (DOPC) Cm-0 ∼ −0.1 nm−1 (Chen and Rand 1997). However, Cm-0 varies widely between lipid species; and since the two monolayers of biological membranes can have different compositions, their spontaneous curvatures can vary. For dioleoylphosphatidylserine (DOPS) Cm-0 = + 0.07 nm−1 (Fuller et al. 2003), and for DOPE Cm-0 = −0.33 nm−1 (Leikin et al. 1996); the inner leaflets of the plasma membrane contain most of the PE and virtually all of the PS (Pomorski et al. 2001; Daleke 2003). Depending on the distribution and relative abundance of these various lipids, we can envision phospholipid asymmetry of either sign. Here, we will test spontaneous curvatures in the range suggested for mixtures of these species in both symmetric and asymmetric membranes.
For selected values of h, Cm-o-0 and Cm-i-0, energies were first determined for a fusion pore with Rb = 3 nm as this represents the distance of closest approach, determined by the repulsive forces between lipid bilayers (Parsegian et al. 1979). The energy of formation of a fusion pore from two bilayers, , was determined for Rp ranging 2–7 nm (Fig. 6). We see that these plots have minima at Rp slightly above 2 nm. With h = 1.7 and Cm-o-0 = Cm-i-0 = −0.1, the minimum was at Rp = 2.15 nm (Fig. 6a). Increasing h to 2.1 increased the minimum value of to 65.52 kT and shifted Rp to 2.35 nm (Fig. 6b). The finding of minima in these plots is significant in that it indicates that a fusion pore can be metastable, and this point will be expanded upon below after presenting additional results. Making Cm-0 negative reduced and making it positive increased , without a noticeable shift in the position of the minimum. These changes in with Cm-0 are consistent with the greater contribution from meridian curvature (Fig. 4) and confirm the findings that more negative values for Cm-0 promote fusion (Chernomordik and Kozlov 2003, 2008; Katsov et al. 2004).
Fig. 6.
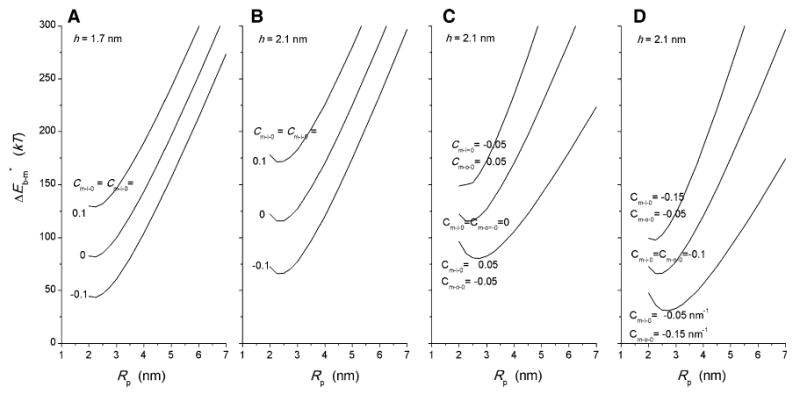
Plots of fusion pore energy of formation, , vs. fusion pore radius, Rp, for Rb = 3 nm and the indicated values of h, Cm-o-0 and Cm-i-0
Since varying h had rather modest effects, asymmetric bilayers were analyzed only for h = 2.1 nm. Making bilayers asymmetric while keeping Cm-o-0 + Cm-i-0 constant changed both the energy and position of the minimum in the vs. Rp plots (Fig. 6c, d). In general, making the inner monolayer negative with respect to the positive monolayer increased and shifted the minimum to smaller Rp values. The changes in Rp at the energy minima in Fig. 6c and d look relatively modest, with shifts from 2.1 to 2.7 nm. However, once the monolayer thickness (1.75 nm) has been subtracted, the radius of the pore lumen ranges 0.35–0.95 nm. Since conductance scales as lumen radius squared, we see that varying bilayer asymmetry in this range can alter fusion pore conductance by nearly eightfold. Bilayer asymmetry also has a large impact on . Inverting the asymmetry between ± 0.1 nm−1 changes by ∼75 kT. Clearly, making the spontaneous curvature of the inner monolayer of the fusion pore positive with respect to the outer monolayer strongly aids in the formation of fusion pores. This confirms an analysis based on a microscopic model (Lee and Schick 2007) and is consistent with experimental reports that this form of lipid asymmetry promotes fusion (Bailey and Cullis 1994).
The effect of membrane asymmetry on fusion pore shape is illustrated in Fig. 7. The shapes generated by the structures with the minimum in Fig. 6c are shown in Fig. 7a (left) and the shapes generated by the structures with the minimum in Fig. 6d are shown in Fig. 7b (left). These results illustrate the subtle effects of asymmetry on pore radius. It is interesting to note that the pores with more negative spontaneous curvature in both monolayers appear more toroidal. The differences in shape can be evaluated objectively by examining plots of R1 vs. x (right sides of Fig. 7a, b). For a toroid R1 should be a horizontal line. The plots are much steeper for the curves with Cm-o-0 + Cm-i-0 = 0 than for a sum of −0.2 nm−1. Within each group the curves differ only slightly, indicating that asymmetry does not strongly influence pore shape.
Fig. 7.
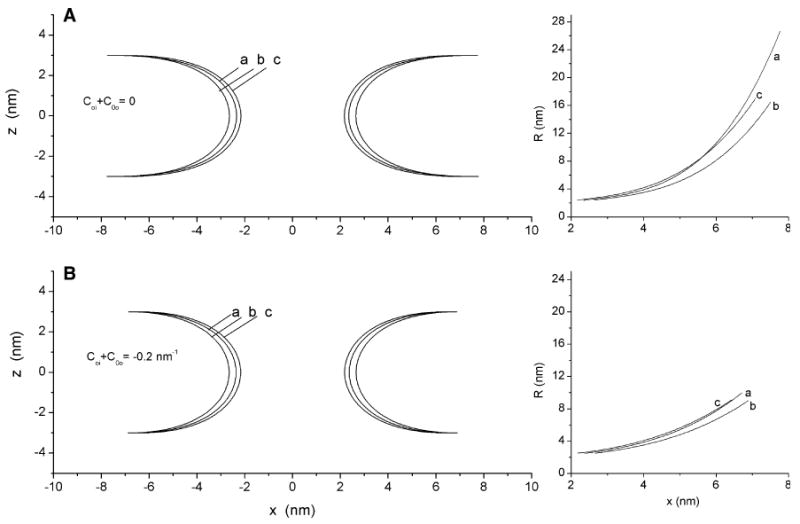
Shapes of minimal energy fusion pores for symmetric and asymmetric bilayers with Rb = 3 nm. Plots on the left show bilayer midplane contours and plots on the right show the radius of meridian curvature, R(s), of the bilayer midplane as a function of distance from the pore axis. a Bilayer midplanes for the minima from Fig. 6c show the shape of minimal energy fusion pores with the monolayer spontaneous curvatures summing to 0. a Cm-i-0 = Cm-o-0 = 0, b Cm-i-0 = 0.05 nm−1 and Cm-o-0 = −0.05 nm−1, c Cm-i-0 = −0.05 nm−1 and Cm-o-0 = 0.05 nm−1. b Bilayer midplanes for the minima from Fig. 6d show the shape of minimal energy fusion pores with the monolayer spontaneous curvatures summing to −0.2 nm−1. a Cm-i-0 = Cm-o-0 = −0.1 nm−1, b Cm-i-0 = −0.05 nm−1 and Cm-o-0 = −0.15 nm−1, c Cm-i-0 = −0.15 nm−1 and Cm-o-0 = −0.05 nm−1
It is possible that bilayers could fuse from distances greater than Rb = 3 nm. Proteins can induce membrane curvature (Zimmerberg and Kozlov 2006), and protein scaffolds have been proposed to aid fusion by curving membranes toward one another (Monck and Fernandez 1994; Kozlov and Chernomordik 1998). Such a scaffold would allow fusion pores to form from membranes separated by greater distances, and this situation can be modeled by larger values of Rb. To explore the effectiveness of a membrane curving protein scaffold in promoting fusion, plots of were generated on the Rp − Rb surface (Fig. 8). Taking Cm-o-0 = Cm-i-0 = −0.1 nm−1, Rp was varied from 2 to 7 nm and Rb was varied from 3 to 9 nm. For both h = 1.7 and 2.1 nm, these surfaces had local minima. Again, these results indicate that a fusion pore governed by continuum elasticity can be metastable. For h = 1.7 nm, had a local minimum of 12.97 kT at Rp = 3.3 nm and Rb = 5.45 nm (Fig. 8a). For h = 2.1 nm, had a local minimum of 11.54 kT at Rp = 3.8 nm and Rb = 6.05 nm (Fig. 8b). For an asymmetric bilayer with h = 2.1, Cm-o-0 = −0.05 nm−1 and Cm-i-0 = −0.15 nm−1 a local minimum of 55.7 kT was found at Rp = 2.9 nm and Rb = 5.3 nm (Fig. 8c). Note that with Rb = 3 nm this asymmetric case had a minimum of 97.4 kT at Rp = 2.2 nm (Fig. 6d). Thus, allowing the membrane separation to increase reduced the energy of fusion pore formation substantially by giving membranes greater freedom to assume shapes with lower energy.
Fig. 8.
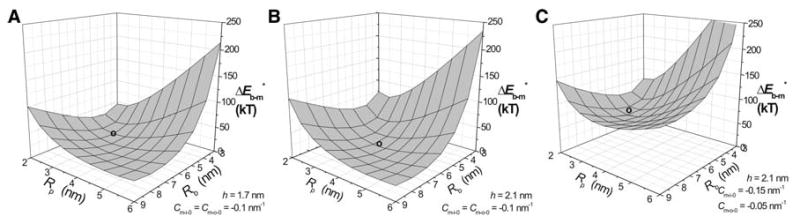
was determined for a range of values of Rp and Rb and plotted as an energy surface for these two parameters. Cm-i-0 = Cm-o-0 = −0.1 nm−1 for a and b and Cm-i-0 = −0.15 nm−1, Cm-o-0 = −0.05 nm−1 for c. h = 1.7 nm for a and 2.1 nm for b and c. The symbol o marks the local energy minimum of 12.97 kT at Rp = 3.3 nm and Rb = 5.45 nm (a), 11.54 kT at Rp = 3.8 nm and Rb = 6.05 nm (b) and 55.7 kT at Rp = 2.9 nm and Rb = 5.3 nm (c)
Regardless of the initial Rb value, once a fusion pore has formed, it can reduce its energy by changing Rp and Rb. This is a consequence of the point made above that the pore that is easiest to form is not the structure of minimum energy. Thus, differs from and, as a result, a fusion pore can relax to a new shape after it has formed. To explore how the structure of a nascent fusion pore might evolve, was plotted over the Rb − Rp surface (Fig. 9). These plots have local minima different from those in Fig. 8. These energy surfaces are also higher than those of Fig. 8 because initial energy, (Eq. 22 + Eq. 23), was not subtracted (see supplemental file). For h = 1.7 and Cm-o-0 = Cm-i-0 = −0.1 nm−1, the surface had a minimum at Rp = 2.4 nm and Rb = 3.7 nm. For h = 2.1 nm, the minimum appeared at Rp = 2.75 nm and Rb = 4.2 nm. For asymmetric bilayers (Cm-o-0 = −0.05 nm−1 and Cm-i-0 = −0.15 nm−1) with h = 2.1 nm, the minimum appeared at Rb = 3.9 nm and Rp = 2.35 nm. These local minima represent structures into which a fusion pore will settle after it has formed, provided that membrane bending energy is the dominant factor. This result implies that fusion pores will undergo a structural change immediately after formation. In comparing the contour plots of Figs. 8 and 9, Fig. 8 should be viewed as a part of the energy landscape relevant to the formation of a fusion pore from membranes held at a given distance; these surfaces are relevant to the pathway for entry into a fusion pore state. Figure 9 should be viewed as the energy landscape relevant to the structural evolution of the fusion pore after it has formed. Thus, if a fusion pore forms from bilayers held at Rb = 3 nm, it will initially have a radius Rp ∼ 2.2 nm. From this initial state it will grow to Rp ∼ 2.6 nm as Rb increases to ∼4 nm. On the other hand, if a fusion pore forms with the aid of a protein scaffold from bilayers held at a larger Rb value, it will start off at the local minimum in the energy of formation surface plot (Fig. 8), where Rp ∼ 3.5 nm and Rb ∼ 5.7 nm. It will subsequently shrink to the dimensions of the minimum in the bending energy surface plot (Fig. 9) with Rp ∼ 2.5 nm and Rb ∼ 4 nm.
Fig. 9.
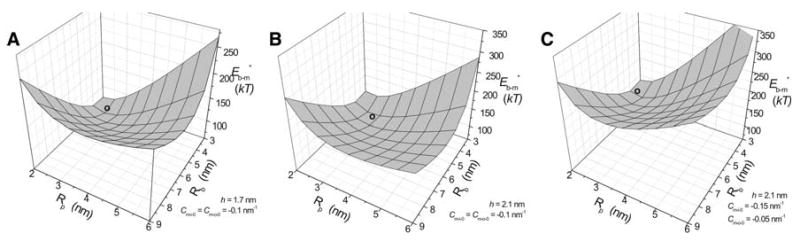
was determined for a range of values of Rp and Rb and plotted as an energy surface, h = 1.7 nm for a and 2.1 nm for b and c. Cm-i-0 = Cm-o-0 = −0.1 nm−1 for a and b, and Cm-i-0 = −0.15 nm−1, Cm-o-0 = −0.05 nm−1 for c. The symbol o marks the local energy minimum of 66.65 kT at Rp = 2.4 nm and Rb = 3.7 nm (a), 75.19 kT at Rp = 2.75 nm and Rb = 4.2 nm (b) and 120.5 kT at Rp = 2.37 nm and Rb = 3.9 nm (c)
The presence of these local minima in the Rp − Rb energy surfaces represents a significant departure from the single-surface model analyzed above and underscores the importance of treating the system in terms of its two constituent monolayers. The local minima in the potential energy surfaces of Figs. 8 and 9 are unique points and will not be preserved with proportional changes in Rp and Rb. By contrast, the energy minimum of the toroidal fusion pore at Rp/Rb = 0.6 remains the same as these two dimensions change in parallel (Chizmadzhev et al. 1995). In the present analysis the bilayer thickness comes into play through the parameter h, so this scaling property is lost. As a result, these local energy minima in Figs. 8 and 9 are significant landmarks on the membrane bending energy landscape of a fusion pore.
Since the shapes that produce these local energy minima are unique, they are presented in Fig. 10. Protein scaffolds can promote fusion pore formation by generating these shapes with minimum energies of formation (Fig. 10a–c). Fusion pores that form will then evolve to the shapes with minimum energies (Fig. 10d–f).
Fig. 10.
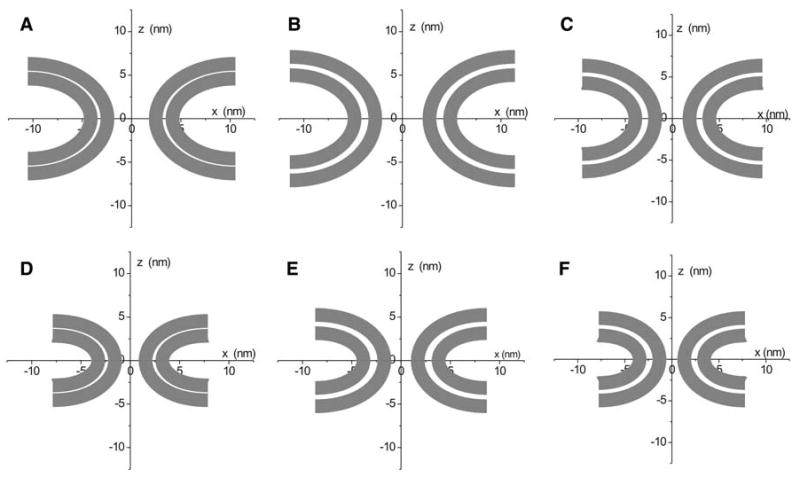
Contours for fusion pores with minimal energies from Fig. 8a–c and from Fig. 9d–f. The values of the parameters from Eq. 12 for each contour are a h = 1.7, Rp = 3.3 nm, Rb = 5.45 nm, Cm-i-0 = Cm-o-0 = −0.1 nm−1, a = 3.015, b = 0.598, c = 0.025, d = −0.000218, smax = 8.686; b h = 2.1, Rp = 3.8 nm, Rb = 6.05 nm, Cm-i-0 = Cm-o-0 = −0.1, a = 3.604, b = 0.45, c = 0.02, d = 0.000493, smax = 9.145; c h = 2.1, Rp = 2.9 nm, Rb = 5.3 nm, Cm-i-0 = −0.15 nm−1, Cm-o-0 = −0.05 nm−1, a = 3.457, b = −0.228, c = 0.252, d = −0.02, smax = 7.845; d h = 1.7, Rp = 2.4 nm, Rb = 3.7 nm, Cm-i-0 = Cm-o-0 = −0.1 nm−1, a = 1.717, b = 0.663, c = 0.00791, d = 0.021, smax = 5.992; e For h = 2.1, Rp = 2.75 nm, Rb = 4.2 nm, Cm-i-0 = Cm-o-0 = −0.1 nm−1, a = 2.188, b = −0.00681, c = 0.336, d = −0.026, smax = 6.436; f h = 2.1, Rp = 2.37 nm, Rb = 3.9 nm, Cm-i-0 = −0.15 nm−1, Cm-o-0 = −0.05 nm−1, a = 2.068, b = −0.083, c = 0.368, d = −0.03, smax = 5.752
Discussion
This study presents the first quantitative solution to the energy minimization problem of fusion pores within the classical elastic continuum framework. The energies generally fell below the upper bounds derived from the assumption of a toroidal shape (Markin et al. 1984; Kozlov et al. 1989; Chizmadzhev et al. 1995). The energy-minimized fusion pores have a significant mean curvature, so the stress-free assumption (Markin and Albanesi 2002) underestimates the energy. A two-monolayer representation led to substantially higher fusion pore energies than the single-surface representation, as well as qualitative changes in the shape of the energy landscape. The energies from the two-monolayer model are more relevant to real membranes and provide valuable insight into the process of membrane fusion.
The present results indicate that fusion pores have substantial bending energies, and their formation requires a significant amount of work. Because formation of a fusion pore from two separate membranes involves a change in topology, the Gaussian curvature will change and contribute an additional term to the energy. This will not alter the shapes computed here, but this term may increase the energy of fusion pore formation by a substantial amount (Siegel and Kozlov 2004). A biological process must provide the energy to overcome this barrier and drive membrane fusion. Of course, other energetic obstacles lie between the configurations represented by two separate bilayers and a merged fusion pore, and these will also have to be overcome. If two bilayers must approach one another closely to form a fusion pore, the repulsive forces (Parsegian et al. 1979) will set the initial value for Rb of a nascent fusion pore to ∼3 nm. The minima in Fig. 6 then indicate that when two membranes form a fusion pore, the favored radius will be Rp ∼ 2.25 nm. Figure 6 thus locates a likely entry point for two bilayers to merge into a fusion pore when they are brought into close proximity. Subtracting half the bilayer thickness from this initial Rp value of ∼2.25 nm gives an aqueous lumen with a radius of ∼0.5 nm. This falls within the low end of the range of radii calculated from conductance measurements (Lindau and Almers 1995; Klyachko and Jackson 2002; Lindau and Alvarez de Toledo 2003), and considering that this value was arrived at without adjusting free parameters, this result is an important validation of the continuum elasticity model of a fusion pore.
After formation, a fusion pore structure can change to minimize its bending energy. This will lead to a structure defined by the local minima in Fig. 9, where Rb = ∼ 4.05 nm and Rp ∼ 2.55 nm; the aqueous lumen has a radius of ∼0.8 nm. For fusion pores starting off with Rb = 3 nm and Rp ∼ 2.25 nm (lumen radius ∼0.5 nm), this amounts to a ∼2.5-fold increase in area and probably a comparable increase in conductance. (Although the increase in Rb works in the opposite direction, this will have a smaller impact.) During viral fusion an initial pore of ∼150 pS grows in a few milliseconds to ∼400–500 pS (Spruce et al. 1991). This could reflect the kind of relaxation suggested by these energy landscapes, from an initial shape (Fig. 8) to a new metastable shape corresponding to the energy minimum on the Rp−Rb surface of Fig. 9. These surfaces thus offer an interpretation for an early kinetic step that has been experimentally observed in fusion pore dynamics. The multiple kinetic stages of viral fusion (Melikyan et al. 1993) could also reflect a downhill movement along the potential energy surface calculated here. Thus, the theoretical results presented here offer a novel explanation for some interesting experimental observations of membrane fusion.
Membrane thickness, as modeled by two choices of the parameter h (1.7 and 2.1 nm), had a modest effect on the energies of fusion pores; but this ignores the possibility that the flexural rigidity can vary with membrane thickness, and incorporating this dependence will make the thickness dependence somewhat greater. By contrast, spontaneous curvature has a considerable impact. Naturally occurring membrane lipids have monolayer spontaneous curvatures spanning a wider range than tested here (Zimmerberg and Kozlov 2006), so we can expect lipid composition to have a strong influence on the kinetics of membrane fusion. Making Cm-0 more negative reduced the energy of fusion pore formation, and this result is consistent with experiments (Chernomordik and Kozlov 2003, 2008) and theory (Katsov et al. 2004) showing that lipids with this property promote fusion. Furthermore, the plasma membrane has an asymmetric distribution of lipids, with PS and PE concentrated in the inner membrane monolayer (Pomorski et al. 2001; Daleke 2003). PS has a very positive spontaneous curvature and PE has a very negative spontaneous curvature. The results displayed in Figs. 6c, d and 8c indicate that different monolayer spontaneous curvatures would strongly influence the ease of fusion pore formation. Lipid asymmetry can promote membrane fusion (Bailey and Cullis 1994), and a field theoretic study of fusion between asymmetric bilayers has helped clarify the underlying mechanism (Lee and Schick 2007). Experimental studies of lipid distribution between the inner and outer monolayers of cell membranes as well as measurements of their spontaneous monolayer curvatures offer a potentially powerful approach to investigating the role of membrane bending energy in fusion kinetics.
Rather than simply pull membranes very close together to drive membrane fusion, it is possible that proteins can mold the membrane into a more favorable shape. This led to the notion of a protein scaffold (Monck and Fernandez 1994) formed by proteins that are capable of bending membranes (Zimmerberg and Kozlov 2006). The protein scaffold could facilitate fusion by shaping the membrane into a contour that approaches the shape of a minimal energy fusion pore. It may be significant that the curvatures of these minimal energy shapes are not uniform (Figs. 7, 10). Thus, a single protein with a unique preferred curvature may not be ideal for this molding function. A complex of proteins may be better adapted to creating the optimal gradient in membrane curvature and mold a membrane into a shape that is especially conducive to fusion. The present study has provided shapes of fusion pores that will help in assessing how the curvature-inducing activity of proteins is adapted to the function of membrane fusion.
The local minima in membrane bending energy surface contours in Fig. 9 are quite shallow, and a field theory treatment of fusion pores reported this as well (Katsov et al. 2004). Thus, fusion pores could undergo large thermal fluctuations in structure. Very large conductance fluctuations have been reported for some types of fusion pores (Spruce et al. 1990; Nanavati et al. 1992; Razinkov et al. 1998), and studying these fluctuations may provide insight into the role of membrane elasticity in fusion pore stability.
Previous work on the toroidal pore model showed that dimensions that minimize the energy are in a specified ratio (Chizmadzhev et al. 1995). This minimum does not specify the actual dimensions of the fusion pore. The stress-free assumption led to an energy of fusion pore formation that decreases monotonically with radius without a local minimum (Markin and Albanesi 2002). The present study showed that minimal energy shapes have unique dimensions. This novel result indicates that a fusion pore will be metastable. This result brings the classical continuum model of the fusion pore in line with more molecular treatments (Katsov et al. 2004; Lee and Schick 2007), as well as with experiments that have shown that fusion pores can be stable for hundreds of milliseconds (Chanturiya et al. 1997; Razinkov et al. 1998). How a fusion pore leaves this minimum energy shape and expands remains to be answered. The expansion of fusion pores is thought to be opposed by barriers arising from membrane bending (Chizmadzhev et al. 1995, 2000; Cohen and Melikyan 2004), and the present results support this view. Molecular dynamics simulations have indicated that fusion pores between fusing vesicles can expand very rapidly (Knecht and Marrink 2007), but the vesicles in this study had diameters of only 12.9 nm. Smaller vesicles allow for faster hemifusion diaphragm expansion (Lee and Schick 2008), and it is plausible that size influences fusion pore expansion kinetics as well. The results of the present study provide a useful approach to evaluating the energy landscape of membrane fusion in order to examine these and other kinetic processes of membrane trafficking.
Supplementary Material
Acknowledgments
I thank Jim Weisshaar, Qiang Cui, Nelson Barrera and Ed Chapman for helpful comments and discussions. I am especially indebted to Fred Cohen for many insightful comments and suggestions that greatly influenced this work. This work was supported by NIH grant NS44057.
Footnotes
Electronic supplementary material The online version of this article (doi:10.1007/s00232-009-9209-x) contains supplementary material, which is available to authorized users.
References
- Bailey AL, Cullis PR. Modulation of membrane fusion by asymmetric transbilayer distributions of amino lipids. Biochemistry. 1994;33:12573–12580. doi: 10.1021/bi00208a007. [DOI] [PubMed] [Google Scholar]
- Boal D. Mechanics of the cell. Cambridge University Press; Cambridge: 2002. [Google Scholar]
- Chanturiya A, Chernomordik LV, Zimmerberg J. Flickering fusion pores comparable with initial exocytotic pores occur in protein-free phospholipid bilayers. Proc Natl Acad Sci USA. 1997;94:14423–14428. doi: 10.1073/pnas.94.26.14423. [DOI] [PMC free article] [PubMed] [Google Scholar]
- Chen Z, Rand RP. The influence of cholesterol on phospholipid membrane curvature and bending elasticity. Biophys J. 1997;73:267–276. doi: 10.1016/S0006-3495(97)78067-6. [DOI] [PMC free article] [PubMed] [Google Scholar]
- Chernomordik LV, Kozlov MM. Protein-lipid interplay in fusion and fission of biological membranes. Annu Rev Biochem. 2003;72:175–207. doi: 10.1146/annurev.biochem.72.121801.161504. [DOI] [PubMed] [Google Scholar]
- Chernomordik LV, Kozlov MM. Mechanics of membrane fusion. Nat Struct Mol Biol. 2008;15:675–683. doi: 10.1038/nsmb.1455. [DOI] [PMC free article] [PubMed] [Google Scholar]
- Chizmadzhev YA, Cohen FS, Shcherbakov A, Zimmerberg J. Membrane mechanics can account for fusion pore dilation in stages. Biophys J. 1995;69:2489–2500. doi: 10.1016/S0006-3495(95)80119-0. [DOI] [PMC free article] [PubMed] [Google Scholar]
- Chizmadzhev YA, Kuzmin PI, Kumenko DA, Zimmerberg J, Cohen FS. Dynamics of fusion pores connecting membranes of different tensions. Biophys J. 2000;78:2241–2256. doi: 10.1016/S0006-3495(00)76771-3. [DOI] [PMC free article] [PubMed] [Google Scholar]
- Cohen FS, Melikyan GB. The energetics of membrane fusion from binding, through hemifusion, pore formation, and pore enlargement. J Membr Biol. 2004;199:1–14. doi: 10.1007/s00232-004-0669-8. [DOI] [PubMed] [Google Scholar]
- Daleke DL. Regulation of transbilayer plasma membrane phospholipid asymmetry. J Lipid Res. 2003;44:233–242. doi: 10.1194/jlr.R200019-JLR200. [DOI] [PubMed] [Google Scholar]
- Fuller N, Rand RP. The influence of lysolipids on the spontaneous curvature and bending elasticity of phospholipid membranes. Biophys J. 2001;81:243–254. doi: 10.1016/S0006-3495(01)75695-0. [DOI] [PMC free article] [PubMed] [Google Scholar]
- Fuller N, Benatti CR, Rand RP. Curvature and bending constants for phosphatidylserine-containing membranes. Biophys J. 2003;85:1667–1674. doi: 10.1016/s0006-3495(03)74596-2. [DOI] [PMC free article] [PubMed] [Google Scholar]
- Hamm M, Kozlov MM. Tilt model of inverted amphiphilic mesophases. Eur Phys J. 1998;1:519–528. [Google Scholar]
- Hamm M, Kozlov MM. Elastic energy of tilt and bending of fluid membranes. Eur Phys J. 2000;3:323–335. [Google Scholar]
- Helfrich W. Elastic properties of lipid bilayers: theory and possible experiments. Z Naturforsch [C] 1973;28:693–703. doi: 10.1515/znc-1973-11-1209. [DOI] [PubMed] [Google Scholar]
- Katsov K, Muller M, Schick M. Field theoretic study of bilayer membrane fusion. I. Hemifusion mechanism. Biophys J. 2004;87:3277–3290. doi: 10.1529/biophysj.103.038943. [DOI] [PMC free article] [PubMed] [Google Scholar]
- Klyachko VA, Jackson MB. Capacitance steps and fusion pores of small and large-dense-core vesicles in nerve terminals. Nature. 2002;418:89–92. doi: 10.1038/nature00852. [DOI] [PubMed] [Google Scholar]
- Knecht V, Marrink SJ. Molecular dynamics simulations of lipid vesicle fusion in atomic detail. Biophys J. 2007;92:4254–4261. doi: 10.1529/biophysj.106.103572. [DOI] [PMC free article] [PubMed] [Google Scholar]
- Kozlov MM, Chernomordik LV. A mechanism of protein-mediated fusion: coupling between refolding of the influenza hemagglutinin and lipid rearrangements. Biophys J. 1998;75:1384–1396. doi: 10.1016/S0006-3495(98)74056-1. [DOI] [PMC free article] [PubMed] [Google Scholar]
- Kozlov MM, Leikin SL, Chernomordik LV, Markin VS, Chizmadzhev YA. Stalk mechanism of vesicle fusion. Intermixing of aqueous contents. Eur Biophys J. 1989;17:121–129. doi: 10.1007/BF00254765. [DOI] [PubMed] [Google Scholar]
- Kozlovsky Y, Kozlov MM. Stalk model of membrane fusion: solution of energy crisis. Biophys J. 2002;82:882–895. doi: 10.1016/S0006-3495(02)75450-7. [DOI] [PMC free article] [PubMed] [Google Scholar]
- Kozlovsky Y, Kozlov MM. Membrane fission: model for intermediate structures. Biophys J. 2003;85:85–96. doi: 10.1016/S0006-3495(03)74457-9. [DOI] [PMC free article] [PubMed] [Google Scholar]
- Kreyszig E. Differential geometry. Dover; Mineola, NY: 1991. [Google Scholar]
- Kuzmin PI, Zimmerberg J, Chizmadzhev YA, Cohen FS. A quantitative model for membrane fusion based on low-energy intermediates. Proc Natl Acad Sci USA. 2001;98:7235–7240. doi: 10.1073/pnas.121191898. [DOI] [PMC free article] [PubMed] [Google Scholar]
- Kuzmin PI, Akimov SA, Chizmadzhev YA, Zimmerberg J, Cohen FS. Line tension and interaction energies of membrane rafts calculated from lipid splay and tilt. Biophys J. 2005;88:1120–1133. doi: 10.1529/biophysj.104.048223. [DOI] [PMC free article] [PubMed] [Google Scholar]
- Lee JY, Schick M. Field theoretic study of bilayer membrane fusion III: membranes with leaves of different composition. Biophys J. 2007;92:3938–3948. doi: 10.1529/biophysj.106.097063. [DOI] [PMC free article] [PubMed] [Google Scholar]
- Lee JY, Schick M. Calculation of free energy barriers to the fusion of small vesicles. Biophys J. 2008;94:1699–1706. doi: 10.1529/biophysj.107.119511. [DOI] [PMC free article] [PubMed] [Google Scholar]
- Leikin S, Kozlov MM, Fuller NL, Rand RP. Measured effects of diacylglycerol on structural and elastic properties of phospholipid membranes. Biophys J. 1996;71:2623–2632. doi: 10.1016/S0006-3495(96)79454-7. [DOI] [PMC free article] [PubMed] [Google Scholar]
- Lewis BA, Engelman DM. Lipid bilayer thickness varies linearly with acyl chain length in fluid phosphatidylcholine vesicles. J Mol Biol. 1983;166:211–217. doi: 10.1016/s0022-2836(83)80007-2. [DOI] [PubMed] [Google Scholar]
- Lindau M, Almers W. Structure and function of fusion pores in exocytosis and ectoplasmic membrane fusion. Curr Opin Cell Biol. 1995;7:509–517. doi: 10.1016/0955-0674(95)80007-7. [DOI] [PubMed] [Google Scholar]
- Lindau M, Alvarez de Toledo G. The fusion pore. Biochim Biophys Acta. 2003;1641:167–173. doi: 10.1016/s0167-4889(03)00085-5. [DOI] [PubMed] [Google Scholar]
- Markin VS, Albanesi JP. Membrane fusion: stalk model revisited. Biophys J. 2002;82:693–712. doi: 10.1016/S0006-3495(02)75432-5. [DOI] [PMC free article] [PubMed] [Google Scholar]
- Markin VS, Kozlov MM, Borovjagin VL. On the theory of membrane fusion. The stalk mechanism. Gen Physiol Biophys. 1984;3:361–377. [PubMed] [Google Scholar]
- Marsh D. Elastic curvature constants of lipid monolayers and bilayers. Chem Phys Lipids. 2006;144:146–159. doi: 10.1016/j.chemphyslip.2006.08.004. [DOI] [PubMed] [Google Scholar]
- Melikyan GB, Niles WD, Peeples ME, Cohen FS. Influenza hemagglutinin-mediated fusion pores connecting cells to planar membranes: flickering to final expansion. J Gen Physiol. 1993;102:1131–1149. doi: 10.1085/jgp.102.6.1131. [DOI] [PMC free article] [PubMed] [Google Scholar]
- Monck JR, Fernandez JM. The exocytotic fusion pore and neurotransmitter release. Neuron. 1994;12:707–716. doi: 10.1016/0896-6273(94)90325-5. [DOI] [PubMed] [Google Scholar]
- Nanavati C, Markin VS, Oberhauser AF, Fernandez JM. The exocytotic fusion pore modeled as a lipidic pore. Biophys J. 1992;63:1118–1132. doi: 10.1016/S0006-3495(92)81679-X. [DOI] [PMC free article] [PubMed] [Google Scholar]
- Parsegian VA, Fuller N, Rand RP. Measured work of deformation and repulsion of lecithin bilayers. Proc Natl Acad Sci USA. 1979;76:2750–2754. doi: 10.1073/pnas.76.6.2750. [DOI] [PMC free article] [PubMed] [Google Scholar]
- Pomorski T, Hrafnsdottir S, Devaux PF, van Meer G. Lipid distribution and transport across cellular membranes. Semin Cell Dev Biol. 2001;12:139–148. doi: 10.1006/scdb.2000.0231. [DOI] [PubMed] [Google Scholar]
- Razinkov VI, Melikyan GB, Epand RM, Epand RF, Cohen FS. Effects of spontaneous bilayer curvature on influenza virus-mediated fusion pores. J Gen Physiol. 1998;112:409–422. doi: 10.1085/jgp.112.4.409. [DOI] [PMC free article] [PubMed] [Google Scholar]
- Siegel DP. Energetics of intermediates in membrane fusion: comparison of stalk and inverted micellar intermediate mechanisms. Biophys J. 1993;65:2124–2140. doi: 10.1016/S0006-3495(93)81256-6. [DOI] [PMC free article] [PubMed] [Google Scholar]
- Siegel DP. Determining the ratio of the Gaussian curvature and bending elastic moduli of phospholipids from Q(II) phase unit cell dimensions. Biophys J. 2006;91:608–618. doi: 10.1529/biophysj.106.085225. [DOI] [PMC free article] [PubMed] [Google Scholar]
- Siegel DP. The Gaussian curvature elastic energy of intermediates in membrane fusion. Biophys J. 2008;95:5200–5215. doi: 10.1529/biophysj.108.140152. [DOI] [PMC free article] [PubMed] [Google Scholar]
- Siegel DP, Kozlov MM. The gaussian curvature elastic modulus of N-monomethylated dioleoylphosphatidylethanolamine: relevance to membrane fusion and lipid phase behavior. Biophys J. 2004;87:366–374. doi: 10.1529/biophysj.104.040782. [DOI] [PMC free article] [PubMed] [Google Scholar]
- Spruce AE, Breckenridge LJ, Lee AK, Almers W. Properties of the fusion pore that forms during exocytosis of a mast cell secretory granule. Neuron. 1990;4:643–654. doi: 10.1016/0896-6273(90)90192-i. [DOI] [PubMed] [Google Scholar]
- Spruce AE, Iwata A, Almers W. The first milliseconds of the pore formed by a fusogenic viral envelope protein during membrane fusion. Proc Natl Acad Sci USA. 1991;88:3623–3627. doi: 10.1073/pnas.88.9.3623. [DOI] [PMC free article] [PubMed] [Google Scholar]
- Zimmerberg J, Kozlov MM. How proteins produce cellular membrane curvature. Nat Rev Mol Cell Biol. 2006;7:9–19. doi: 10.1038/nrm1784. [DOI] [PubMed] [Google Scholar]
Associated Data
This section collects any data citations, data availability statements, or supplementary materials included in this article.