Abstract
The response of primary human endothelial (ECs) and vascular smooth muscle cells (VSMCs) to TiO2 nanotube arrays is studied through gene expression analysis. Microarrays revealed that nanotubes enhanced EC proliferation and motility, decreased VSMC proliferation, and decreased expression of molecules involved in inflammation and coagulation in both cell types. Networks generated from significantly affected genes suggest that cells may be sensing nanotopographical cues via pathways previously implicated in sensing shear stress.
Restenosis and thrombosis are two major complications associated with vascular prosthetics such as stents. Thrombosis is caused by the inadequate migration and proliferation of endothelial cells (ECs), which line the inside of blood vessels. Restenosis is caused by the proliferation of vascular smooth muscle cells (VSMCs), which surround the EC layer. Current strategies to manage these problems such as drug-eluting stents are largely focused on blunting VSMC proliferation. However, these therapies are associated with a higher risk of late thrombosis1 because drug-eluting coatings also inhibit EC function, migration, and proliferation, leading to poor re-endothelialization of the lumen.2,3 Because ECs not only prevent coagulation but also VSMC proliferation,4 rapid re-endothelialization and normal EC function is crucial to the success of any vascular implant. Thus, to minimize complications, an ideal stent should encourage EC migration, proliferation and function, while blunting VSMC proliferation.5
Recent studies suggest that titanium dioxide (TiO2) nanotube arrays may be a promising candidate for a “pro-healing” coating for vascular implants, such as stents, vascular grafts, or other prostheses. Titanium, widely used in hip and dental implants, owes its biocompatibility to the thin layer of TiO2 that spontaneously forms at its surface. Through a simple electrochemical process,6 highly ordered, vertically oriented TiO2 nanotubes can be grown from a Ti surface with diameters that range from 22 – 300 nm and lengths of up to 1 mm.7–10 This precise control over nanotopographical dimensions allows for the fabrication of materials with feature sizes on the same order of magnitude as cell receptors or proteins and thus the ability to manipulate cell behavior through mechanical and topographical means.11 Previous studies have shown that these surfaces elicit low levels of monocyte activation and cytokine secretion,12 and improve osteoblast attachment, function, and proliferation.13 Studies with vascular cells suggest that the nanotubes may enhance EC motility,14 proliferation, and function, while decreasing VSMC proliferation.15 Thus, TiO2 nanotubes represent a highly biocompatible material with not only precisely tunable dimensions, but also possible bioactive properties that may reduce both thrombotic and restenotic risk.
To further investigate the effects of nanotube arrays on vascular cells, microarray studies were performed to identify differentially expressed genes that may be responsible for the observed phenotypes. Given the dual role ECs play in preventing both coagulation and VSMC proliferation, the effect of nanotopography on EC gene expression was first examined. Previous studies have suggested that cells may be sensitive to nanotube dimensions, and that certain tube diameters may enhance survival, proliferation, differentiation, or migration.14, 16–18 To explore the effect of nanotube diameter on ECs, primary human aortic endothelial cells (HAECs) were grown on smooth surfaces as well as 30 nm and 100 nm nanotube arrays. mRNA transcripts from the cells were harvested after 24 hours and expression levels were probed using whole-genome microarrays. Analysis of the arrays revealed no significant differences between ECs exposed to the 30 nm and 100 nm nanotube arrays, but significant differences in over 100 transcripts between nanotube arrays and flat surfaces. The lack of significant differences between cells exposed to the 30 and 100 nm arrays in this experiment may be due to the differences in cell types or origin that were used in this study versus previous studies (e.g. bovine aortic ECs14 and mesenchymal cells19 vs. primary HAECs) as well as variation in the duration of exposure to the nanotube array surfaces before a cellular response was measured. It is also feasible that cells may be responding to different nanotopographical dimensions via protein or enzymatic control rather than transcriptional regulation. However, our data does suggest that primary HAECs are not responsive (at least not transcriptionally) to variation in nanotube diameters in the 30–100 nm range after 24 hours of exposure.
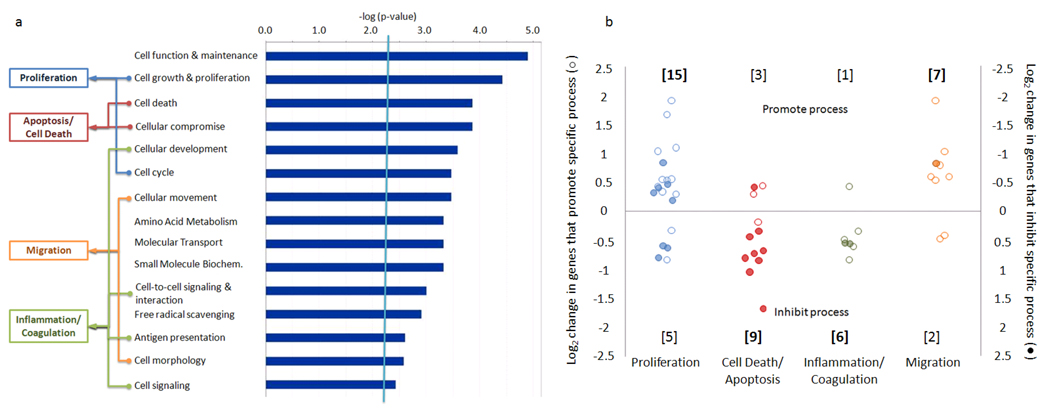
Genes with significant differences in expression between the nanotubular and flat substrates were analyzed using Ingenuity Pathway Analysis (IPA) software to identify altered cellular processes and functions due to exposure to nanotubes. From the data, IPA identified over 50 genes with sufficient published information to sort into various functional categories. These categories were further classified according to their likely impact on processes relevant to performance of a vascular implant (Figure 1A). Sorting resulted in four major groups of genes whose changes in expression levels would likely indicate an alteration in proliferation, migration, cell death, and inflammation or coagulation (i.e EC activation, which results in recruitment of leukocytes or platelets, or progression of the inflammatory response or coagulation cascade). The genes were then further classified by whether their expression would likely promote or inhibit the relevant processes (i.e. proliferation, migration, cell death, and inflammation) using IPA’s curated findings and plotted in Figure 1B (see supplemental section, Table S1 for additional information). Log2-fold changes in expression of genes that promote a process were plotted according to the y-axis on the left such that an upregulation of a gene in this category would appear on the top half of the graph. Genes that inhibit that same process were plotted according to y-axis on the right such that downregulation of a gene that retards a process would also appear on the top half of the plot. Organized this way, genes that appear on the top half of the plot would likely promote one of the processes while genes that appear on the bottom half of the plot would contribute to the inhibition of the process. The expression patterns of the genes suggest that ECs exposed to nanotubes are more proliferative, with 15 genes whose expression patterns that were more consistent with a proliferative phenotype and 5 more consistent with a non-proliferative phenotype. The cells also appear to be more motile (7 genes that promote the process versus 2 that inhibit). Further, ECs on nanotube arrays also seemed more resistant to cell death (3 promote versus 9 inhibit) and activation (1 promote versus 6 inhibit).
Figure 1.
Nanotube effects on cellular functions and processes of ECs. List of significantly affected cellular functions identified by Ingenuity Pathway Analysis with p<0.005 (A). Identified functions are sorted into processes relevant to vascular device performance. Genes whose expression is significantly affected by nanotube arrays are plotted according to their likely effects on the four processes (B). Genes that promote a process are represented by open circles (○) with their y-axis on the left, while genes that inhibit a process are represented by filled-in circles (●) and have their y-axis on the right. Plotted this way, genes whose expression pattern is likely to promote a specific process (e.g. enhanced expression of a promoter of proliferation or reduced expression of a gene that inhibits proliferation) will appear on the top half of the graph, and those who would likely inhibit the process would appear on the bottom. Numbers at the top and bottom denote the number of genes that appear on the top or bottom region of the graph. For example, there are 15 EC genes whose expression pattern is consistent with a proliferative phenotype.
This data is consistent with previous reports about the ability of nanotubes to promote endothelial cell proliferation and migration. Our group has observed increased DNA synthesis in ECs exposed to nanotube arrays as compared to flat surfaces.15 The pro-migratory effects of the nanotubes have also been shown through analysis of cell morphology, focal adhesion staining, and scratch migration assays.14, 15 Microarray analysis from this study not only supports previous functional data but also provides possible gene candidates that are involved in these responses.
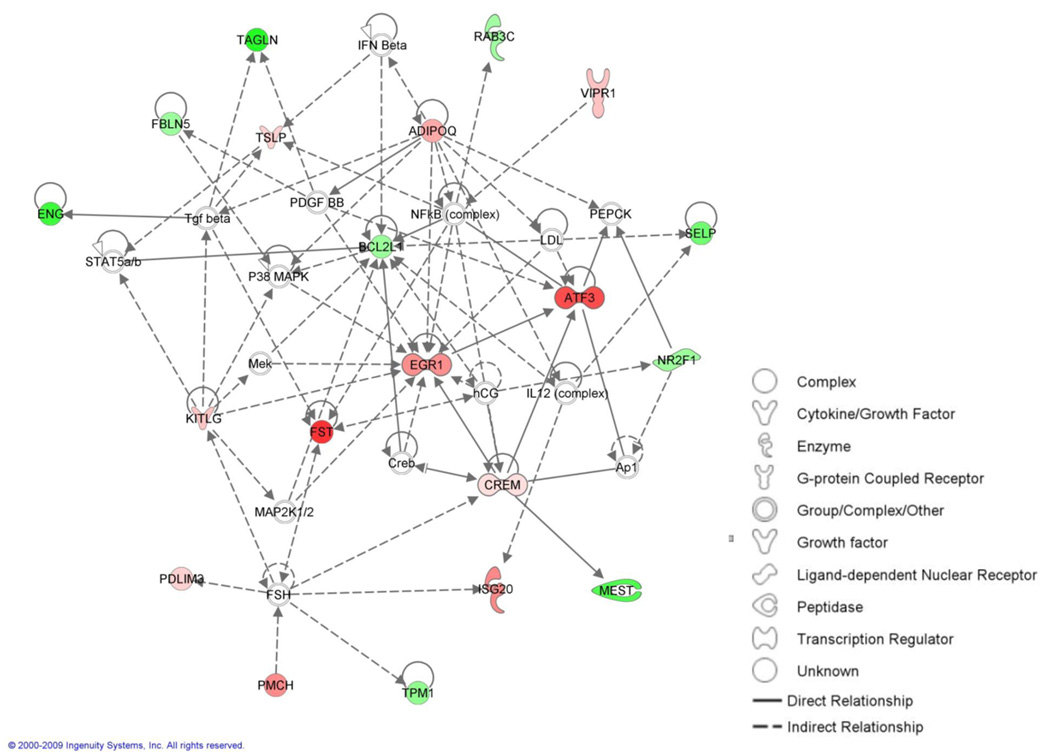
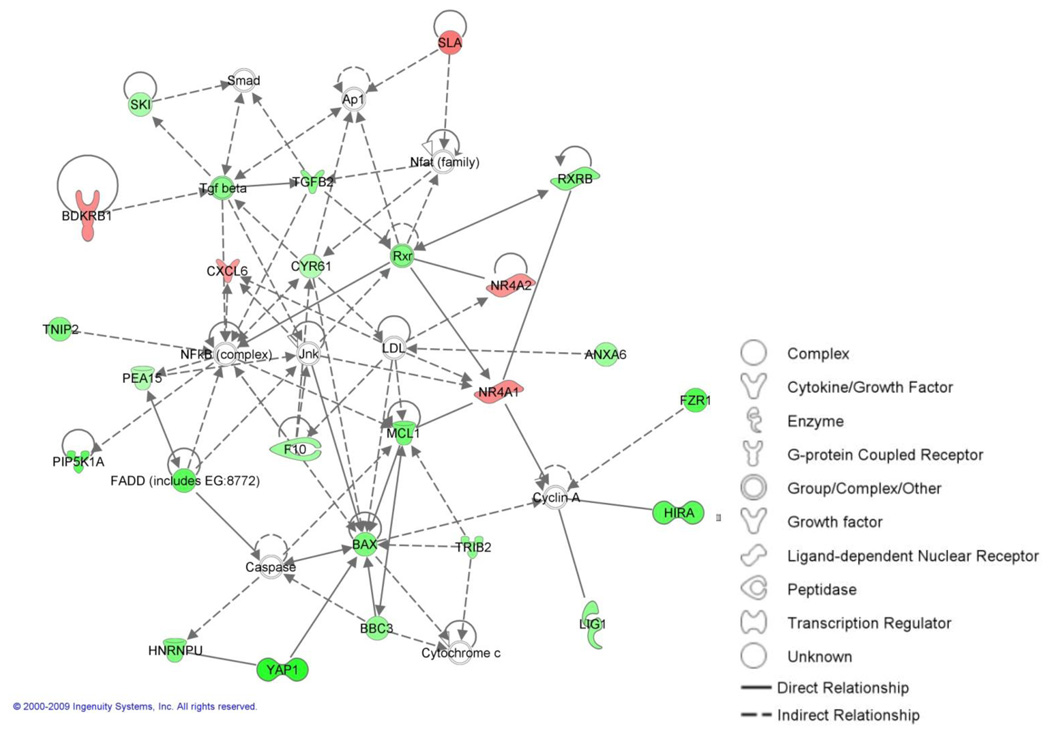
While the pro- proliferative and migratory effects of the nanotubes revealed through microarray analysis are consistent with prior reports, the anti- cell death and activation aspects of the nanotopography are novel findings. In fact, previous studies suggest that increased surface roughness in stainless steel surfaces may increase activation of ECs, increasing expression of cell adhesion molecules such as E-selectin and VCAM-1.20 However, despite the increased roughness of nanotube arrays in comparison to flat surfaces, our microarray analysis revealed no significant changes those particular molecules and decreases in other markers of activation. The discrepancy in EC activation in these studies may stem from the difference in chemical composition, order of the substrates, or a combination of both. TiO2 is a highly inert material but stainless steel is an alloy with some elements, such as nickel,21 that are more immunogenic. Increased roughness likely increases the surface area of the substrate in contact with cells. Cells on a slightly more immunogenic surface, like stainless steel, would see a higher amount of inflammatory stimuli on a roughened surface, whereas cells on an inert surface such as TiO2 would not. Furthermore, stainless steel substrates used in previous experiments had a random topography, whereas nanotube arrays used in these experiments were highly ordered. In addition to the changes in these processes, the microarrays also identified molecular networks that are most likely altered by the nanotubes as well as probable genes that are correlated with the differences in phenotype. The top network identified by IPA (Figure 2) contained members such as nuclear factor-kappa β (NF-κB), activator protein-1 (AP-1), mitogen-activated protein kinases (MAPKs), which have previously been implicated in mechanotransduction22 and sensing of shear stress in endothelial cells.23 The appearance of these genes in this network suggest that ECs may be sensing nanotopographic cues through proteins upstream of these signaling molecules, such as integrins, mechanosensitive ion channels, cell surface proteoglycans, or other shear-sensitive elements. NF-κB, for example, has been shown to be activated via Rac1 in response to integrin activation.24 AP-1 is another transcription factor that been implicated in integrin-mediated responses to mechanical cues via ERK1/2 phosphorylation.25 Detailed examination of genes most profoundly affected by nanotopography reviewed that transcripts for follistatin (FST), a gene expressed in migrating and proliferating ECs,26 experienced the greatest absolute log2 fold change in expression. ECs exposed to nanotubes produced nearly 4 times more FST (log2 fold change = +1.91) than cells on flat controls. This change in follistatin expression was also confirmed by quantitative PCR (qPCR), which yielded expression levels consistent with that of the microarrays, with a log2 fold change of +2.48 ± 0.46 relative to flat controls. In ECs, follistatin, an activin-binding autocrine/paracrine protein, regulates proliferation by inhibiting the anti-proliferatory effects of activin.27, 28 While there have been studies about the how EC FST expression is regulated via chemical cues, such as with heparin,29–31 little is known about how the gene can be regulated by mechanical cues. However, in our study, follistatin serves as a marker for EC proliferation and migration, and its expression pattern, as well as those of other genes (see Table S1), supports the upregulation of these two processes in ECs exposed to nanotopographical cues.
Figure 2.
Top network of genes in ECs whose expression are significantly affected by exposure to nanotube arrays. Red indicates upregulation, green indicates downregulation. Intensity of color is proportional to magnitude of change. For the sake of simplicity, relationships between genes without a significant change in expression are not shown. See original network map in supplemental section, Figure S2.
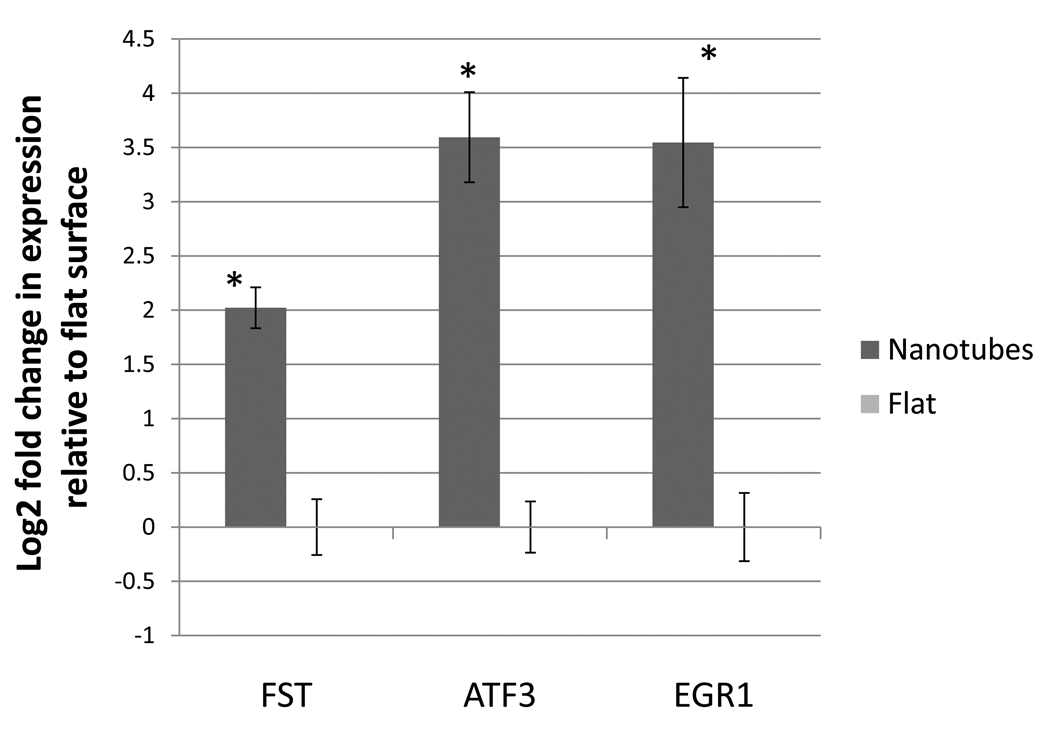
Initially after a vascular device like a stent is implanted, the EC layer is denuded and the implant surface is either bare or sparsely covered with ECs. To see if similar expression patterns might also be observed in this initial stage, ECs were seeded on nanotube and flat substrates at low densities. After 24 hours, expression of several genes identified by microarray analysis was measured by qPCR. In addition to FST, activating transcription factor 3 (ATF3) was chosen because it had the next largest absolute log2 fold change, is expressed in proliferating cells,32 and plays a role in promoting cell survival.33 Early growth response 1 (EGR1) expression was also examined because of its established role as a transcription factor in mechanotransduction and extracellular matrix sensing.34 Quantitative PCR results indicated that ECs grown at low densities also showed increased expression of FST, ATF3, and EGR1. While increase in expression of FST remained at about 4 fold (+2.03 ± 0.18 log2 fold change), the expression levels of ATF3 and EGR1 increased dramatically (+3.63 ± 0.35 and +3.62 ± 0.44 log2 fold change, respectively) at even higher levels than shown on the microarrays (Figure 3). This data suggests that during the initial stages post implantation, nanotube surface would have an even more profound effect than predicted by microarray.
Figure 3.
Average expression levels of follistatin (FST), activating transcription factor 3 (ATF3), and early growth response 1 (EGR1) in ECs grown at low densities measured by quantitative PCR. Data is normalized by expression levels of each gene by ECs on flat surfaces and presented as average ± standard deviation. * p<0.05 when compared to flat controls, n=3.
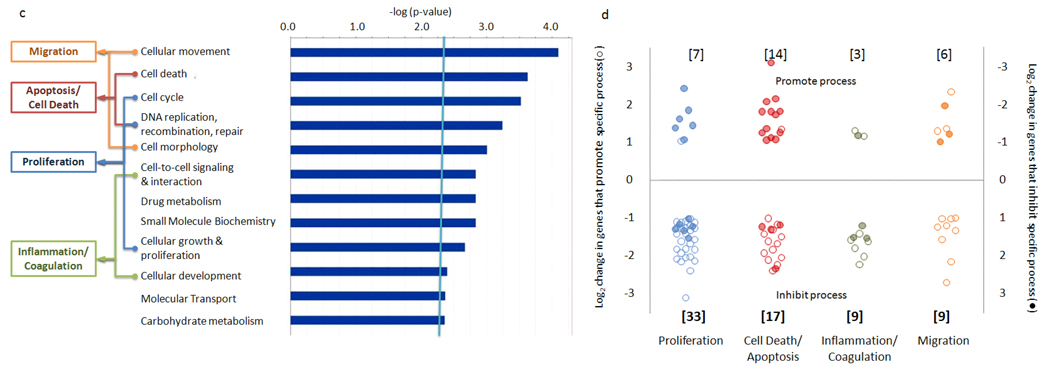
In addition to ECs, most vascular implants will interact with VSMCs. Uncontrolled proliferation of these cells after implantation often results in complications such as restenosis or device failure. Therefore, it is crucial to have a detailed understanding of how VSMCs interact with any possible vascular device coating. Thus, in addition to studying EC behavior, we also examined VSMC response to nanotube arrays. Because nanotubes of 30 nm and 100 nm in diameter did not seem to elicit a significant difference in EC behavior, only the 30 nm arrays were used to investigate VSMC behavior. VSMCs were seeded onto 30 nm nanotube arrays and flat surfaces for 24 hours. Like ECs, VSMCs were then harvested after 24 hours and gene expression of the entire genome was probed using microarrays. Top hits were filtered by p-value and absolute log2 fold change values to generate a shortlist of over 170 genes. The most significantly changed cellular functions were identified using IPA. Significantly affected functions were further grouped into categories relevant to the performance of vascular devices, which yielded the same four processes as ECs: proliferation, cell death, inflammation, and migration (Figure 4A). Genes were then sorted according to whether they were likely to up- or down-regulate these four processes and plotted in the same manner as ECs such that genes whose expression patterns would like promote a process would appear as data points on the top half of the graph, while those that would likely inhibit the process would appear on the bottom half (Figure 4B). In contrast to ECs, genes significantly changed in VSMCs were not the same genes differentially expressed in ECs. In fact, plot of the log2 fold change of all genes for ECs versus VSMCs suggest that TiO2 nanotubes have divergent effects on the two cell population (Figure S1). Moreover, expression patterns in VSMCs in contact with the nanotube arrays strongly suggest a less proliferative (7 promote versus 33 inhibit) phenotype. While the number of genes whose expression would likely inhibit versus promote cell death (14 promote versus 17 inhibit) and migration (6 promote versus 9 inhibit) are less striking, the expression pattern of genes involved in inflammation or coagulation seem to indicate a less activated phenotype (3 promote versus 9 inhibit).
Figure 4.
Nanotube effects on cellular functions and processes of VSMCs. (A) List of significantly affected cellular functions identified by Ingenuity Pathway Analysis with p<0.005. Identified functions are sorted into processes relevant to vascular device performance. Genes whose expression is significantly affected by nanotube arrays are plotted according to their likely effects on the four processes (B), see figure 1 for more detailed explanation. Numbers at the top and bottom denote the number of genes that appear on the top or bottom region of the graph. For example, there are 33 genes whose expression patterns is consistent with a less proliferative phenotype.
Analysis of microarray data also yielded top networks and a set of genes most significantly affected by the nanotopography. Some members of the top network, such as NF-κB and AP-1 overlapped with the results from the top EC network (Figure 5) suggesting that similar signaling pathways may be involved in EC and VSMC sensing of the nano-environment. However, differential modulation of these pathways may lead to differential regulation of key transcription factors, resulting in divergent responses to the same substrate. The greatest absolute log2 fold change in expression was in YAP1, or Yes-associated protein 1, a gene that has been associated with increased proliferation and decreased apoptosis.35 YAP1 expression was confirmed by qPCR, which showed a decrease in gene expression, but to a lesser degree than the level demonstrated by microarray (log2 fold change= −0.96 ± 0.33). Surprisingly, the expression of smooth muscle α-actin (SMαA), a marker of differentiation previously shown to be downregulated in mouse VSMCs exposed to nanotubes,15 did not see a significant change in expression in this study. This may be due to the different cell origin and type used in the two studies. Previous data was collected with an immortalized mouse cell line, which can behave quite differently from primary human cells. Notably, the growth rate of the mouse cell line was much higher so it is possible that differences in SMαA expression had not yet occurred when the human cells were harvested for microarray. Nevertheless, data from this study strongly supports the idea that nanotube arrays have an anti-proliferatory effect on VSMCs, an effect crucial to inhibiting restenosis in an ideal stent or vascular device.
Figure 5.
Top network of genes in VSMCs whose expression are significantly affected by exposure to nanotube arrays. Red indicates upregulation, green indicates downregulation. Intensity of color is proportional to magnitude of change. For the sake of simplicity, relationships between genes without a significant change in expression are not shown. See original network map in supplemental section, Figure S3.
Existing strategies of reducing vascular device complications are largely aimed at preventing restenosis at the expense of reendothelialization. The ideal vascular implant, however, should prevent VSMC proliferation and encourage EC proliferation, migration, and quiescence. Data from this and previous studies suggest that TiO2 nanotube arrays may be a promising candidate for a next-generation stent or vascular device coating as because of the divergent response of ECs and VSMCs to the material. In addition, this study also identified genes and possible pathways that are correlated with changes in EC and VSMC phenotype. Identifying the genes and networks associated with phenotype changes in response to nanotopographical cues maybe a crucial step toward understanding how cells sense and respond to nanotopography and how these interactions can be used to improve medical device design.
Supplementary Material
Acknowledgements
Funding for this work was provided by Sandler Asthma Basic Research (SABRE) Center Functional Genomics Core Facility and NIH/NCRR UCSF-CTSI Grant Number UL1 RR024131 and the National Science Foundation (NSEC). Microarrays were performed at the UCSF Shared Microarray Core Facility. We thank the Papa lab for assistance with qPCR.
REFERENCES
- 1.Shuchman M. N Engl J Med. 2006;355(19):1949–1952. doi: 10.1056/NEJMp068234. [DOI] [PubMed] [Google Scholar]
- 2.Steffel J, Tanner FC. Herz. 2007;32(4):268–273. doi: 10.1007/s00059-007-3000-5. [DOI] [PubMed] [Google Scholar]
- 3.Finn AV, Joner M, Nakazawa G, Kolodgie F, Newell J, John MC, Gold HK, Virmani R. Circulation. 2007;115(18):2435–2441. doi: 10.1161/CIRCULATIONAHA.107.693739. [DOI] [PubMed] [Google Scholar]
- 4.Rzucidlo EM, Martin KA, Powell RJ. J Vasc Surg. 2007;45 Suppl A:A25–A32. doi: 10.1016/j.jvs.2007.03.001. [DOI] [PubMed] [Google Scholar]
- 5.Ako J, Bonneau HN, Honda Y, Fitzgerald PJ. American Journal of Cardiology. 2007;100(8B):3M–9M. doi: 10.1016/j.amjcard.2007.08.016. [DOI] [PubMed] [Google Scholar]
- 6.Mor G, Varghese O, Paulose M, Shankar K, Grimes C. Sol Energ Mat Sol C. 2006;90(14):2011–2075. [Google Scholar]
- 7.Paulose M, Prakasam H, Varghese O, Peng L, Popat K, Mor G, Desai T, Grimes C. J Phys Chem C. 2007;111(41):14992–14997. [Google Scholar]
- 8.Prakasam HE, Shankar K, Paulose M, Varghese OK, Grimes CA. J Phys Chem C. 2007;111(20):7235–7241. [Google Scholar]
- 9.Shankar K, Basham JI, Allam NK, Varghese OK, Mor GK, Feng XJ, Paulose M, Seabold JA, Choi KS, Grimes CA. J Phys Chem C. 2009;113(16):6327–6359. [Google Scholar]
- 10.Grimes C. Tio2 nanotube arrays. New York: Springer; 2009. [Google Scholar]
- 11.Leduc PR, Robinson DN. Advanced Materials. 2007;19(22):3761–3770. [Google Scholar]
- 12.Ainslie KMTSL, Popat KC, Desai TA. J Biomed Mater Res A. 2008 [Google Scholar]
- 13.Popat K, Leoni L, Grimes C, Desai T. Biomaterials. 2007;28(21):3188–3197. doi: 10.1016/j.biomaterials.2007.03.020. [DOI] [PubMed] [Google Scholar]
- 14.Brammer KS, Oh S, Gallagher JO, Jin S. Nano Lett. 2008;8(3):786–793. doi: 10.1021/nl072572o. [DOI] [PubMed] [Google Scholar]
- 15.Peng L, Eltgroth ML, LaTempa TJ, Grimes CA, Desai TA. Biomaterials. 2009;30(7):1268–1272. doi: 10.1016/j.biomaterials.2008.11.012. [DOI] [PubMed] [Google Scholar]
- 16.Oh S, Brammer KS, Li YSJ, Teng D, Engler AJ, Chien S, Jin S. Proceedings of the National Academy of Sciences of the United States of America. 2009;106(7):2130–2135. doi: 10.1073/pnas.0813200106. [DOI] [PMC free article] [PubMed] [Google Scholar]
- 17.Park J, Bauer S, Schlegel KA, Neukam FW, von der Mark K, Schmuki P. Small. 2009;5(6):666–671. doi: 10.1002/smll.200801476. [DOI] [PubMed] [Google Scholar]
- 18.Park J, Bauer S, Schmuki P, von der Mark K. Nano Lett. 2009 doi: 10.1021/nl9013502. [DOI] [PubMed] [Google Scholar]
- 19.Park J, Bauer S, von der Mark K, Schmuki P. Nano Letters. 2007;7(6):1686–1691. doi: 10.1021/nl070678d. [DOI] [PubMed] [Google Scholar]
- 20.McLucas E, Moran MT, Rochev Y, Carroll WM, Smith TJ. Endothelium-Journal of Endothelial Cell Research. 2006;13(1):35–41. doi: 10.1080/10623320600660185. [DOI] [PubMed] [Google Scholar]
- 21.Koster R, Vieluf D, Kiehn M, Sommerauer M, Kahler J, Baldus S, Meinertz T, Hamm CW. Lancet. 2000;356(9245):1895–1897. doi: 10.1016/S0140-6736(00)03262-1. [DOI] [PubMed] [Google Scholar]
- 22.Jaalouk DE, Lammerding J. Nature Reviews Molecular Cell Biology. 2009;10(1):63–73. doi: 10.1038/nrm2597. [DOI] [PMC free article] [PubMed] [Google Scholar]
- 23.Chatzizisis YS, Coskun AU, Jonas M, Edelman ER, Feldman CL, Stone PH. Journal of the American College of Cardiology. 2007;49(25):2379–2393. doi: 10.1016/j.jacc.2007.02.059. [DOI] [PubMed] [Google Scholar]
- 24.Tzima E, Del Pozo MA, Kiosses WB, Mohamed SA, Li S, Chien S, Schwartz MA. Embo Journal. 2002;21(24):6791–6800. doi: 10.1093/emboj/cdf688. [DOI] [PMC free article] [PubMed] [Google Scholar]
- 25.Iqbal J, Zaidi M. Biochemical and Biophysical Research Communications. 2005;328(3):751–755. doi: 10.1016/j.bbrc.2004.12.087. [DOI] [PubMed] [Google Scholar]
- 26.Kozian DH, Ziche M, Augustin HG. Lab Invest. 1997;76(2):267–276. [PubMed] [Google Scholar]
- 27.Phillips DJ. Domestic Animal Endocrinology. 2005;28(1):1–16. doi: 10.1016/j.domaniend.2004.05.006. [DOI] [PubMed] [Google Scholar]
- 28.Mccarthy SA, Bicknell R. Journal of Biological Chemistry. 1993;268(31):23066–23071. [PubMed] [Google Scholar]
- 29.Klein R, Robertson DM, Clarke IJ. Reproduction Fertility and Development. 1996;8(2):273–277. doi: 10.1071/rd9960273. [DOI] [PubMed] [Google Scholar]
- 30.Phillips DJ, Jones KL, McGaw DJ, Groome NP, Smolich JJ, Parsson H, de Kretser DM. Journal of Clinical Endocrinology & Metabolism. 2000;85(7):2411–2415. doi: 10.1210/jcem.85.7.6666. [DOI] [PubMed] [Google Scholar]
- 31.Jones KL, de Kretser DM, Phillips DJ. Journal of Endocrinology. 2004;181(2):307–314. doi: 10.1677/joe.0.1810307. [DOI] [PubMed] [Google Scholar]
- 32.Perez S, Vial E, van Dam H, Castellazzi M. Oncogene. 2001;20(9):1135–1141. doi: 10.1038/sj.onc.1204200. [DOI] [PubMed] [Google Scholar]
- 33.Kawauchi J, Zhang C, Nobori K, Hashimoto Y, Adachi MT, Noda A, Sunamori M, Kitajima S. Journal of Biological Chemistry. 2002;277(41):39025–39034. doi: 10.1074/jbc.M202974200. [DOI] [PubMed] [Google Scholar]
- 34.Chiquet M, Gelman L, Lutz R, Maier S. Biochimica Et Biophysica Acta-Molecular Cell Research. 2009;1793(5):911–920. doi: 10.1016/j.bbamcr.2009.01.012. [DOI] [PubMed] [Google Scholar]
- 35.Overholtzer M, Zhang J, Smolen GA, Muir B, Li W, Sgroi DC, Deng CX, Brugge JS, Haber DA. Proceedings of the National Academy of Sciences of the United States of America. 2006;103(33):12405–12410. doi: 10.1073/pnas.0605579103. [DOI] [PMC free article] [PubMed] [Google Scholar]
Associated Data
This section collects any data citations, data availability statements, or supplementary materials included in this article.


