Abstract
gonzo (goz) is a zebrafish mutant with defects in cartilage formation. The goz phenotype comprises cartilage matrix defects and irregular chondrocyte morphology. Expression of endoderm, mesoderm, and cartilage marker genes is, however, normal, indicating a defect in chondrocyte morphogenesis. The mutated gene responsible for the goz phenotype, identified by positional cloning and confirmed by phosphomorpholino knockdown, encodes zebrafish site-1 protease (s1p). S1P has been shown to process and activate sterol regulatory element-binding proteins (SREBPs), which regulate expression of key enzymes of lipid biosynthesis or transport. This finding is consistent with the abnormal distribution of lipids in goz embryos. Knockdown of site-2 protease, which is also involved in activation of SREBPs, results in similar lipid and cartilage phenotypes as S1P knockdown. However, knockdown of SREBP cleavage-activating protein, which forms a complex with SREBP and is essential for S1P cleavage, results only in lipid phenotypes, whereas cartilage appears normal. This indicates that the cartilage phenoptypes of goz are caused independently of the lipid defects.
The vertebrate skeleton is comprised of cartilage and bone and is derived from multiple embryologic origins, including neural crest, dorsal paraxial mesoderm, cephalic mesoderm, and lateral mesoderm (for review, see ref. 1). Skeletal development in the vertebrate head is regulated by sonic hedgehog (Shh) (2–5), which is expressed in the rostral axial mesendoderm and the prechordal plate (6). The coexpression of shh and bone morphogenetic proteins (bmps) observed in many developing vertebrate organs suggests a closely regulated relationship between Shh and BMPs (7). It has been shown that BMP-4 induces sox9 and collagen II (Col II) expression and leads to chondrogenesis in mandibular organ culture systems of chick and mouse (8).
Mature cartilage consists of chondrocytes and the surrounding extracellular matrix. Matrix collagens and proteoglycans are synthesized by chondrocytes. They are hydroxylated, glycosylated, and proteolytically cleaved in the secretory pathway and further processed and assembled into cartilage matrix at the cell surface (9). Large complexes of proteoglycans are restricted in their mobility and swelling by a network of Col II and XI fibrils of high tensile strength. Interactions between the extracellular matrix and chondrocytes have been shown to be essential for cartilage development (10), and mutations in collagen genes can cause human chondrodysplasias (11, 12).
In addition to protein factors, lipids play an essential role in cartilage development. Deficiencies in cholesterol metabolism during embryogenesis can lead to severe skeletal abnormalities like Smith–Lemli–Opitz syndrome (for review, see ref. 13 and references therein). Similar chondrodysplasias have been observed in other vertebrates, including zebrafish (14, 15), in which the molecular mechanisms of skeletal development are conserved, including the roles of shh (16), patched (ptc) (17), bmp-4 (18), or sox9 (15).
In this study we describe the genetic and molecular characterization of the zebrafish mutant gonzo (goz), which displays phenotypes similar to human chondrodysplasias. We show that goz is a cartilage mutant with defects in chondrocyte morphogenesis, caused by mutations in the gene encoding site-1 protease (s1p). goz mutant displays lipid deficiencies, as predicted from the known role of S1P in processing of sterol regulatory element binding-proteins (SREBPs) (19). Knockdown of SREBP cleavage-activating protein (SCAP) (20), which is required for processing of SREBPs, indicates that lipid and cartilage defects observed in S1P mutants can be separated and are caused by different mechanisms.
Materials and Methods
Fish. General handling of zebrafish was carried out as described (21). Stages are given in hours post fertilization (hpf) at 28.5°C (22).
Whole-Mount Skeletal Stainings. Alcian blue staining was done as described (23) by staining for 3 h in 0.015% alcian blue in 80% ethanol/20% glacial acetic acid before bleaching in 0.8% KOH/0.9% H2O2/0.2% Triton X-100. After neutralization in saturated sodium tetraborate solution, tissue was softened in 0.2 mg/ml trypsin in 60% sodium tetraborate/0.2% Triton X-100, and cleared in 18% glycerol/0.8% KOH/0.2% Triton X-100.
Lectin Staining. Five-day-old larvae were fixed in 4% paraformaldehyde in PBS for 30 min, rinsed with PBS/0.2% Tween 20 (PBSTw), digested in 60 μg/ml proteinase K in PBSTw, followed by incubations in saturated sodium tetraborate solution, PBSTw, and lectin blocking buffer (1% BSA/2 mM CaCl2/2 mM MgCl2 in PBSTw). Biotinylated succinylated wheat germ agglutinin (WGA, Vector Laboratories) was added to 20 μg/ml in lectin blocking buffer, and larvae were incubated overnight at 4°C (U. Langheinrich, personal communication) and stained by using an avidin/biotinylated peroxidase system (Vectastain ABC, Vector Laboratories).
Antibody Staining. Antibody staining was carried out according to published protocols (24) using 0.1% trypsin and 0.5% hyaluronidase. Anti-Col II (Polyscience catalog no. 23707) was used as primary, anti-rabbit IgG biotin conjugate (Sigma catalog no. B8895) was used as secondary antibody.
Oil Red O Staining. Larvae were fixed in 4% paraformaldehyde in PBS overnight at 4°C before incubation in 60% 2-propanol, followed by oil red O staining in freshly filtered 0.3% oil red O in 60% 2-propanol (U. Langheinrich, personal communication).
Whole-Mount in Situ Hybridization. Whole-mount RNA in situ hybridization was performed as described (24).
Heterochronic Transplantations. Ten to 15 cells were transplanted from dye-labeled donor embryos to unlabeled hosts during the blastula period as described (25). Transplanted animals were fixed for antibody staining at 30 and 48 hpf.
Positional Cloning of goz Locus. Bulk segregant analysis using 288 simple sequence-length polymorphism markers was used to map goz near the center of linkage group 18. Fine mapping was performed on mutant larvae by using the proximal marker z7142, the nonrecombinant marker z24123, and the distal marker z9194 (26). SSLP markers were analyzed on a 96 capillary sequencer (MegaBACE 1000, Amersham Biosciences).
Genomic bacterial artificial chromosomes (BACs) were identified in various libraries (Incyte Genomics, Palo Alto, CA; DanioKey BAC Library no. 735; RZPD, Berlin) and were used for generation of single nucleotide polymorphism markers KS03 and KS04 and simple sequence-length polymorphism marker KSCA1.
Sequencing of Alleles. Progeny of heterozygous carriers of goztr6721 and goztr6722 were sorted alive according to their “hammerhead” phenotype at 5 days post fertilization (dpf). The complete s1p cDNA was amplified by using Herculase Enhanced DNA Polymerase (Stratagene) and sequenced directly.
Antisense Phosphomorpholino Oligonucleotide Injections. Antisense phosphomorpholino oligonucleotides (PMOs) used were s1p1, 5′-CAAGCACAGCCTTACGATCATG-3′ (positions –1 bp to 21 bp on cDNA); s2p1, 5′-GCTATGGGGATCATGGCACACC-3′ (position –8); SCAP1, 5′-CCTTTTATCTTACCCAATCCGG-3′ (intron 2 splice donor junction). Controls included injection of several mismatch PMOs or injection buffer only as well as analysis of a second, independent PMO against each gene: s1p2, 5′-GAACTATTCCCAAGCTAATGGC-3′ (position –401); s2p2, 5′-GTTGAGATCCGCCTACCCGCAG-3′ (intron 1 splice donor junction); and SCAP2, 5′-CCCGATACTGCAAGAAGATTAAC-3′ (intron 2 splice acceptor junction). PMOs were obtained from AVI Biopharma (Corvallis, OR), dissolved in injection buffer (0.4 mM MgSO4/0.6 mM CaCl2/0.7 mM KCl/58 mM NaCl/25 mM Hepes, pH 7.6), and injected at the one- to four-cell stage. At least three different amounts of PMOs between 1.5 and 24 ng were injected for each PMO. Penetrance of PMO-induced phenotypes was 60–91%.
Results
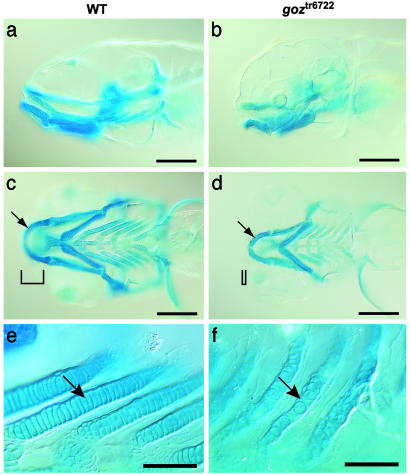
Identification and Genetic Characterization of goz. In cartilage of zebrafish larvae at 5 dpf, chondrocytes are arranged in a one-cell-wide row, like a stack of coins, along the developing skeletal structures (Fig. 1 a, c, and e). Cartilage matrix is present in a thin layer around each chondrocyte and between the chondrocytes and the overlying perichondrium. Zebrafish hammerhead mutants, which show altered chondrocyte morphology indicating a general defect in cartilage differentiation, have been identified in a large-scale genetic screen (23, 27). We identified the mutant goz when it segregated independently from the ty118a or tx224 hammerhead mutant strains (23) on outcrossing. goz shows slightly reduced alcian blue staining at 5 dpf. All of the skeletal elements in goz homozygotes are present but consist of smaller chondrocytes that fail to align in the typical single cell rows seen in wild-type embryos (Fig. 1 b, d, and f). This reduced alcian blue staining in goz homozygotes indicates an altered composition of the cartilage matrix.
Fig. 1.
Cartilage defects in goz. Alcian blue staining of sibling larvae (a, c, and e) and goz larvae (b, d, and f) at 5 dpf is shown. (a and b) Lateral view. (c and d) Ventral view of the head. (e and f) Enlargement of the branchial arches. Cartilage matrix staining is slightly reduced in goz mutants. All cartilage elements, including Meckel's cartilage (arrows in c and d), are smaller in the mutant. Tissue anterior to the eyes is missing (bars in c and d). The columnar arrangement of chondrocytes in the branchial arches is disrupted in goz mutants (arrows in e and f). (Scale bars are 200 μmin a–d and 50 μmin e and f.)
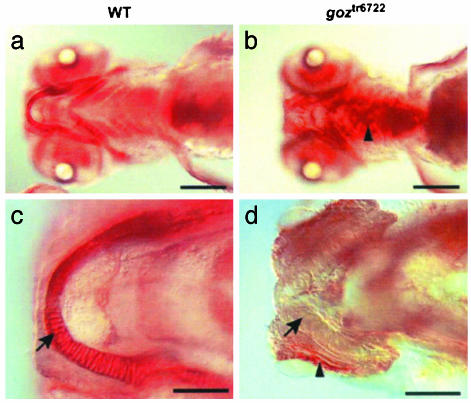
Because proteoglycans are important components of cartilage matrix, we stained cartilage proteoglycan in larvae at 5 dpf with the lectin wheat germ agglutinin (WGA). In contrast to the homogeneous distribution in wild-type embryos (Fig. 2 a and c), proteoglycans are absent in the extracellular matrix of goz cartilage and appear to accumulate ectopically next to cartilage elements (Fig. 2 b and d).
Fig. 2.
Proteoglycan phenotypes in goz. Wheat germ agglutinin staining of matrix proteoglycans in wild-type (WT) sibling larvae (a and c) and goz larvae (b and d) at 5 dpf. (a and b) Ventral view. (c and d) Enlargement of Meckel's cartilage. Proteoglycans are homogeneously stained in the cartilage matrix of sibling larvae (a and c). This staining is absent in the cartilage matrix of goz (arrow in d) where proteoglycans seem to accumulate ectopically (arrowheads in b and d). (Scale bars are 200 μm in a and b and 50 μm in c and d.)
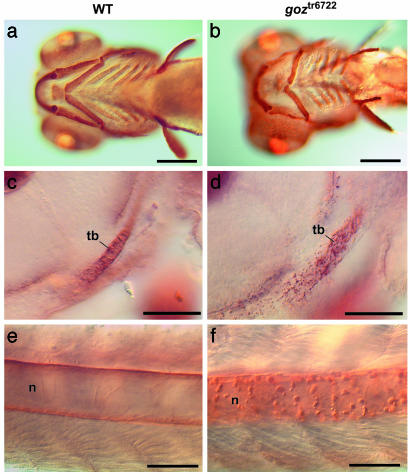
The cartilage matrix protein Col II is distributed homogeneously around the chondrocytes, the otic vesicle and the notochord of wild-type embryos (Fig. 3 a, c, and e). In goz mutant embryos, Col II protein forms abnormal aggregates that are located in the cartilage matrix of all cartilage elements, around the otic vesicle and the notochord (Fig. 3 b and f). The first Col II aggregates in goz can be detected at 48 hpf, when the trabeculae of the neurocranium are developing from a few adjacent chondrocytes (Fig. 3d).
Fig. 3.
Col II defects in goz. Immunohistological staining of Col II in wild-type (WT) sibling larvae (a, c, and e) and goz larvae (b, d, and f) is shown. (a and b) Ventral view of the head 5 dpf. (c and d) Enlargement of the trabeculae (tb) of the neurocranium (lateral view) at 2 dpf. (e and f) Enlargement of the notochord (n) in the tail at 2 dpf. Cartilage matrix is homogeneously stained in sibling larvae (a, c, and e), whereas abnormal protein aggregates can be seen in the cartilage matrix and around the notochord in goz larvae (d and f). (Scale bars are 200 μm in a and b and 50 μm in c–f.)
The first defects in goz can be observed during the transition from chondrocyte condensation to chondrocyte differentiation as indicated by the Col II staining defect. Because interaction with endoderm is known to be required at this stage of cartilage development (28, 29), we examined the expression patterns of bmp-4 and of endoderm and paraxial mesoderm markers shh and its receptor, ptc. The expression patterns of all three of these genes are normal in goz (see supporting information, which is published on the PNAS web site), indicating that SSH and BMP-4 signaling occurs normally during chondrogenesis in goz.
Because the first molecular defect observed in goz is the appearance of abnormal Col II protein aggregates, we investigated the expression pattern of col II mRNA. Col II is expressed in the notochord, floor plate, hypochord, pharyngeal arches, epithelia of the otic capsules, and mesenchyme of the neurocranium in wild-type embryos. Although the Col II protein pattern is abnormal in goz, expression of the col II mRNA in goz mutants is identical to wild-type larvae at 22–48 hpf (data not shown). These results suggest that the Col II defect is caused posttranscriptionally in goz.
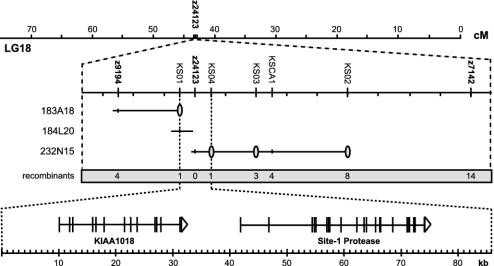
Goz Phenotype Is Caused by Defects in S1P. To understand the mechanism by which cartilage formation is impaired in goz, the underlying gene defect was identified by positional cloning. The goz locus was mapped to a 0.23-centimorgan region of linkage group 18 between microsatellite markers z9194 and z7142 (Fig. 4). The lack of recombination between goz and simple sequence-length polymorphism marker z24123 in >8,000 meioses indicates close linkage of this marker to the mutation. A bacterial artificial chromosome contig was constructed covering the region between the flanking markers z9194 and z7142. Single nucleotide polymorphism markers KS01 and KS04 identified a critical interval of 0.026 centimorgans for the goz locus comprising 86 kb of genomic sequence.
Fig. 4.
Positional cloning of the goz locus. Meiotic mapping using microsatellite markers (Middle) placed goztr6721 mutation on linkage group 18 (LG18) (Top) between markers z9194 and z7142, close to marker z24123. Single-nucleotide polymorphism markers are represented by gray ovals overlying genomic clones (solid lines in Middle). The number of recombinants between the different markers from 7,500 to 8,000 meioses is summarized at the bottom of Middle. (Bottom) Models of genes predicted in the critical interval (scale in kb). Exons are represented as vertical lines; direction of transcription is shown by arrowheads.
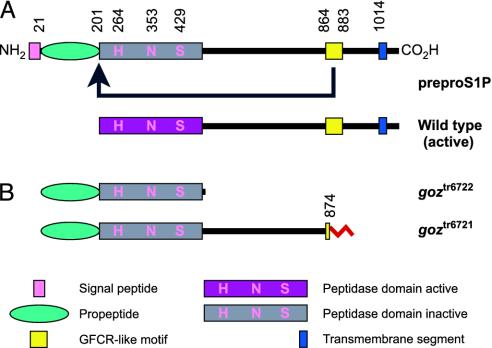
Analysis of the genomic sequence covering the goz locus identified two genes in this interval, s1p and a gene with homology to human KIAA1018 (Fig. 4). s1p cDNA of the two independent goz alleles goztr6722 and goztr6721 was sequenced and compared with wild-type siblings to identify mutations. A G to T transversion changing amino acid 508 from Glu to a stop codon was identified in goztr6722. goztr6721 carriesaGtoA transition that inactivates a splice donor site resulting in a 13-bp insertion of intronic sequence into the mRNA, resulting in a frameshift at position 874 that leads to a premature stop codon at amino acid 937. Both mutations were confirmed by genomic DNA from goz mutant animals.
PMO Knockdown of S1P Phenocopies the goz Phenotype. To validate that mutations in s1p cause the cartilage phenotype of goz, S1P was knocked down by injection of antisense PMOs. Injected larvae displayed hammerhead morphology, reduced alcian blue staining, irregular chondrocyte stacking, and Col II aggregates typically seen in goz mutants (Fig. 5 a–c). PMOs designed against the second gene in the interval did not yield a goz-like phenotype (data not shown). These results verify s1p as the affected gene in the goz mutant.
Fig. 5.
PMO phenocopy of goz phenotype. Shown are branchial arches of goz (b) or larvae injected with s1p (c) or s2p (d). PMOs show randomly arranged chondrocytes (arrows). Injection of SCAP PMOs resulted in wild-type cartilage (e), which is indistinguishable from injection controls (a). Larvae were stained with alcian blue at 5 dpf. (Scale bar is 50 μm.)
Zebrafish S1P. S1P is an endopeptidase (30) in the secretory pathway (30, 31), which has been known to activate proproteins, including SREBPs (32) or ATF6 (31). The zebrafish s1p gene underlying the goz defect encodes a protein of 1,074 aa with 82% identity to human S1P (see Fig. 6A for domain structure, Fig. 4 for gene model, and supporting information for details).
Fig. 6.
S1P. (A) S1P is synthesized as preproprotein and activated through sequential cleavage. A growth factor cytokine receptor (GFCR)-like motif is essential for this autocatalytic process (arrow in A). (B) Both goz alleles result in truncated proteins lacking intact GFCR-like motifs and are predicted to express only inactive S1P. An altered sequence caused by splice defects in goztr6721 is shown in red. The figure was adapted from Elagoz et al. (33).
The growth factor cytokine receptor (GFCR) motif of S1P is essential for autoprocessing of the proprotein and formation of active protease in vitro (33). The GFCR motif, which is well conserved in zebrafish (see supporting information), is absent or disrupted in both goz mutant alleles goztr6722 and goztr6721, resulting in an S1P protein that is predicted to be inactive (Fig. 6B). The PMO knockdown results confirm independently that goztr6722 and goztr6721 represent the loss-of-function phenotype of S1P.
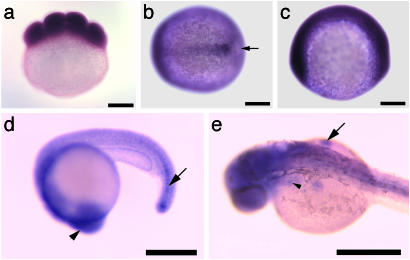
Expression Pattern of s1p in Zebrafish. s1p is expressed throughout the embryo at all stages of zebrafish embryogenesis. The most prominent sites of expression are the developing midline at tailbud stage (Fig. 7b), the head and the immature notochord at 20 hpf (Fig. 7d), and the head, the developing pectoral fins, and the region of the endodermal pouches, in which neural crest cells migrate to form the branchial arches, at 34 hpf (Fig. 7e). Expression of s1p is indistinguishable between wild type and goz.
Fig. 7.
Expression pattern of S1P. Whole-mount in situ hybridization with s1p in eight-cell stage (a), tailbud stage (b), two-somite stage (c), 20 hpf (d), and 34 hpf (e) zebrafish embryos. (a, c, and d) Lateral view. (b) Dorsal view. (e) Dorsolateral view. Both maternal (a) and zygotic (b–e) expression of s1p can be observed. Expression is pronounced in the midline at tailbud stage (arrow in b). Strong expression can be seen in the head (d, arrowhead) and the immature notochord (d, arrow) at 20 hpf. At 34 hpf (e), s1p is strongly expressed in the head, the fin buds (arrow), and the region of the endodermal pouches (arrowhead). (Scale bar is 200 μm.)
Zebrafish S1P Functions Locally. S1P is a membrane-bound protease that cleaves itself to yield an active, secreted enzyme in vitro (30), offering the possibility that S1P also functions outside the cell. We performed mosaic analysis by heterochronic cell transplantation (25) to test whether a secreted form of S1P might be involved in chondrocyte development. Wild-type donor cells labeled by vital dye were taken from random positions from donor blastulae and transplanted to the host marginal region, which gives rise to axial structures, such as notochord, floor plate, and hypochord (25). Transplanted wild-type cells showed normal, homogeneous Col II protein distribution in their direct surrounding, but even clones of up to 12 wild-type cells did not rescue the Col II defect of adjacent mutant cells (see supporting information). Despite the limited resolution of using an extracellular protein to test cell autonomy, genetic mosaic analysis does not support a noncell autonomous function of zebrafish S1P in cartilage development, indicating that S1P acts within or close to the cells in which it is expressed.
Lipid Metabolism Is Affected in goz Mutants. SREBPs are key targets for S1P. S1P cleaves the membrane-bound SREBPs in the lumen of the Golgi apparatus to initiate the release of active transcription factor, which promotes transcription of key enzymes involved in biosynthesis of cholesterol and fatty acids (19). We stained neutral fat, including cholesterol, with oil red O to investigate whether lipid distribution is affected in S1P mutants.
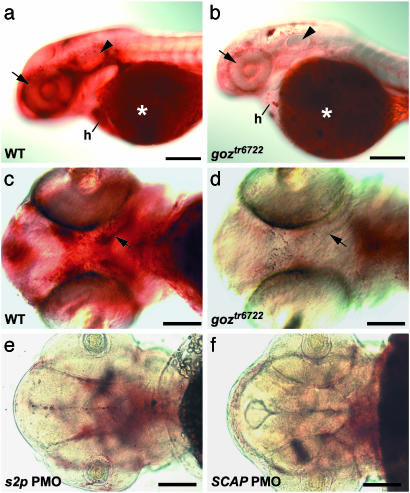
Lipids were found in high concentrations around the eye, the otic vesicle, and the olfactory placodes in wild-type embryos at 48 hpf (Fig. 8a). High lipid concentrations were also observed in the head where the first cartilage elements, the trabeculae of the neurocranium, develop at this stage (Fig. 8c). However, in goz, much lower lipid concentrations were observed around the otic vesicle and olfactory placodes, and in the region around the developing trabeculae (Fig. 8 b and d), whereas yolk lipid appeared normal. Lipid distribution was normal in several other cartilage mutants, including jeftw37 (sox9a), t22982, t26045, t26046, t2281, and t2430 (K.S., unpublished data and data not shown). These phenotypes confirm specifically decreased lipid levels in zebrafish s1p mutants and suggest a conserved role of S1P in lipid metabolism.
Fig. 8.
Lipid defects in zebrafish s1p mutants. Oil red O staining of 48 hpf zebrafish larvae. (a and b) Lateral view. (c–f) Ventral view. goz (b and d) and sibling (a and c) larvae and larvae injected with 6 ng of s2p2 (e) and 12 ng of SCAP1 (f) PMOs are shown. Strong lipid staining can be observed around the eye (arrow), the otic vesicle (arrowhead), and in the heart (h) of sibling larvae (a), in addition to the region of developing trabeculae (arrow in c). Both sibling and goz larvae show a strong lipid staining of the yolk (asterisks in a and b). Lipid deposit is severely reduced in all other tissues in goz larvae (b), especially around the eye (arrow) and the otic vesicle (arrowhead). No lipid can be detected around the developing trabeculae in goz (arrow in d). (e and f) Injection of s2p and SCAP PMOs results in the same reduction of lipid. (Scale bars are 200 μm in a and b and 100 μm in c–f.)
Cartilage and Lipid Defects Are Caused Independently by S1P. SREBPs are processed by another protease, S2P (34). SREBP proteolysis is regulated by SCAP, which forms a complex with SREBP in the endoplasmic reticulum membrane. PMO knockdown of S2P results in the same cartilage (Fig. 5 b and d) and lipid phenotypes (Fig. 8 d and e) as S1P. Knockdown of SCAP using two different PMOs at various concentrations, however, yields strong lipid phenotypes (Fig. 8f) at low PMO doses, whereas cartilage is completely normal (Fig. 5e) even at high PMO doses. These results indicate that the lipid phenotypes are caused by a SCAP-dependent mechanism, whereas the cartilage phenotypes are caused by a SCAP-independent mechanism.
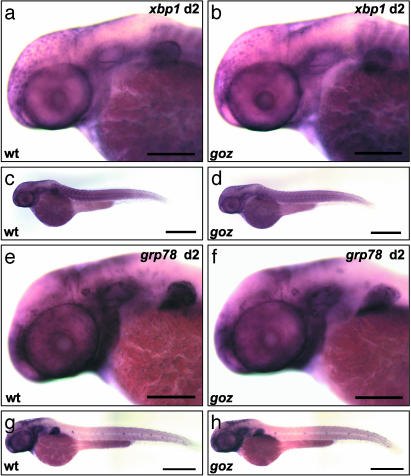
XBP1 Expression Is Not Affected in S1P Mutants. Because S1P regulates cartilage development in a SCAP-independent manner, we investigated S1P target proteins that are processed in the absence of SCAP. ATF6 is a protein that is processed by S1P and S2P in a SCAP-independent way (31). ATF6 induces XBP1 to regulate the unfolded protein response in the endoplasmic reticulum to prevent accumulation of unfolded protein in the secretory pathway (35). The expression levels of xbp1 or grp78 are, however, normal in goz (Fig. 9), indicating that S1P is not required for XBP1 or GRP78 expression in zebrafish larvae at 2 dpf.
Fig. 9.
Expression pattern of xbp1 and grp78. Whole-mount in situ hybridization with xbp1 and grp78 at 48 hpf is shown from a lateral view. The expression patterns of xbp1 and grp78 are indistinguishable between goz (b, d, f, and h) and wild type (a, c, e, and g). (Scale bars are 200 μmin a, b, e, and f, 500 μm in c and d, and 400 μm in g and h.)
Discussion
We have used genetic analysis in zebrafish to analyze molecular mechanisms of vertebrate cartilage development. A zebrafish mutant, goz, was selected for molecular analysis from a collection of mutants with general cartilage defects. goz has extracellular matrix defects, irregular chondrocyte morphology, and a smaller head skeleton because of mutations in the gene encoding the zebrafish s1p.
Zebrafish s1p shows strong expression in all domains of chondrogenesis, including the head and the pectoral fins, as well as widespread expression during early embryogenesis. This expression pattern overlaps with the col II expression domain, which is consistent with a role for s1p in skeletal development and with s1p expression in molars and bone of 2-day-old rats (30).
One of the major known functions of S1P is the activation of SREBPs, which control expression of key enzymes of cholesterol and fatty acid biosynthesis and transport (36). Conditional knockout of s1p in mice results in a 64–83% decrease in the rates of cholesterol and fatty acid biosynthesis in hepatocytes (37). Both goz alleles, which are predicted to lack active S1P, show severe lipid deficiencies, consistent with a role of S1P in SREBP processing in zebrafish. The molecular mechanisms of lipid metabolism or transport in the zebrafish embryo are currently not known.
Marker genes for SREBP-dependent expression in mammalian cells, such as HMG–CoA reductase, HMG–CoA synthase, fatty acid synthase, and acetyl-CoA–carboxylase, are not expressed in ≤48-hpf zebrafish embryos (K.S., unpublished observation).‡ However, the pathway regulating lipid metabolism or transport, namely processing of SREBPs by S1P and S2P on SCAP-dependent transport to the Golgi apparatus (20), is conserved, as indicated by lipid phenotypes of S1P, S2P, and SCAP knockdown in zebrafish.
Whereas knockdown of zebrafish S2P results in the same cartilage phenotype as loss of S1P, knockdown of SCAP does not affect cartilage development. SCAP has been knocked down effectively in these experiments because two independent SCAP PMOs result in the same lipid phenotype even at low PMO doses. In contrast, cartilage was completely normal even at high SCAP PMO doses. The lipid phenotype can thus be separated from the cartilage phenotype. Both processes require cleavage of one or several factors by S1P and S2P, but the pathway regulating lipid metabolism is then dependent on SCAP, as it is in Chinese hamster ovary cells (39), whereas SCAP is not required for cartilage development.
Another protein processed by S1P and S2P is ATF6 (31). ATF6 is a membrane-bound transcription factor in the endoplasmic reticulum, which is involved in the unfolded protein response (UPR) to enhance protein folding or refolding capacity of the secretory pathway (40), for example, in cartilage and bone cells (41). ATF6 or the UPR have not been described in the zebrafish. The earliest phenotype of S1P or S2P deficiencies in zebrafish embryos, namely abnormal Col II aggregates in the extracellular matrix, is consistent with a defect in protein folding. Analysis of markers of ATF6-regulated UPR, XBP1, and GRP78, however, has not provided further evidence for this hypothesis because these markers are expressed normally in zebrafish S1P mutants. It can also currently not be excluded that S1P and S2P cleave collagens directly, as has been shown for other subtilisin proteases (42).
Abnormal collagen aggregates and resulting disorder of the collagen network could result in the reduction of cohesive properties of the goz cartilage matrix. This is consistent with the loss of proteoglycans observed in goz and in cartilage disorders in mice (38), as well as with the disruption of the columnar arrangement of chondrocytes in goz. The pathway by which S1P and S2P regulate cartilage development is not fully understood, but the zebrafish and the goz mutant in particular provide an ideal vertebrate model to elucidate this molecular mechanism.
Supplementary Material
Acknowledgments
We thank M. El Ghoul (Exelixis Deutschland) for help with embryo collection and preparation; C. Hallwachs (Exelixis Deutschland) for support with genetic mapping; H. Tintrup (Exelixis) for assistance with bacterial artificial chromosome sequencing; J. Odenthal (Exelixis Deutschland) for introduction to cell transplantations; T. Trowe (Exelixis Deutschland) for discussion and support; U. Langheinrich (Exelixis Deutschland) for providing oil red O and lectin staining protocols; the Exelixis Deutschland fish core group for fish maintenance; and the Tuebingen stock center for providing mutants.
This paper was submitted directly (Track II) to the PNAS office.
Abbreviations: BMP, bone morphogenetic protein; Col II, collagen II; dpf, days post fertilization; hpf, hours post fertilization; Shh, sonic hedgehog; SREBP, sterol regulatory element-binding proteins; S1P, site-1 protease; SCAP, SREBP cleavage-activating protein; PMO, phosphomorpholino oligonucleotide.
Data deposition: The sequence reported in this paper has been deposited in the GenBank database (accession no. AY261515).
Footnotes
Thorpe, J., Santana, E., Raz, E. & Farber, S. (2003) Third European Conference on Zebrafish and Medaka Genetics and Development, p. P197 (abstr.).
References
- 1.Olson, E. N., Brown, D., Burgess, R. & Cserjesi, P. (1996) Ann. N. Y. Acad. Sci. 785, 108–118. [DOI] [PubMed] [Google Scholar]
- 2.Zhang, Z., Song, Y., Zhao, X., Zhang, X., Fermin, C. & Chen, Y. (2002) Development (Cambridge, U.K.) 129, 4135–4146. [DOI] [PubMed] [Google Scholar]
- 3.ten Berge, D., Brouwer, A., Korving, J., Reijnen, M. J., van Raaij, E. J., Verbeek, F., Gaffield, W. & Meijlink, F. (2001) Development (Cambridge, U.K.) 128, 2929–2938. [DOI] [PubMed] [Google Scholar]
- 4.Liu, W., Li, G., Chien, J. S., Raft, S., Zhang, H., Chiang, C. & Frenz, D. A. (2002) Dev. Biol. 248, 240–250. [DOI] [PubMed] [Google Scholar]
- 5.Hu, D. & Helms, J. A. (1999) Development (Cambridge, U.K.) 126, 4873–4884. [DOI] [PubMed] [Google Scholar]
- 6.Anderson, R. M., Lawrence, A. R., Stottmann, R. W., Bachiller, D. & Klingensmith, J. (2002) Development (Cambridge, U.K.) 129, 4975–4987. [DOI] [PubMed] [Google Scholar]
- 7.Baker, J., Liu, J. P., Robertson, E. J. & Efstratiadis, A. (1993) Cell 75, 73–82. [PubMed] [Google Scholar]
- 8.Nonaka, K., Shum, L., Takahashi, I., Takahashi, K., Ikura, T., Dashner, R., Nuckolls, G. H. & Slavkin, H. C. (1999) Int. J. Dev. Biol. 43, 795–807. [PubMed] [Google Scholar]
- 9.Peltonen, L., Halila, R. & Ryhanen, L. (1985) J. Cell Biochem. 28, 15–21. [DOI] [PubMed] [Google Scholar]
- 10.Olsen, B. R. (1996) Ann N.Y. Acad. Sci. 785, 124–130. [DOI] [PubMed] [Google Scholar]
- 11.Ahmad, N. N., Ala-Kokko, L., Knowlton, R. G., Jimenez, S. A., Weaver, E. J., Maguire, J. I., Tasman, W. & Prockop, D. J. (1991) Proc. Natl. Acad. Sci. USA 88, 6624–6627. [DOI] [PMC free article] [PubMed] [Google Scholar]
- 12.Vikkula, M., Mariman, E. C., Lui, V. C., Zhidkova, N. I., Tiller, G. E., Goldring, M. B., van Beersum, S. E., de Waal Malefijt, M. C., van den Hoogen, F. H., Ropers, H. H., et al. (1995) Cell 80, 431–437. [DOI] [PubMed] [Google Scholar]
- 13.Andersson, H. C. (2002) Cell Mol. Biol. 48, 173–177. [PubMed] [Google Scholar]
- 14.Rauch, G. J., Hammerschmidt, M., Blader, P., Schauerte, H. E., Strahle, U., Ingham, P. W., McMahon, A. P. & Haffter, P. (1997) Cold Spring Harbor Symp. Quant. Biol. 62, 227–234. [PubMed] [Google Scholar]
- 15.Yan, Y. L., Miller, C. T., Nissen, R. M., Singer, A., Liu, D., Kirn, A., Draper, B., Willoughby, J., Morcos, P. A., Amsterdam, A., et al. (2002) Development (Cambridge, U.K.) 129, 5065–5079. [DOI] [PubMed] [Google Scholar]
- 16.Murtaugh, L. C., Chyung, J. H. & Lassar, A. B. (1999) Genes Dev. 13, 225–237. [DOI] [PMC free article] [PubMed] [Google Scholar]
- 17.Concordet, J. P., Lewis, K. E., Moore, J. W., Goodrich, L. V., Johnson, R. L., Scott, M. P. & Ingham, P. W. (1996) Development (Cambridge, U.K.) 122, 2835–2846. [DOI] [PubMed] [Google Scholar]
- 18.Nikaido, M., Tada, M., Saji, T. & Ueno, N. (1997) Mech. Dev. 61, 75–88. [DOI] [PubMed] [Google Scholar]
- 19.Brown, M. S. & Goldstein, J. L. (1999) Proc. Natl. Acad. Sci. USA 96, 11041–11048. [DOI] [PMC free article] [PubMed] [Google Scholar]
- 20.Nohturfft, A., DeBose-Boyd, R. A., Scheek, S., Goldstein, J. L. & Brown, M. S. (1999) Proc. Natl. Acad. Sci. USA 96, 11235–11240. [DOI] [PMC free article] [PubMed] [Google Scholar]
- 21.Westerfield, M. (1994) The Zebrafish Book (Univ. of Oregon Press, Eugene).
- 22.Kimmel, C. B., Ballard, W. W., Kimmel, S. R., Ullmann, B. & Schilling, T. F. (1995) Dev. Dyn. 203, 253–310. [DOI] [PubMed] [Google Scholar]
- 23.Piotrowski, T., Schilling, T. F., Brand, M., Jiang, Y. J., Heisenberg, C. P., Beuchle, D., Grandel, H., van Eeden, F. J., Furutani-Seiki, M., Granato, M., et al. (1996) Development (Cambridge, U.K.) 123, 345–356. [DOI] [PubMed] [Google Scholar]
- 24.Schulte-Merker, S. (2002) in Zebrafish, eds. Nüsslein-Volhard, C. & Dahm, R. (Oxford Univ. Press, Oxford), pp. 39–58.
- 25.Halpern, M. E., Thisse, C., Ho, R. K., Thisse, B., Riggleman, B., Trevarrow, B., Weinberg, E. S., Postlethwait, J. H. & Kimmel, C. B. (1995) Development (Cambridge, U.K.) 121, 4257–4264. [DOI] [PubMed] [Google Scholar]
- 26.Shimoda, N., Knapik, E. W., Ziniti, J., Sim, C., Yamada, E., Kaplan, S., Jackson, D., de Sauvage, F., Jacob, H. & Fishman, M. C. (1999) Genomics 58, 219–232. [DOI] [PubMed] [Google Scholar]
- 27.Haffter, P., Granato, M., Brand, M., Mullins, M. C., Hammerschmidt, M., Kane, D. A., Odenthal, J., van Eeden, F. J., Jiang, Y. J., Heisenberg, C. P., et al. (1996) Development (Cambridge, U.K.) 123, 1–36. [DOI] [PubMed] [Google Scholar]
- 28.Hall, B. K. (1980) J. Embryol. Exp. Morphol. 58, 251–264. [PubMed] [Google Scholar]
- 29.David, N. B., Saint-Etienne, L., Tsang, M., Schilling, T. F. & Rosa, F. M. (2002) Development (Cambridge, U.K.) 129, 4457–4468. [DOI] [PubMed] [Google Scholar]
- 30.Seidah, N. G., Mowla, S. J., Hamelin, J., Mamarbachi, A. M., Benjannet, S., Toure, B. B., Basak, A., Munzer, J. S., Marcinkiewicz, J., Zhong, M., et al. (1999) Proc. Natl. Acad. Sci. USA 96, 1321–1326. [DOI] [PMC free article] [PubMed] [Google Scholar]
- 31.Ye, J., Rawson, R. B., Komuro, R., Chen, X., Dave, U. P., Prywes, R., Brown, M. S. & Goldstein, J. L. (2000) Mol. Cell 6, 1355–1364. [DOI] [PubMed] [Google Scholar]
- 32.Espenshade, P. J., Cheng, D., Goldstein, J. L. & Brown, M. S. (1999) J. Biol. Chem. 274, 22795–22804. [DOI] [PubMed] [Google Scholar]
- 33.Elagoz, A., Benjannet, S., Mammarbassi, A., Wickham, L. & Seidah, N. G. (2002) J. Biol. Chem. 277, 11265–11275. [DOI] [PubMed] [Google Scholar]
- 34.Rawson, R. B., Zelenski, N. G., Nijhawan, D., Ye, J., Sakai, J., Hasan, M. T., Chang, T. Y., Brown, M. S. & Goldstein, J. L. (1997) Mol. Cell 1, 47–57. [DOI] [PubMed] [Google Scholar]
- 35.Lee, K., Tirasophon, W., Shen, X., Michalak, M., Prywes, R., Okada, T., Yoshida, H., Mori, K. & Kaufman, R. J. (2002) Genes Dev. 16, 452–466. [DOI] [PMC free article] [PubMed] [Google Scholar]
- 36.Brown, M. S. & Goldstein, J. L. (1997) Cell 89, 331–340. [DOI] [PubMed] [Google Scholar]
- 37.Yang, J., Goldstein, J. L., Hammer, R. E., Moon, Y. A., Brown, M. S. & Horton, J. D. (2001) Proc. Natl. Acad. Sci. USA 98, 13607–13612. [DOI] [PMC free article] [PubMed] [Google Scholar]
- 38.Li, Y., Lacerda, D. A., Warman, M. L., Beier, D. R., Yoshioka, H., Ninomiya, Y., Oxford, J. T., Morris, N. P., Andrikopoulos, K., Ramirez, F., et al. (1995) Cell 80, 423–430. [DOI] [PubMed] [Google Scholar]
- 39.Hua, X., Nohturfft, A., Goldstein, J. L. & Brown, M. S. (1996) Cell 87, 415–426. [DOI] [PubMed] [Google Scholar]
- 40.Kaufman, R. J. (2002) J. Clin. Invest. 110, 1389–1398. [DOI] [PMC free article] [PubMed] [Google Scholar]
- 41.Zhang, P., McGrath, B., Li, S., Frank, A., Zambito, F., Reinert, J., Gannon, M., Ma, K., McNaughton, K. & Cavener, D. R. (2002) Mol. Cell. Biol. 22, 3864–3874. [DOI] [PMC free article] [PubMed] [Google Scholar]
- 42.Imamura, Y., Steiglitz, B. M. & Greenspan, D. S. (1998) J. Biol. Chem. 273, 27511–27517. [DOI] [PubMed] [Google Scholar]
Associated Data
This section collects any data citations, data availability statements, or supplementary materials included in this article.


