Abstract
Plant responses to environmental changes are associated with electrical excitability and signaling; automatic and continuous measurements of electrical potential differences (ΔEP) between plant tissues can be effectively used to study information transport mechanisms and physiological responses that result from external stimuli on plants. The generation and conduction of electrochemical impulses within plant different tissues and organs, resulting from abiotic and biotic changes in environmental conditions is reported. In this work, electrical potential differences are monitored continuously using Ag/AgCl microelectrodes, inserted 5 mm deep into sapwood at two positions in the trunks of several Avocado trees. Electrodes are referenced to a non polarisable Ag/AgCl microelectrode installed 20 cm deep in the soil. Systematic patterns of ΔEP during absolute darkness, day-night cycles and different conditions of soil water availability are discussed as alternative tools to assess early plant stress conditions.
Key words: plant electrical potential, light and dark cycles, water availability, plant signaling, avocado trees, plant sensors, irrigation automation
Introduction
Plants have developed mechanisms to perceive and transmit information between its organs and tissues, as part of its evolutionary development, facing the need to respond quickly to external stimuli from the environment. Until a few years ago, signals within the plants had been scientifically documented as hormonal or hydraulic in nature, but recently it has been shown that different environmental stimuli also produce electrical signals at the cellular level, which are transmitted to different tissues, causing physiological responses to biotic and abiotic stimuli.1–3
Two types of electrical signals in plants have been described: fast signals (action potentials, AP) and slow signals (variation potentials, VP); a new type of EP signal, called system potential, has been recently postulated.4 AP is an electrical waveform that is transmitted along the cell membrane,5 characterized by a response of “all or nothing”, i.e. when the stimulus reaches a certain threshold (which leads to depolarization of the cell membrane), additional increases in the intensity of the stimulus does not change its amplitude and intensity.6–8 Thus, AP allows cells, tissues and organs to transmit electrical signals over short and long distances in the plant.7 The mechanism of AP is the exchange of Ca+2, K+ and Cl− ions between extra-and intracellular space, across cell membranes.1,2,9
VP propagate in the plant, as temporal changes in the depolarization and repolarization of the cell membrane; this kind of signal varies with the intensity of stimulation and appears to be associated with changes in water tension or ion concentrations, creating a transient electrochemical unbalance in the xylem.8,10–12
Changes in electrical potentials are mediated through receptors located in cell membranes, which activate specific ion channels and pumps.2,13–17 The electrical signals are transmitted through plant living cells, especially by the phloem, since there is less resistance to electric flow in these cells, as compared with other plant tissues.1,18 Several studies have reported the effect of different stimuli that induce action potential gradients in plants, mainly light/dark,19,20 temperature variations,21–23 intense cold,2,4 water availability,25,26 hormones,27 mechanical wounding28 and insects.13 Also, it has been suggested that electrical signals could induce a genetic reprogramming,16,24,29 triggering mechanisms of gene expression, as transcription and translation of specific proteins, inducing the formation of hormones such as ethylene,30 ABA31,32 and jasmonic acid27,32 in remote tissues, where the plant perceives the stimulus. After the electrical signal is produced, it is transmitted through the plant to a specific organ or tissue, which generates immediate physiological actions in response to stimulation.14,24
Studies of electrical signals in plants started with the description of a possible proto-nervous system, postulated33–35 by Sanderson (1873), Darwin (1875) and Bose (1926). These investigations led to the onset of Plant Neurophysiology, a new discipline of plant physiology, with the objective to understand how plants monitor and react to their environment and how they process this information to enhance growth.2,36,37 Possible applications of electrical signals in plants have been postulated, including its eventual use as environmental biosensors,9,38 as well as an early detector of water stress conditions, which could automatically activate irrigation systems for high frequency water applications.39 Also, the use of daily electric potential variations in a tree trunk to directly assessing evapotranspiration by sap flow determinations has been proposed.40 Artificially applied electric potential differentials between plant organs under field conditions may enhance water use efficiency in woody plants, through its controlled influence on stomata conductance and plant internal water flux.8,41,42
The hypothesis of this work is the existence of mechanisms for information perception, transmission and processing between different organs of a woody plant, based on the generation of AP and VP, that could serve as early indicators of biotic or abiotic induced stress conditions; real-time detection of these electrical signals provide a strategy to quantitatively relate plant reactions to environmental changes, The objective of this paper is to determine changes in extracellular electric potential in avocado trees, resulting from changes in dark/- light and water availability
Results
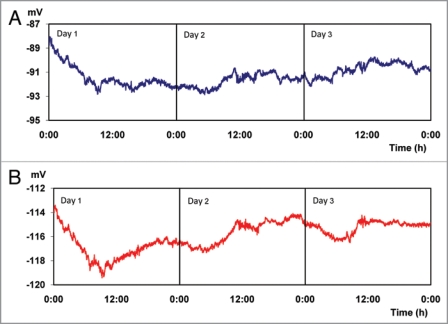
In Figure 1 results for experiment 1 are presented, in which the plants were continuously maintained in total darkness for a period of 72 hours. There are seemingly stable EP of −91.29 ± 0.82 mV and −115.92 ± 1.18 mV, measured with micro electrodes inserted into the trunk at 25 cm and 85 cm above the soil surface, respectively (Fig. 1A and B). However, when performing a statistical analysis of the information presented in Figure 1, grouping the data into 4 periods of 6 hours throughout the day, equivalent to natural fluctuations in day and night light conditions, significant differences of electric potential between these periods are found (Table 1). These differences in EP between different time periods, indicate a possible circadian rhythm even under conditions of continuous total darkness, as it has been postulated by other authors43,44 who attributed Ca+2 concentration fluctuation as a regulator of genes involved in the circadian cycle.45
Figure 1.
Electrical potentials (EP) measured every 30 s for 72 hours. (Average values for 6 trees growing under conditions of constant darkness, 0 Wm−2). Micro electrodes inserted at 25 (A) and 85 (B) cm above the soil surface, respectively.
Table 1.
Electrical potentials (EP) measured in conditions of total darkness (Average values of 6 trees)
| Period | Ep [mV] | |
| 25 cm* | 85 cm* | |
| Dawn 2:00–7:59 | −91.46 c | −116.51 d |
| Morning 8:00–13:59 | −91.27 b | −116.24 c |
| Afternoon 14:00–19:59 | −91.17 a | −115.58 b |
| Night 20:00–01:59 | −91.26 b | −115.31 a |
Tukey Kramer (α = 0.05); *Micro electrodes inserted at 25 and 85 cm above the soil surface, respectively.
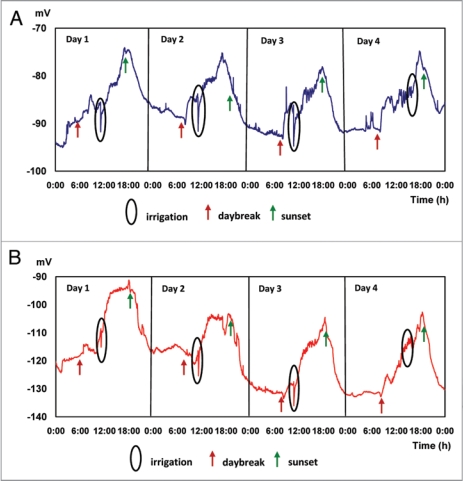
After subjecting trees from experiment 1 to a period of 5 days of normal day and night light conditions in the greenhouse, measurements for experiment 2 are initiated; results of this experiment are presented in Figure 2. Under dark-light conditions EP vary in cycles throughout the measurement period: during the morning (2:00 to 7:59 AM), the mean 4-day EP average is in the range −89.991 ± 0, 46 mV at 25 cm and −121.53 ± 0.5 mV at 85 cm above the ground, respectively. During the afternoon (14:00 at 19:59 PM), EP values rise, reaching mean values of −79.71 ± 2.16 mV at 25 cm and −104.05 ± 1.21 mV at 85 cm above the ground, respectively, and maximum values of −76.16 ± 20 mV at 17:10 PM (25 cm) and −101.35 ± 5.05 mV at 18:30 PM (85 cm). Values presented in Table 2 indicate the existence of significant differences in EP between the periods compared. The effect of irrigation applied every day at 11:00 AM is clearly expressed by a significant decrease in EP, of the order of 7.10 ± 1.56 mV and 7.53 ± 1.39 mV, for micro electrodes inserted in the tree trunk at 25 and 85 cm above the soil surface respectively, representing specific characteristics of an action potential (AP), similar to data recently reported in the literature.28,46
Figure 2.
Electric potentials (EP) in avocado trees during 4 irrigated days. Average values of 7 trees. Micro electrodes inserted at 25 (A) and 85 (B) cm above the soil surface.
Table 2.
Electrical potentials (EP) measured in daily irrigation (Average values of 7 plants)
| EP [mV] | ||
| Periods | 25 cm* | 85 cm* |
| Dawn 2:00–7:59 | −89.99 c | −121.5287 d |
| Morning 8:00–13:59 | −85.77 d | −116.4938 b |
| Afternoon 14:00–19:59 | −79.71 a | −104.0548 a |
| Night 20:00–01:59 | −88.67 b | −120.8095 c |
Tukey Kramer (α = 0.05); *Micro electrodes inserted at 25 and 85 cm above the soil surface, respectively.
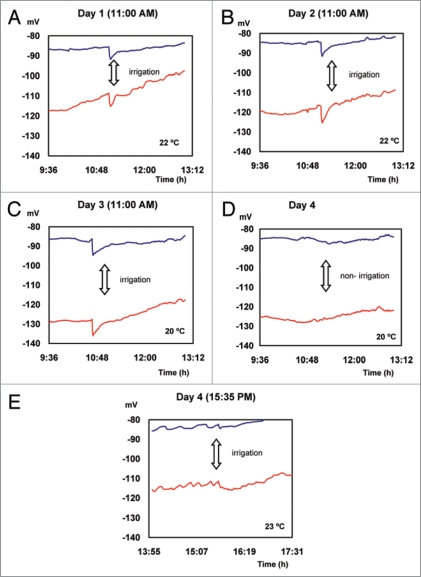
EP average values presented in Figure 2, are plotted for a short period of time before and after 3 pulses of water are applied once a day at 11:00 AM (Fig. 3). The recovery of EP values measured before irrigation requires an average period of 16 minutes. On the fourth day, irrigation applied at 15:35 PM did not induce changes in the electrical potential (Fig. 3E), probably due to a low atmospheric demand.
Figure 3.
Action potentials induced by irrigation.
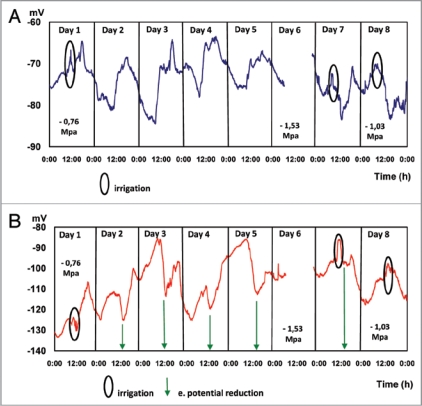
Water restriction maintained for 5 days (Fig. 4) determines a characteristic behavior in the EP measured in the trunk at 25 and 85 cm above the ground. During dawn hours (2:00 to 8:00 AM) the potential reaches stable values of −77.85 ± 1.057 mV and −109.16 ± 3.73 mV at 25 and 85 cm above the ground, respectively. During the morning hours, a steady increment of EP, −74.37 ± 4.3 mV and −109.69 ± 6.1 mV (measured at 25 and 85 cm above the ground, respectively) takes place, with significant increments during the afternoon, reaching values of −68.24 mV ± 1.37 and 106.91 ± 2.43 measured in the trunk at 25 and 85 cm above the ground, respectively.
Figure 4.
Continuous electric potential (EP) measurements for 8 days. Days 1, 7 and 8 irrigated, days 2 to 6 are not irrigated Average EP values of 5 plants. Micro electrodes inserted at 25 (A) and 85 (B) cm above the soil surface.
On days corresponding to water restriction (days 3, 4 and 5), as well as on irrigation days (1, 7 and 8), EP values are significantly higher in the afternoon, as compared to EP measured at different hours throughout the day, probably due to the higher evaporative demand, since the effect is stronger when measured in the trunk closer to the foliage (85 cm above the soil surface) (Table 3).
Table 3.
Average electrical potentials (EP) for 6 hours intervals for, non irrigated and irrigated days (Average values of 4 plants)
| EP [mV] non irrigated, days 3 – 4 – 5 | EP [mV] irrigated, days 1 – 7 – 8 | |||
| Periods | 25 cm* | 85 cm* | 25 cm* | 85 cm* |
| Dawn 2:00–7:59 | −77.85 d | −109.16 c | −74.17 c | −113.45 c |
| Morning 8:00–13:59 | −74.37 c | −109.68 c | −74.75 b | −107.43 b |
| Afternoon 14:00–19:59 | −68.13 a | −106.91 a | −75.15 a | −104.32 a |
| Night 20:00–01:59 | −72.70 b | −108.25 b | −75.75 d | −115.39 d |
Tukey Kramer (α = 0.05); *Micro electrodes inserted at 25 and 85 cm above the soil surface, respectively.
Values presented in Table 4 indicate that the maximum EP will be gradually increased by the cumulative effect of water restriction on the xylematic potential, which varied from −0.76 MPa (day 1) and −1.53 MPa (day 6, measured at 11:30 AM, just before irrigation). This last value represents a severe water deficit condition in avocado trees.31
Table 4.
Maximum electrical potentials (EP) as related to water restriction (evaluated by xylematic potential measurements with a Scholander pressure pump)
| Day | Maximal EP at 85 cm* (mV) | Xylematic Potential (MPa) |
| 1 | −106.49 | −0.76 |
| 2 | −99.91 | |
| 3 | −85.39 | |
| 4 | −93.22 | |
| 5 | −85.72 | |
| 6 | −1.53 | |
| 7 | −83.38 | |
| 8 | −97.61 | −1.03 |
Irrigation was resumed at 11:59:00 AM of day 7; *Microelectrode inserted at 85 cm above the soil surface.
Additional evidence on the relation between the intensity of the atmospheric evaporative demand (AED) and EP evolution is presented in Table 5. When daily AED is maximum (on sunny days), the electric potential reaches its highest values. However, in overcast and low temperature days (days 2 and 4) when AED is less intense, EP values remain low. After the 4 consecutive days of water restriction, irrigation made on day 7 shows a change in electrical potential, but of lesser magnitude (−11,88 mV between 12:16 and 14:22 PM) with respect to the expected change for a high AED day (Fig. 4). On the second irrigation after the water restriction period (day 8), EP values measured were similar to results corresponding to experiment 2 (Fig. 2): a EP decrease of 6.03 mV between 12:00 and 15:00 PM, indicating that plants have overcome the water stress condition, which is confirmed by the xylematic potential measurement (−1.03 MPa).
Table 5.
Daily minimum values of electric potential
| Day | Maximal electric potential, morning (a) | Minimal electric potential, afternoon (b) | Δ potencial (a–b) | Weather condition | Maximal T (°C) |
| 1* | −124.61 (10:34:00) | −129.13 (12:16:00) | 4.52 | Sunny | 21.2 |
| 2 | −111.81 (8:29:00) | −125.26 (13:43:30) | 14.45 | Overcast | 16.55 |
| 3 | −86.12 (8:24:00) | −113.71 (12:44:30) | 27.59 | Sunny | 21.5 |
| 4 | −109.21 (10:40:00) | −119.69 (12:52:00) | 10.48 | Overcast | 14.8 |
| 5 | −86.03 (8:30:00) | −112.72 (14:22:00) | 26.69 | Sunny | 22.5 |
| 7* | −86.13 (11:16:00) | −98.01 (14:22:00) | 11.88 | Sunny | 21.1 |
| 8* | −98.36 (13:42:00) | −105.99 (18:59:00) | 7.53 | Sunny | 22.5 |
*Days 1, 7 and 8, no water restrictions.
Discussion
Plants respond to external stimuli through different morphological and physiological changes;25 results presented in this paper indicate that light and soil water availability induce important electrophysiological changes in avocado trees, which take place in very short time spans, being transmitted between the different plant organs, consistent with results1 recently published, which demonstrated that different stimuli cause different intensities of electrical signals in plants, expressed as quantitative changes in EP, probably related to the flow of ions (Ca+2, Cl−1, K+1 and H+1);1,7,8 these electrical signals are transmitted through xylem and phloem tissues.8,17
The stimuli generated by an electrical signal, as a response to changes in light and water availability conditions, translates into a rapid response of stomata opening and closing, as indicated by data presented in Figure 2. As a response to daybreak there is a gradual increase of electrical potential, which reaches a maximum value by midday, to decrease during the evening, reaching lower values at night. A similar behavior is observed when comparing the dark treatment (Fig. 1) with periods of light exposure (Fig. 2), in concordance with results published by several authors,20,25,31,40 describing a significant relationship between light, which generates an increased exchange gas, transpiration rates and plant EP.
In the case of irrigation, a significant EP variation is measured at the beginning and during the irrigation event, associated with an action potential (AP), our results are very similar to results published by other authors.25 However, the AP generated by an irrigation event is of a short and limited scale, when the plant is subject to a condition of mild water stress intensity and the water depth applied is not enough to reach in the soil a water content equivalent to field capacity. Evidence presented in this work suggests a direct relationship between the intensity of plant water stress and the EP measured (Fig. 4). During the afternoon hours, when AED is higher and irrigation is restricted, the reduction in xylematic potential (Fig. 4), induces a significant decrease in EP, similar to information presented elsewhere.3 The EP reduction is more intense closer to the canopy, postulating that cell membrane polarization and depolarization during photosynthesis generates a more intense electrical activity.47
Conclusions
Results presented in this paper indicate a clear and rapid mechanism of electrical signals generation and transmission in plants, positively correlated with the intensity and duration of stimuli, such as light intensity and water availability. The electrical signal is generated in a specific organ or tissue and transmitted rapidly in the form of AP or VP to other tissues or organs of the plant. The measurement of electrical potential (EP) can be used as a tool for real-time measurement of plant physiological responses, opening the possibility of using this technology as a tool for early detection of stress and for the operation of automatic high frequency irrigation systems.
Materials and Methods
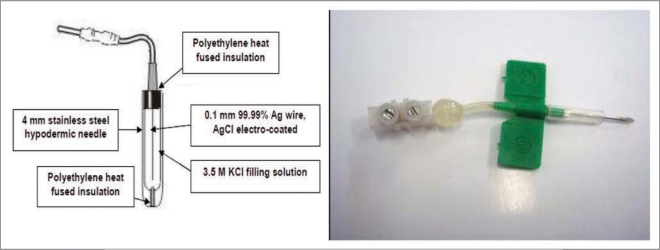
The electric potential (EP) of avocado trees is monitored continuously, using non-polarizable Ag/AgCl micro-electrodes inserted at different positions along the trunk.3,20 These electrodes (Fig. 5) include a silver wire (99.99% Ag) 0.35 mm in diameter, previously coated with AgCl by applying a voltage difference of 2.5 V in a chlorinated solution of HCl 0.1 N for 30 s, a stainless steel needle 0.5 mm in diameter, filled with a solution of 3 M KCl, in which the wire is inserted; both needle ends are heat sealed with a solid polyethylene coating.
Figure 5.
Micro-electrode is a non polarizable Ag/AgCl developed for neurophysiology studies in woody plants.
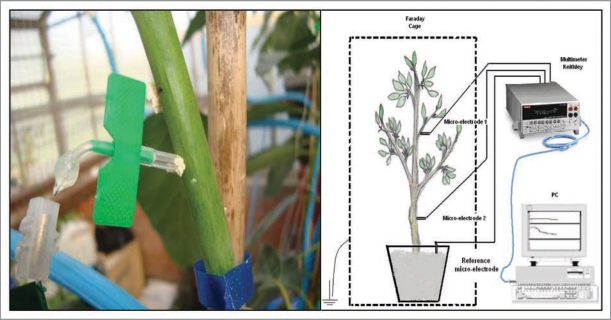
Electrodes are connected to a 20-channel multi voltmeter digital data logger Keithley Model 2701 (Keithley Instruments, Inc., Cleveland, OH), with a 20 channel Keithley switching board model 7700. The instrument can measure voltages (DC and AC) in the range of 100mV to 1000V and DC and AC currents and resistances, temperature, frequency periods (in the range of 100,000 to 1 ms) and evidence of continuity (Fig. 6). Electrical signals obtained are analyzed with ExceLINX-1, a utility software provided by Microsoft Excel©. Soil, plant and air temperature are measured by a Cu-CuNi (copper-constantan) isolated thermocouple, in the range −25–400 °C, also connected to the Keithley multi voltimeter.
Figure 6.
Experimental structures for the determination of electrical potentials in woody plants.
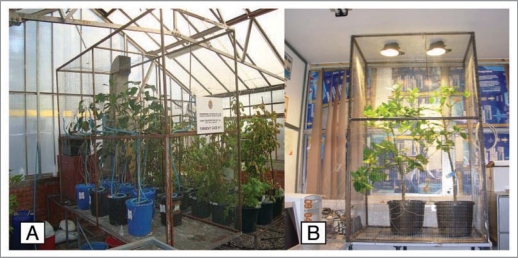
EP and temperature measurements are performed continuously, keeping the trees within two electromagnetically isolated Faraday cages (Fig. 7), one installed in a controlled environment greenhouse (A) and the other in the laboratory (B), to produce total darkness and constant light intensity conditions.
Figure 7.
Electromagnetically isolated Faraday cages (A in greenhouse; B in laboratory).
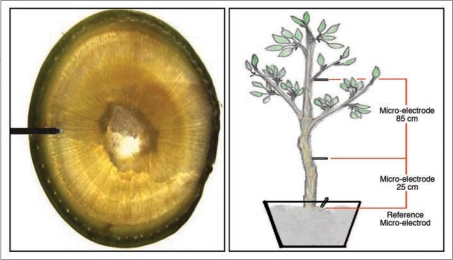
Information presented in this article relates to studies in 2 year old avocado plants (Persea americana Mill) cv. Haas, grafted on Mexicola rootstock. All trees used in these experiments present a 7.0 – 9.0 cm trunk diameter and 3 to 5 branches, each with 50–70 leaves. Each tree is grown in a 25 L pot filled with an inert sand substrate. Ag / AgCl micro electrodes are inserted directly into the trunk in contact with the phloematic tissue (Fig. 8) at 2 positions: 25 cm and 85 cm above the soil surface.
Figure 8.
Micro-electrode insertions in the trunk.
Experiment descriptions.
Experiment 1
EP measurements every 30 s in 6 trees kept under conditions of total darkness for 72 consecutive hours. The objective of this experiment is to verify the electrical behavior of plants under conditions of prolonged darkness, in order to isolate possible effects of day and night light cycles in the generation of electrical signals. This experiment is also aimed to detect possible natural variations or circadian rhythms in plant EP.
Experiment 2
EP measurements every 30 s in 7 trees under natural day and night light cycles, during 4 consecutive days, with one daily irrigation (0, 5 L/plant) at 11 AM in the first 3 days and an irrigation of 0.5 L/plant at 15:35 PM the last day. The objective of this experiment is to determine the modification of tree EP as affected by variable light conditions and by the addition of water to the soil.
Experiment 3
EP measurements every 30 s in 7 trees under natural day and night light cycles, during 8 consecutive days, including a 4-day period without irrigation. Xylematic water potential48 is measured with a Scholander (1965) pressure bomb49 at 12:30 PM, 2 leaves per tree on days 1, 5 and 8. The objective of this experiment is to relate soil water availability conditions to tree electrical behavior.
Abbreviations
- EP
electrical potential
- AP
action potential
- VP
variation potential
- ABA
Abscisic acid
- AED
atmospheric evaporative demand
Footnotes
Previously published online: www.landesbioscience.com/journals/psb/article/10157
References
- 1.Lautner S, Erhard T, Matyssek R, Fromm J. Characteristics of electrical signals in poplar and responses in photosynthesis. Plant Physiol. 2005;198:2200–2209. doi: 10.1104/pp.105.064196. [DOI] [PMC free article] [PubMed] [Google Scholar]
- 2.Brenner ED, Stahlberg R, Mancuso S, Vivanco J, Baluska F, Van Volkenburgh E. Plant neurobiology: an integrated view of plant signalling. Plant Sci. 2006;11:413–419. doi: 10.1016/j.tplants.2006.06.009. [DOI] [PubMed] [Google Scholar]
- 3.Gil PM, Gurovich L, Schaffer B, Alcayaga J, Rey S, Iturriaga R. J. Plant Physiol. 2008;165:1070–1078. doi: 10.1016/j.jplph.2007.07.014. [DOI] [PubMed] [Google Scholar]
- 4.Zimmermann MH, Maischak A, Mithöfer W, Boland H, Felle H. System potentials, a novel electrical long-distance apoplastic signal in plants, induced by wounding. Plant Physiology. 2009;149:1593–1600. doi: 10.1104/pp.108.133884. [DOI] [PMC free article] [PubMed] [Google Scholar]
- 5.Wacke M, Thiel G. Electrically triggered all-or-none liberation during action potentials in the giant alga Chara. J Gen Physiol. 2001;118:11–21. doi: 10.1085/jgp.118.1.11. [DOI] [PMC free article] [PubMed] [Google Scholar]
- 6.Volkov AG, Dunkley T, Morgan S, Ruff D, Boyce Y, Labady A. Bioelectrochemical signalling in green plants induced by photo sensory systems. Bioelectrochemistry. 2004;63:91–94. doi: 10.1016/j.bioelechem.2003.09.025. [DOI] [PubMed] [Google Scholar]
- 7.Volkov AG, Brown CL. Electrochemistry of plant life. In: Volkov G, editor. Plant Electrophysiology: Theory and Methods. New York: Springer,; pp. 437–459. [Google Scholar]
- 8.Fromm J, Lautner S. Electrical signals and their physiological significance in plants. Plant Cell Environ. 2007;30:249–257. doi: 10.1111/j.1365-3040.2006.01614.x. [DOI] [PubMed] [Google Scholar]
- 9.Davis E. New functions for electrical signals in plants. New Phytologist. 2004;161:607–610. doi: 10.1111/j.1469-8137.2003.01018.x. [DOI] [PubMed] [Google Scholar]
- 10.Gelli A, Higgins VJ, Blumwald E. Activation of Plant Plasma Membrane Ca2+-Permeable Channels by Race-Specific Fungal Elicitors. Plant Physiol. 1997;113:269–279. doi: 10.1104/pp.113.1.269. [DOI] [PMC free article] [PubMed] [Google Scholar]
- 11.Stankovic B, Zawadzki T, Davies E. Characterization of the variation potential in sunflower. Plant Physiol. 1997;1153:1083–1088. doi: 10.1104/pp.115.3.1083. [DOI] [PMC free article] [PubMed] [Google Scholar]
- 12.Mwesigwa J, Collins D, Volkov A. Electrochemical signaling in green plants: effects of 2,4-dinitrophenol on variation and action potentials in soybean. Bioelectrochemistry. 2000;51:201–205. doi: 10.1016/s0302-4598(00)00075-1. [DOI] [PubMed] [Google Scholar]
- 13.Zimmermann S, Nürnberger T, Frachisse JM, Wirtz W, Guern J, Hedrich R, et al. Receptor-mediated activation of a plant Ca2+-permeable ion channel involved in pathogen defense. Proc Natl Acad Sci USA. 1997;94:2751–2755. doi: 10.1073/pnas.94.6.2751. [DOI] [PMC free article] [PubMed] [Google Scholar]
- 14.Stankovic B, Davies E. The wound response in tomato involves rapid growth and electrical responses, systemically up-regulated transcription of proteinase inhibitor and calmodulin and down-regulated translation. Plant Cell Physiol. 1998;39:268–274. [Google Scholar]
- 15.Palmgren MG. Plant plasma membrane H+-ATPases: powerhouses for nutrient uptake. Annu Rev Plant Phys Plant Mol Biol. 2001;52:817–845. doi: 10.1146/annurev.arplant.52.1.817. [DOI] [PubMed] [Google Scholar]
- 16.Baluska F, Mancuso S, Volkmann D, Barlow P. Root apices as plant command centres: the unique ‘brainlike’ status of the root apex transition zone. Biologia (Bratisl.) 2004;59(Suppl. 13):1–13. [Google Scholar]
- 17.Volkov AG. Green plants: electrochemical interfaces. J Electroanal Chem. 2000;483:150–156. [Google Scholar]
- 18.Fisahn J, Herde O, Willmitzer L, Pena-Cortes H. Analysis of the transient increase in cytosolic Ca2+ during the action potential of higher plants with high temporal resolution: Requirement of Ca2+ transients for induction of jasmonic acid biosynthesis and PINII gene expression. Plant Cell Physiol. 2004;45:456–459. doi: 10.1093/pcp/pch054. [DOI] [PubMed] [Google Scholar]
- 19.Datta P, Palit P. Relationship between environmental factors and diurnal variation of bioelectric potentials of an intact jute plant. Curr Sci. 2004;87:680–683. [Google Scholar]
- 20.Gurovich L, Hermosilla P. Electric signalling in fruit trees in response to water applications and light-darkness conditions. J Plant Physiology. 2009;166:290–300. doi: 10.1016/j.jplph.2008.06.004. [DOI] [PubMed] [Google Scholar]
- 21.Rhodes J, Thain J, Wildon D. The pathway for systemic electrical signal conduction in the wounded tomato plant. Planta. 1996;200:50–57. [Google Scholar]
- 22.Pyatygin S, Apritov A, Vodeneev A. Signaling role of action potential in higher plants. Plant Physiology. 2008;55:285–291. [Google Scholar]
- 23.Volkov AG, Adesina T, Jovanov E. Closing of Venus flytrap by electrical stimulation of motor cells. Plant Signal Behav. 2007;2:139–144. doi: 10.4161/psb.2.3.4217. [DOI] [PMC free article] [PubMed] [Google Scholar]
- 24.Wildon DC, Thain JF, Minchin PEH, Gubb RI, Reilly JF, Skiper YD, et al. Electrical signalling and systemic proteinase inhibitor induction in the wounded plant. Nature. 1992;360:62–65. [Google Scholar]
- 25.Fromm J, Fei H. Electrical signalling and gas exchange in maize plants of drying soil. Plant Sci. 1998;132:203–213. [Google Scholar]
- 26.Grams TE, Koziolek C, Lautner S, Mayssser R, Fromm J. Distinct roles of electric and hydraulic signals on the reaction of leaf gas exchange upon reirrigation in Zea mays L. Plant Cell Enviorn. 2007;30:79–84. doi: 10.1111/j.1365-3040.2006.01607.x. [DOI] [PubMed] [Google Scholar]
- 27.Brault M, Amiar Z, Penarun AM, Monestier M, Zhang Z, Cornel D, et al. Plasma membrane depolarization induced by abscisic acid in Arabidopsis suspension cells involves reduction of proton pumping in addition to anion channel activation, which are both Ca2+ dependent. Plant Physiol. 2004;135:1–13. doi: 10.1104/pp.104.039255. [DOI] [PMC free article] [PubMed] [Google Scholar]
- 28.Schaller A, Oecking C. Modulation of plasma membrane H+-ATPase activity differentially activates wound and pathogen defence responses in tomato plants. Plant Cell. 1999;11:263–272. doi: 10.1105/tpc.11.2.263. [DOI] [PMC free article] [PubMed] [Google Scholar]
- 29.Baluska F, Volkmann D, Menzel D. Plant synapses: actin-based domains for cell-to-cell communication. Trends in Plant Sci. 2005;10:106–111. doi: 10.1016/j.tplants.2005.01.002. [DOI] [PubMed] [Google Scholar]
- 30.Dziubinska H, Filek M, Koscielniak J, Trebacz K. Variation and action potentials evoked by thermal stimuli accompany enhancement of ethylene emission in distant non-stimulated leaves of Vicia faba minor seedlings. J Plant Physiol. 2002;160:1203–1210. doi: 10.1078/0176-1617-00914. [DOI] [PubMed] [Google Scholar]
- 31.Gil PM, Gurovich L. Medición de señales eléctricas como herramienta de monitoreo de respuestas de palto (Persea americana Mill.) ante el contenido de agua en el suelo. Proc. VI World Avocado Congress. 2007 (Fre). [Google Scholar]
- 32.Hlavácková V, Krchnák P, Nauš J, Novák O, Špundová, Strnad M. Electrical and chemical signals involved in short-term systemic photosynthetic responses of tobacco plants to local burning. Planta. 2006;225:235–244. doi: 10.1007/s00425-006-0325-x. [DOI] [PubMed] [Google Scholar]
- 33.Sanderson B. Note on the electrical phenomena which accompany stimulation of leaf of Dionea muscipula. Proc R Soc. 1873;21:495–496. [Google Scholar]
- 34.Darwin C. Insectivorous plants. London: Murray,; 1875. [Google Scholar]
- 35.Bose JC. The nervous mechanism of plants. London: Longman Green,; 1926. [Google Scholar]
- 36.Stokes T. Plant neurobiology sprouts anew. The Scientist. 2005;19:24–25. [Google Scholar]
- 37.Stahlberg R. Historical overview on plant neurobiology. Plant Signal Behav. 2006;1:6–8. doi: 10.4161/psb.1.1.2278. [DOI] [PMC free article] [PubMed] [Google Scholar]
- 38.Volkov A, Ranatunga DR. Plants as Environmental Biosensors. Plant Signal Behav. 2006;1:105–115. doi: 10.4161/psb.1.3.3000. [DOI] [PMC free article] [PubMed] [Google Scholar]
- 39.Gurovich L. Real-Time Plant Water Potential Assessment Based on Electrical Signalling In Higher Plants Joint International Meeting. VII. International World Computers in Agriculture and American Society of Agricultural and Biological Engineers Annual Meeting Proceedings; June 21 – June 24; Reno, Nevada. 2009. paper No 095875. [Google Scholar]
- 40.Gibert D, Le Mouel JL, Lambs L, Nicolin F, Perrier F. Sap flow and daily electric potencial variations in tree trunk. Plant Sci. 2006;171:572–584. [Google Scholar]
- 41.Jackson MB. Long-distance signaling from roots to shoots assessed: the flooding story. J Exp Bot. 2002;53:175–181. doi: 10.1093/jexbot/53.367.175. [DOI] [PubMed] [Google Scholar]
- 42.Wensuo J, Zhang J. Stomatal movements and long-distance signaling in plants. Plant Signal Behav. 2008;3:772–777. doi: 10.4161/psb.3.10.6294. [DOI] [PMC free article] [PubMed] [Google Scholar]
- 43.Sanders D, Brownlee C, Harper J. Communicating With Calcium. Plant Cell. 1999;11:691–706. doi: 10.1105/tpc.11.4.691. [DOI] [PMC free article] [PubMed] [Google Scholar]
- 44.McClung CR. Circadian rhythms in plants. Annu Rev Plant Physiol Plant Mol Biol. 2001;52:139–162. doi: 10.1146/annurev.arplant.52.1.139. [DOI] [PubMed] [Google Scholar]
- 45.Webb A. The physiology of circadian rhythms in Plants. New Phytologist. 2003;160:281–303. doi: 10.1046/j.1469-8137.2003.00895.x. [DOI] [PubMed] [Google Scholar]
- 46.Felle H, Zimmermann M. Systemic signalling in barley through action potentials. Planta. 2007;226:203–214. doi: 10.1007/s00425-006-0458-y. [DOI] [PubMed] [Google Scholar]
- 47.Whitmarsh J. Raghavendra A.S, editor. Photosynthetic Energy Transduction. Photosynthesis: A comprehensive treatise. 2004 Cambridge University Press. [Google Scholar]
- 48.Ferreyra R, Selles G, Maldonado P, Celedón J, Gil P. Effects of environment, leaf characteristics and measuring methodology on stem water potential in avocado trees (Persea americana Mill.) Agricultura Técnica (Chile) 2007;67:182–188. [Google Scholar]
- 49.Scholander PF, Hammel HT, Bradstreet ED, Hemmingsen EA. Sap pressure en vascular plants. Science. 1965;148:339–346. doi: 10.1126/science.148.3668.339. [DOI] [PubMed] [Google Scholar]


