Abstract
Members of the G protein superfamily contain nucleotide-dependent switches that dictate the specificity of their interactions with binding partners. Using a sequence-based method termed statistical coupling analysis (SCA), we have attempted to identify the allosteric core of these proteins, the network of amino acid residues that couples the domains responsible for nucleotide binding and protein–protein interactions. One-third of the 38 residues identified by SCA were mutated in the G protein Gsα, and the interactions of guanosine 5′-3-O-(thio)triphosphate- and GDP-bound mutant proteins were tested with both adenylyl cyclase (preferential binding to GTP-Gsα) and the G protein βγ subunit complex (preferential binding to GDP-Gsα). A two-state allosteric model predicts that mutation of residues that control the equilibrium between GDP- and GTP-bound conformations of the protein will cause the ratio of affinities of these species for adenylyl cyclase and Gβγ to vary in a reciprocal fashion. Observed results were consistent with this prediction. The network of residues identified by the SCA appears to comprise a core allosteric mechanism conferring nucleotide-dependent switching; the specific features of different G protein family members are built on this core.
Guanine nucleotide-binding (G) proteins are binary switches that assume different conformations and engage in distinct molecular interactions depending on the identity of their bound nucleotide (1, 2). Associations with other proteins control nucleotide exchange (GDP→GTP; activation), hydrolysis (GTP→GDP; inactivation), and downstream signaling or other functions. For example, the GDP-bound form of the heterotrimeric G protein Gsα is maintained in the inactive state by binding to Gβγ subunits, but receptor-regulated nucleotide exchange releases Gβγ and promotes binding of Gsα-GTP to adenylyl cyclase to initiate signaling. The G protein superfamily is large and diverse. In addition to α subunits of heterotrimeric G proteins, the family includes the ras family of low-molecular-weight GTPases and the translation elongation factors. Despite this diversity, the core function of the G domain, nucleotide-dependent switching between functionally distinct states, is shared by all members of the superfamily.
What is the structural basis for the nucleotide-dependent switch? High-resolution structures of active and inactive states of several G proteins provide important clues (2). Interactions with effector molecules and some regulatory proteins occur at regions known as switches, so named because their structures change in response to nucleotide exchange. Specifically, exchange of GDP for GTP causes the switch I loop to clamp closer toward the nucleotide-binding pocket and induces the more distantly positioned switch II to transit from a disordered and weakly interacting surface loop to an ordered well packed helix. Nucleotide exchange induces these conformational changes with little or no effect at other sites, even if physically closer to the nucleotide-binding pocket. These observations argue for a distributed structural mechanism that couples the distinct functional surfaces mediating nucleotide binding and effector interactions. However, typical of many cases of long-range communication in proteins, the mechanism that links these functional surfaces is unclear from the structures.
How can we identify the residues that mediate allostery? In principle, systematic mutagenesis (e.g., double mutant cycle analysis) can expose cooperative interactions between amino acid residues in proteins. Unfortunately, practical considerations limit such studies to small regions of proteins, precluding full-scale analysis. We address this problem with a sequence-based technique termed statistical coupling analysis (SCA), a method for globally estimating coupling between residues in proteins (3, 4). The SCA method takes advantage of evolution as a vast experiment in mutation and is based on the simple proposition that functionally critical energetic coupling of a pair of residues in a protein (whether for structural or functional reasons) should impose a mutual evolutionary potential on these sites. In principle, this should be exposed quantitatively as the coevolution of these sites in a large and diverse multiple sequence alignment (MSA) of a protein family.
Materials and Methods
MSA. G protein sequences were collected from the nonredundant database by using PSI-BLAST (e-score <0.001) (5) and aligned by using CLUSTAL W (6). The alignment was then adjusted by using structure-based techniques (7) and is available at www.hhmi.swmed.edu/Labs/rr. Note that the MSA does not include the helical domain of the heterotrimeric G protein α subunits; this domain is unique to this subgroup of the G protein superfamily.
SCA. The statistical coupling matrix was assembled from the 33 site-specific perturbations that satisfy the criteria of the analysis, and calculation of coupling was carried out as described (Fig. 7, which is published as supporting information on the PNAS web site) (3, 4). The code for implementation of the algorithm and sample datasets are available on request.
Matrix Clustering. Hierarchical clustering was performed with MATLAB Ver. 6.5 (Mathworks, Natick, MA) by using the city-block distance metric and complete linkage. An initial round of clustering columns was used to eliminate the 10 perturbation experiments at highly conserved sites that consequently contain very low coupling values. The resulting matrix (171 alignment positions by 23 perturbation experiments, Fig. 1A) is used for 2D clustering (Fig. 1 B and C). Further details are provided at www.hhmi.swmed.edu/Labs/rr.
Fig. 1.
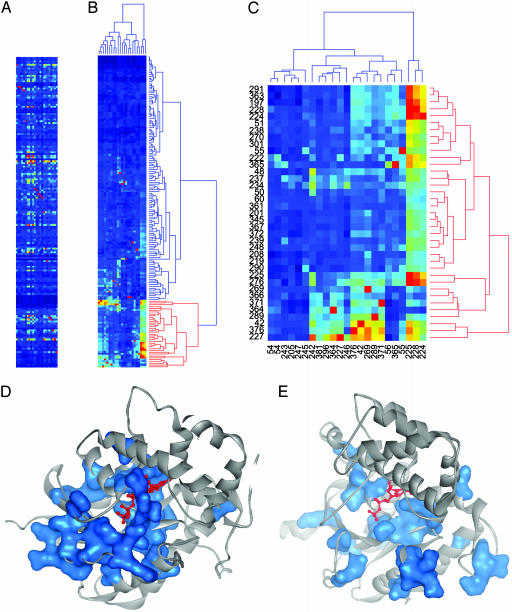
(A) SCA reveals a putative allosteric network in the G protein family. Matrix of ΔΔGstat values reporting the coevolution of many pairs of positions in an alignment of 717 members of the G protein family. Rows in the matrix represent Gsα protein positions (N- to C-terminal) from the top down, and columns represent perturbation experiments. The site of perturbation is marked as a red pixel in each column. The color scale varies linearly from blue (0 kT*) to red (2 kT*). kT* is an arbitrary energy unit (3). (B) 2D hierarchical clustering of the matrix reveals that most positions show little coupling to any perturbation, and that a single cluster of positions (marked in red) shows a similar pattern of high ΔΔGstat values. (C) Extraction and reclustering of the 38 primary positions (red cluster in B) show that these positions coevolve mutually; they show a similar pattern of coupling to perturbations and are related by perturbations within the group itself (note the clustering of the red pixels). (D and E) Mapping of the 38 primary cluster positions on the tertiary structures of GTPγS- (D) or GDP-Giα1 (E); a van der Waals surface (blue) is drawn around the cluster residues. The residues form a network linking the nucleotide-binding pocket to the switch regions through the protein core in the GTPγS structure [Protein Data Bank (PDB) ID code 1GIA], but they are fragmented in the GDP structure (PDB ID code 1GDD) (see also Movies 1–4).
Purification of Mutant Gsα Proteins. All mutants were created by using bovine Gsα(short) as a template. WT and mutant Gsα were expressed with a hexa-histidine tag at the C terminus and purified (8). Guanosine 5′-3-O-(thio)triphosphate (GTPγS) was bound to Gsα by incubation with 800 μM nucleotide in 50 mM NaHepes (pH 8)/10 mM MgSO4/1 mM EDTA/10 mM DTT at 30°C for 2.5 h. Free nucleotide was removed by gel filtration.
Adenylyl Cyclase Assay. The purified cytosolic domains of adenylyl cyclase were used to measure the apparent affinities of interaction with Gsα proteins. H6-VC1(591)FLAG and IIC2-H6 proteins were purified and assayed as described (9, 10). Each assay contained 1 nM IIC2 protein and 10 μM VC1. Assays of GDP-bound Gsα contained 50 μM free GDP. All specific activities are reported with respect to the concentration of IIC2. Data were fit to a one-site-binding model by using a nonlinear least-squares method in ORIGIN (Microcal, Northampton, MA). The activity of each mutant was measured two or three times and that of the WT protein 26 times. The mean and range of the EC50s were calculated for GTPγS- and GDP-bound Gsα proteins. Ratios of EC50 values for GDP- and GTPγS-bound proteins were calculated with propagation of errors. Each ratio was tested for significant deviation from the WT value by using Student's t test, and the significance is reported as a P value (Tables 1 and 2, which are published as supporting information on the PNAS web site).
The Affinity of Gsα for Gβγ. A fluorescence resonance energy transfer (FRET) assay was developed to detect interaction between Giα1-enhanced cyan fluorescent protein (ECFP) and Gβ1γ2-enhanced yellow fluorescent protein (EYFP) chimeric fusion proteins. The disappearance of FRET was used to monitor competition between Gsα and Giα1-ECFP for binding Gβ1γ2-EYFP. Unmyristoylated H6-Giα1-ECFP was used to lower affinity for Gβγ. Briefly, increasing concentrations of Gsα-GDP or Gsα-GTP were added to H6-Giα1-ECFP and Gβ1γ2-EYFP (200 nM each) in 50 mM NaHepes (pH 8)/1 mM EDTA/5 mM DTT/100 mM NaCl/2 mM MgSO4/0.1% Lubrol (C12E10)/200 μM GDP and incubated at 18°C for 16 h. Samples were excited at 410 nm, and emission was recorded from 461 to 535 nm. The ratio of the fluorescence intensity at 522 nm to that at 474 nm was plotted vs. the concentration of Gsα and fit to the following equation by using a nonlinear least-squares method in Microcal ORIGIN: y = (Bmax(IC50/[Gsα]))/(1+(IC50/[Gsα]) + y0, where y0 is the offset of the lower asymptote, and Bmax is the upper asymptote. The apparent affinity of each mutant Gsα protein for Gβγ was measured twice; the value for the WT protein was determined 10 times. Data were then processed as described above for adenylyl cyclase.
Synthesis and Purification of H6-Giα1-ECFP and β1γ2-EYFP. Nucleotides encoding ECFP were inserted into the helical domain of rat Giα1 between A121 and E122. H6-Giα1-ECFP was expressed and purified as described for H6-Giα1 (8). EYFP was fused to the N terminus of rat Gβ1. Gβ1-EYFP was coexpressed in Sf9 insect cells with rat Gγ2 and Giα1-H6, and the Gβ1γ2-EYFP complex was purified (11). Protein concentrations were determined by absorbance by using extinction coefficients of 26,000 M-1·cm-1 at 430 nm for ECFP and 84,000 M-1·cm-1 at 514 nm for EYFP (12).
Results and Discussion
In SCA, coevolution of sites is measured by carrying out a statistical perturbation experiment (Fig. 7), where a change is introduced to the frequency of an amino acid residue at a test site i in the MSA, and the impact of this perturbation for amino acid x at another site j is measured as an energy-like statistical parameter,  . Calculated for all sites j, the set of
  values produces a complete map of how the perturbation at i is felt by all other sites. In essence, this is an evolution-based prediction of the global pattern of thermodynamic coupling for test site i over all other positions. As described (4), this analysis is subject to several constraints on the size and diversity of the MSA and on the test sites. These constraints are met by an alignment of 717 members of the G protein superfamily (Fig. 8, which is published as supporting information on the PNAS web site).
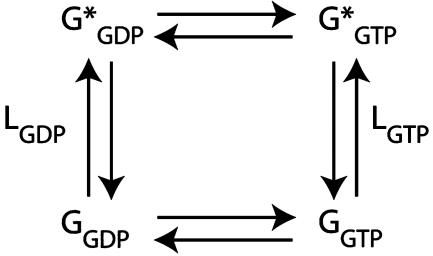
Fig. 1 A shows the complete SCA for the G protein family as a matrix of ΔΔGstat values, where positions (N to C terminus) on the MSA are rows (top to bottom), and the perturbation experiments are columns. Thus, one column represents the statistical coupling for perturbation at one test site (marked in red) over all other sites, and the matrix as a whole is a global representation of evolutionary coupling between many pairs of residues. What pattern of coevolution do we expect for residues involved in the G protein allosteric mechanism? Strong evidence from Geyer et al. (13) indicates that allosteric coupling in G proteins is described by a two-state equilibrium between an inactive state (G, normally stabilized by GDP) and an activated state (G*, normally stabilized by GTP) (Fig. 2). Mechanistically, the model implies that residues participating in the two-state allosteric mechanism should comprise a cooperative unit making a concerted conformational change between the inactive and active states of the protein. In terms of evolution, we hypothesize that this cooperativity forces mutual coevolution of the constituent sites. Such a network should emerge as a cluster of residues displaying a similar and interconnected pattern of significant ΔΔGstat values.
Fig. 2.
A two-state allosteric model for G protein function. The G protein exists in two conformations: an inactive G state (normally stabilized by GDP) and an active G* state (normally stabilized by GTP). In Gsα, the G state binds Gβγ and the G* state binds adenylyl cyclase. LGDP and LGTP are the equilibrium constants defining the ratio of G* to G in the GDP- and GTP-bound states, respectively.
To test this prediction, we carried out 2D hierarchical clustering of the SCA matrix (Fig. 1 B and C). Much like the process of identifying clusters of coexpressed genes in a collection of microarray experiments, 2D clustering of the SCA matrix seeks to identify clusters of residues showing similar profiles of evolutionary coupling in many independent statistical perturbation experiments. The cluster analysis of the G protein family SCA matrix demonstrates three important properties. First, there is a remarkably sparse architecture for interresidue interactions. Most sites (even some that are well conserved; see Fig. 7) act as if evolutionarily independent (rows with all blue cells). Second, a small subset of residues (38; 20% of the total) emerges as the sole significant cluster, sharing a similar pattern of significant ΔΔGstat values (Fig. 1 B and C). Finally, the residues that comprise the main cluster show mutual coupling, such that perturbation experiments at sites within the cluster redundantly identify other residues within the cluster. To illustrate this property, the sites of perturbation are marked in bright red in the SCA matrix; note that many red pixels are contained within the main cluster of residues (Fig. 1 B and C). These data are consistent with the hypothesis that the G protein family contains a small set of residues that act as a single coevolving unit.
Mapping the 38 clustered residues on the structure of a G protein α subunit (Giα1-GTP) shows that the residues comprise a network of van der Waals interactions that links residues surrounding the nucleotide-binding pocket with those at the effector-binding sites on the switch regions (Fig. 1D). The connection between the functional surfaces is made up of a pathway of core contacts (see Movies 1–4, which are published as supporting information on the PNAS web site). The physical connectivity of this network is striking, given that it comprises only 20% of the total residues in the G domain, and no tertiary structural data were used to identify these positions. When the clustered residues are mapped onto the structure of Giα1-GDP (Fig. 1E), we see that the connectivity of the network is nucleotide-dependent, connected in the active GTP-bound state but broken in the inactive GDP-bound state. The nucleotide-dependent physical connectivity of the network supports the hypothesis that these residues comprise at least part of the G protein switch.
To test these predictions, we carried out site-directed mutagenesis of Gsα. The allosteric model (Fig. 2; see also Supporting Text, which is published as supporting information on the PNAS web site) allows specific predictions of the phenotypes expected from mutations within the protein's allosteric core. There are two major features of this model. First, the activated G* state binds adenylyl cyclase, and the basal G state binds Gβγ; these interactions occur at an overlapping surface of Gsα and are thus mutually exclusive. Second, the equilibrium between G and G* is given by the allosteric constants in the GDP- (LGDP) and GTP- (LGTP) bound states, and the essence of nucleotide-dependent switching is in the ratio of these two equilibrium constants. For example, LGDP must be <1 (GDP binding stabilizes the G state), and LGTP must be >1 (GTP stabilizes the G* state) (Fig. 9, which is published as supporting information on the PNAS web site). We hypothesize that mutation of residues in the allosteric core of Gsα will perturb the allosteric constants, causing a change of the equilibrium between G and G*. Thus, if a mutation locks the protein in the G* state, it should bind adenylyl cyclase equally well when associated with either GTP or GDP. Similarly, proteins locked in the G state should interact with βγ without regard to the identity of the bound nucleotide. Because we expect the same allosteric mechanism to underlie both LGDP and LGTP, we also predict that mutations that perturb this mechanism will affect these two equilibrium constants similarly. At the limit, where the effect of a mutation on LGDP and LGTP is equal, the model makes the strong prediction that the mutation will cause the ratio of affinities of Gsα-GTP and Gsα-GDP for adenylyl cyclase on the one hand and for Gβγ on the other to vary in a strictly reciprocal fashion (see Supporting Text). Note that this model makes no claim about the effect of such mutations on the absolute affinities of Gsα for adenylyl cyclase or Gβγ. Indeed, mutations that do not influence the allosteric core but rather directly alter the binding energy of Gsα for adenylyl cyclase or Gβγ should cause isolated effects on the binding of Gsα to one partner with little effect on the interaction with the other. In addition, mutations that affect the allosteric core could also have an independent direct effect on the affinity of Gsα for either adenylyl cyclase or Gβγ.
Thirteen sites predicted by SCA and six control (nonpredicted) residues of Gsα were mutated to alanine, with two exceptions: A48 was changed to H (the next most conserved residue at this position of the MSA), and W234 was changed to F (because of poor expression of the A mutant). The residues chosen as nonstatistically coupled controls are located immediately adjacent to statistically coupled residues of the protein (Fig. 1 D and E) and thus are stringent tests of our hypothesis. WT Gsα and the 19 mutant proteins were evaluated for their affinity for adenylyl cyclase and Gβγ as either GTPγS- or GDP-bound species.
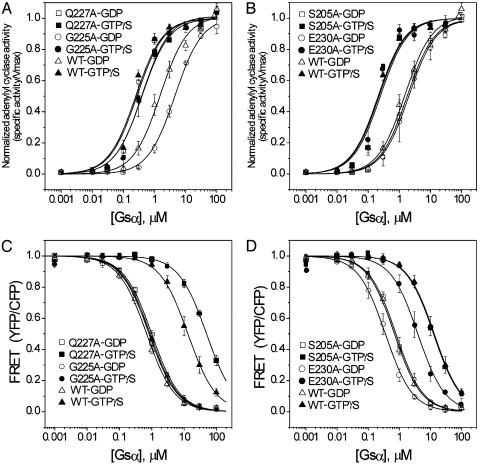
Data for mutations at coupled residues Q227 and G225 (Fig. 3 A and C) and control residues S205 and E230 (Fig. 3 B and D) are shown as representative of the complete data set. Because mutation of Q227 is known to inhibit the GTPase activity of Gsα, the identity of the nucleotide bound to this protein was confirmed by HPLC (data not shown) (14–16). There was no difference in the apparent affinity of GTPγS- and GDP-bound Q227AGsα for adenylyl cyclase; the ratio of these affinities for WT Gsα is 5.7. In contrast, the affinity of GDP-bound Q227AGsα for Gβγ was 50-fold higher than that of the GTPγS-bound protein; this ratio is 19 for the WT protein. Thus, this mutation eliminated the effect of nucleotide identity insofar as interactions with adenylyl cyclase are concerned but enhanced this effect with regard to Gβγ binding. This result is exactly consistent with the notion that this mutation stabilizes the G* state by increasing both LGDP and LGTP. The behavior of the G225A mutant protein is precisely opposite. The GTPγS-bound protein has an 11-fold greater affinity for adenylyl cyclase than does the GDP-bound protein, whereas these species have equal affinity for Gβγ. This mutant is locked in the G state in a manner consistent with shifting both LGDP and LGTP to lower values. Interestingly, the equal affinity of GDP- and GTPγS-G225AGsα for Gβγ offers an explanation for the previous finding that this mutant protein behaves in a dominant-negative fashion, inhibiting the capacity of hormones to stimulate cAMP synthesis in cells containing WT Gsα (17). G225AGsα should not release Gβγ after receptor-catalyzed nucleotide exchange and thus would likely sequester receptor in a complex with the heterotrimeric G protein. Alternatively, sufficient overexpression of such a mutant would sequester cellular Gβγ.
Fig. 3.
Interactions of WT and representative mutant Gsα proteins with adenylyl cyclase and Gβγ. (A and B) Data for adenylyl cyclase. (C and D) Data for Gβγ. (A and C) Gsα mutants identified by SCA, Q227A, and G225A. (B and D) Control mutants S205A and E230A. Interactions were assessed with either GTPγS- or GDP-bound WT and mutant Gsα proteins. Data for mutant proteins are the mean and range of two experiments, each performed in duplicate. Data for WT Gsα are the mean and SD of 26 (adenylyl cyclase) or 10 experiments (Gβγ).
The ratio of affinities of the GTPγS- and GDP-bound control proteins shown in Fig. 3 for adenylyl cyclase and Gβγ are very similar to those for the WT protein. GTPγS-bound E230AGsα interacts with adenylyl cyclase with 10-fold greater affinity than does the GDP-bound form, but the ratio of affinities for interaction with Gβγ does not differ significantly from the WT value. This finding is consistent with a modest and isolated effect of this mutation on interaction with adenylyl cyclase. However, the lack of any reciprocal change in affinities for Gβγ argues against a role in the mechanism of the allosteric switch. No significant changes in ratios were observed with S205AGsα. Data for all mutants are summarized in Tables 1 and 2.
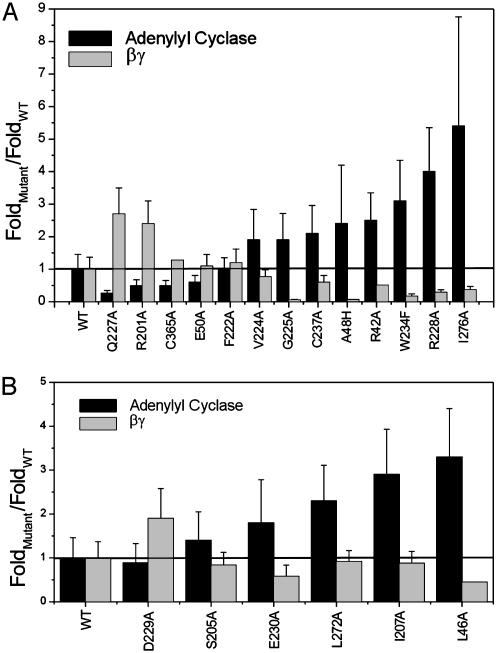
To compare all of the mutants, we calculated the ratio of affinities for the GTPγS and GDP states of each mutant Gsα for both adenylyl cyclase and Gβγ. These ratios, normalized for the respective ratios in WT Gsα, are shown in Fig. 4. In this representation, a value >1 indicates increased nucleotide sensitivity relative to the WT protein, a greater separation of affinities between the GDP- and GTPγS-bound states. Similarly, a value <1 indicates decreased nucleotide sensitivity relative to WT. The mutations are arranged in order of increasing nucleotide sensitivity for adenylyl cyclase, with residues predicted by SCA in Fig. 4A and control residues in Fig. 4B.
Fig. 4.
Ratios of affinities of GTPγS- and GDP-bound mutant Gsα proteins for adenylyl cyclase (GDP/GTPγS; black bars) and the reciprocal ratio for Gβγ (GTPγS/GDP; gray bars). Values were normalized by dividing each ratio by the corresponding ratio for WT Gsα. (A) Residues identified by the SCA. (B) Control residues. Mutant proteins are arranged in order of increasing nucleotide sensitivity for adenylyl cyclase.
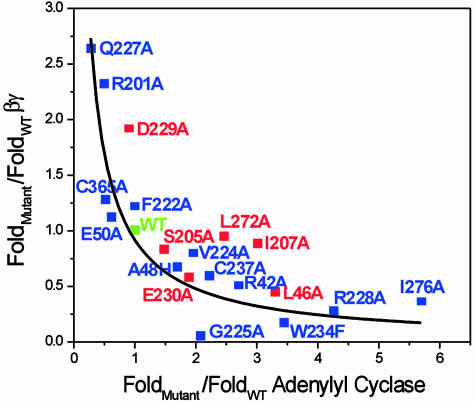
Fig. 5 provides an overall summary by plotting the nucleotide sensitivity for adenylyl cyclase vs. that for Gβγ. Fitting of these data to the inverse relationship (y = 1/x) demonstrates that the full set of mutations at sites predicted by SCA are consistent (r = 0.85) with a reciprocal relationship of the nucleotide sensitivities for the two binding partners. These results support the hypothesis that mutations of these sites cause varying degrees of perturbation to the allosteric mechanism controlling the equilibrium between G and G*.
Fig. 5.
The values for all mutant Gsα proteins from Fig. 4 were used to plot nucleotide sensitivity for interaction with Gβγ vs. nucleotide sensitivity for interaction with adenylyl cyclase. Residues identified by the SCA have blue squares and are fit to a rectangular hyperbola (solid line, y = 1/x; r = 0.85); control residues are red squares and deviate from this relationship.
Mutations at control sites generally show deviations from the reciprocal relationship (r = 0.42). Some of these mutations caused significant changes in the nucleotide sensitivity of the interaction of Gsα with one partner, but five of six control mutations failed to show any significant reciprocal change for the other partner; L46A is the exception. This result is particularly significant given that all control residues are direct packing neighbors of the network of coevolving residues identified by SCA. In addition, comparison of the structure of GDP- and GTP-bound Gα shows that some of these control residues also display nucleotide-dependent conformational changes similar to those made by residues identified by SCA. We infer that motion of residues, per se, is not a sufficient criterion for their inclusion in the allosteric core. The origin of the reciprocal effect of L46A is unknown but may not be surprising given that this mutation creates a cavity in the core of Gsα at a site that packs against many network residues. In summary, we conclude that residues identified by SCA specifically participate in the mechanism of G protein allostery.
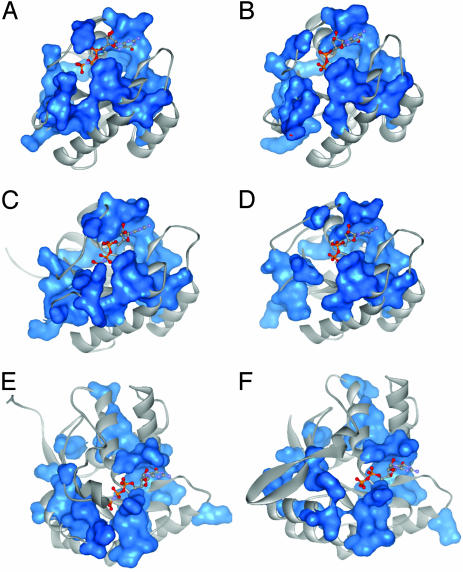
SCA depends on a wholesale study of the long-term evolutionary record of a protein family. Thus, the network of coevolving residues may be a canonical structural feature shared by all members the G protein family. If so, we might expect that the core structural features of the network, the nucleotide-dependent physical connectivity, to be fundamentally conserved in distantly related family members. Figs. 6 and 1 D and E show a series of structures of inactive (GDP-bound) and active [GTPγS- or Gpp(NH)p-bound] members of four distinct G protein subfamilies (see Movies 1–4). The network connectivity is intact and similar to that of Giα1 in all of the active-state structures, but it is broken and disorganized in all of the inactive state structures. These similarities of the SCA network occur despite substantial divergence of other structural features and the very different functions of these G proteins. Previous studies have pointed out the plasticity of the switch regions in the G protein family in accommodating a wide variety of interacting partners (2, 18, 19). We suggest that the network of residues identified by SCA comprises a core allosteric mechanism conferring nucleotide-dependent switching and that the specific features of different G protein family members are built on this core.
Fig. 6.
Mapping of the SCA-derived amino acid network on the active and inactive states of three distant members of the G protein family. GTPγS- [or Gpp(NH)p-] bound structures (A, C, and E) and GDP-bound structures (B, D, and F) of H-ras (A and B), Ypt7p (C and D), and EfTu (E and F) are shown. PDB ID codes: 5P21 (A), 4Q21 (B), 1KY2 (C), 1KY3 (D), 1EFT (E), and 1TUI (F).
Supplementary Material
Acknowledgments
We thank Mark Wall and Andrejs Krumins for insightful discussions and Michelle Jennings for technical assistance. This work was funded by grants from the National Institutes of Health (GM34497 to A.G.G.), the Robert A. Welch Foundation (to R.R.), and the Edward Mallinckrodt Foundation (to R.R.). R.R. is an Associate Investigator of the Howard Hughes Medical Institute.
Abbreviations: ECFP, enhanced cyan fluorescent protein; EYFP, enhanced yellow fluorescent protein; G*, activated state of G protein stabilized by GTP; G, basal state of G protein stabilized by GDP; GTPγS, guanosine 5′-3-O-(thio)triphosphate; LGDP, equilibrium constant between G and G* in GDP-bound state; LGTP, equilibrium constant between G and G* in GTP-bound state; MSA, multiple sequence alignment; SCA, statistical coupling analysis.
References
- 1.Gilman, A. G. (1987) Annu. Rev. Biochem. 56, 615-649. [DOI] [PubMed] [Google Scholar]
- 2.Sprang, S. R. (1997) Annu. Rev. Biochem. 66, 639-678. [DOI] [PubMed] [Google Scholar]
- 3.Lockless, S. W. & Ranganathan, R. (1999) Science 286, 295-299. [DOI] [PubMed] [Google Scholar]
- 4.Suel, G. M., Lockless, S. W., Wall, M. A. & Ranganathan, R. (2003) Nat. Struct. Biol. 10, 59-69. [DOI] [PubMed] [Google Scholar]
- 5.Altschul, S. F., Madden, T. L., Schaffer, A. A., Zhang, J., Zhang, Z., Miller, W. & Lipman, D. J. (1997) Nucleic Acids Res. 25, 3389-3402. [DOI] [PMC free article] [PubMed] [Google Scholar]
- 6.Thompson, J. D., Higgins, D. G. & Gibson, T. J. (1994) Nucleic Acids Res. 22, 4673-4680. [DOI] [PMC free article] [PubMed] [Google Scholar]
- 7.Doolittle, R. F., Abelson, J. N. & Simon, M. I. (1996) Methods Enzymol. 266, 3-680.8743674 [Google Scholar]
- 8.Lee, E., Linder, M. E. & Gilman, A. G. (1994) Methods Enzymol. 237, 146-164. [DOI] [PubMed] [Google Scholar]
- 9.Hatley, M. E., Gilman, A. G. & Sunahara, R. K. (2002) Methods Enzymol. 345, 127-140. [DOI] [PubMed] [Google Scholar]
- 10.Smigel, M. D. (1986) J. Biol. Chem. 261, 1976-1982. [PubMed] [Google Scholar]
- 11.Kozasa, T. & Gilman, A. G. (1995) J. Biol. Chem. 270, 1734-1741. [DOI] [PubMed] [Google Scholar]
- 12.Patterson, G., Day, R. N. & Piston, D. (2001) J. Cell Sci. 114, 837-838. [DOI] [PubMed] [Google Scholar]
- 13.Geyer, M., Schweins, T., Herrmann, C., Prisner, T., Wittinghofer, A. & Kalbitzer, H. R. (1996) Biochemistry 35, 10308-10320. [DOI] [PubMed] [Google Scholar]
- 14.Graziano, M. P. & Gilman, A. G. (1989) J. Biol. Chem. 264, 15475-15482. [PubMed] [Google Scholar]
- 15.Masters, S. B., Miller, R. T., Chi, M.-H., Chang, F.-H., Beiderman, B., Lopez, N. G. & Bourne, H. R. (1989) J. Biol. Chem. 264, 15467-15474. [PubMed] [Google Scholar]
- 16.Freissmuth, M. & Gilman, A. G. (1989) J. Biol. Chem. 264, 21907-21914. [PubMed] [Google Scholar]
- 17.Osawa, S. & Johnson, G. L. (1991) J. Biol. Chem. 266, 4673-4676. [PubMed] [Google Scholar]
- 18.Tesmer, J. J. G., Sunahara, R. K., Gilman, A. G. & Sprang, S. R. (1997) Science 278, 1907-1916. [DOI] [PubMed] [Google Scholar]
- 19.Slep, K. C., Kercher, M. A., He, W., Cowan, C. W., Wensel, T. G. & Sigler, P. B. (2001) Nature 409, 1071-1077. [DOI] [PubMed] [Google Scholar]
Associated Data
This section collects any data citations, data availability statements, or supplementary materials included in this article.


