

Abstract
The Wistar–Kyoto (WKY) rat is stress sensitive and exhibits depressive-like behavior. The locus coeruleus (LC)–norepinephrine and dorsal raphe (DR)–serotonin systems mediate certain aspects of the stress response and have been implicated in depression. Microarray technology was used to identify gene expression differences in the LC and DR between WKY vs Sprague–Dawley (SD) rats that might account for the WKY phenotype. RNA was isolated from microdissected LC and DR, amplified, and hybridized to microarrays (1 array/subject, n = 4/group). Significance of microarray (SAM) analysis revealed increased expression of 66 genes in the LC and 19 genes in the DR and decreased expression of 33 genes in the DR of WKY rats. Hierarchical clustering identified differences in gene expression profiles of WKY vs SD rats that generally concurred with SAM. Notably, genes that encoded for enzymes involved in norepinephrine turnover, amino-acid receptors, and certain G-protein-coupled receptors were elevated in the LC of WKY rats. The DR of WKY rats showed decreased expression of genes encoding several potassium channels and neurofilament genes. The chromosomal locations of 15 genes that were differentially expressed in WKY rats were near loci identified as contributing to depressive-like behaviors in the rat. The specific genes revealed by the present analysis as being differentially expressed in WKY rats may contribute to their unique behavioral profile and suggest targets that confer susceptibility to stress-related psychiatric disorders.
Keywords: locus coeruleus, dorsal raphe, microarray, gene expression, norepinephrine, serotonin
INTRODUCTION
The coordinated behavioral, endocrine, and autonomic responses to a stressor are adaptive and integral to survival. However, chronic or repeated engagement of these adaptive responses incurs an allostatic load that is expressed as an increased risk for pathology (McEwen and Stellar, 1993; McEwen, 1998). This is exemplified in the diverse pathology that has been linked to stress, including cardiovascular disease, diabetes, gastrointestinal disorders, and several psychiatric disorders (Chrousos and Gold, 1992; Chrousos, 2000). Attenuation of the stress response has been considered a partial therapeutic approach for many of these disorders, underscoring the important role of stress in pathology. It is well recognized that there is substantial individual variability in the acute response to a stressor and that this likely translates to individual variability in vulnerability to stress-related disorders. Thus, for individuals exposed to the same stressor, pathology may develop in only a certain population, the `stress-sensitive' phenotype. By understanding the basis for individual variability to stress, the pathological consequences of stress may be better modified.
The adult response to stress is determined by both genetic and epigenetic factors that impact on brain development. One approach toward identifying genetic factors that play a role in stress sensitivity is to compare gene expression between animal strains that exhibit a `stress-sensitive' phenotype and those that do not. The Wistar–Kyoto (WKY) rat strain exhibits a behavioral, endocrine, and autonomic stress-sensitive profile. For example, this phenotype is characterized by elevated adrenocorticotropin (ACTH) in response to stress and resistance to glucocorticoid feedback (Redei et al, 1994; Rittenhouse et al, 2002). Additionally, WKY rats are more prone to develop restraint-induced ulcer (Pare and Schimmel, 1986; Pare, 1989b), suggesting that autonomic responses to stress are elevated, in addition to endocrine responses. Finally, in a number of behavioral procedures, WKY rats show a propensity toward passive coping behavior (Pare, 1992a, 1993, 1994). These include a lack of exploration in open field, immobility in swim test, fast acquisition of learned helplessness, and immobility in the defensive burying model. In general, the strain characteristically adopts passive coping strategies in many situations that have been suggested to model stress-related depression.
Two neurotransmitter systems that have been implicated in the WKY phenotype, as well as in stress and the pathophysiology of depression, are the locus coeruleus (LC)–norepinephrine (NE) system and the dorsal raphe (DR)–serotonin system (Tejani-Butt et al, 1994; Pare and Tejani-Butt, 1996; Conti et al, 1997; Zafar et al, 1997; Pollier et al, 2000; Sands et al, 2000; Pardon et al, 2002, 2003; Ma and Morilak, 2004). Differences in gene expression in LC or DR neurons could underlie differential responses of these systems to stress and account for the stress-sensitive phenotype of the WKY strain. Microarrays provide a powerful tool for analysis of gene expression between two different samples and have been used previously to investigate strain differences in gene expression (Farook et al, 2001; Wang et al, 2003). Therefore, the present study used microarray technology to examine strain differences in gene expression in the LC and DR of the stress-sensitive, WKY rat vs Sprague–Dawley (SD) outbred control rat.
MATERIALS AND METHODS
Animals
Adult male WKY and SD rats weighing 200–225 g (Taconic Farms, Germantown, NY) were used in all experiments. Animals arrived at least 7 days before experimental use and were housed (three in each cage) in the animal facility under standard laboratory conditions with a 12 h light/dark cycle. Animals had free access to food and water. Care and use of animals was approved by the Children's Hospital of Philadelphia (CHOP) IACUC and was in accordance with the NIH Guide for the Care and Use of Laboratory Animals.
Isolation, Amplification, and Labeling of RNA
Rats were decapitated, brains removed and placed in a brain block from which slices (2 mm) containing the LC and DR were cut and tissue containing each region was microdissected using a trephine. Tissue was immediately placed in RNAlater (Ambion Inc., Austin, TX, USA) and stored at −80°C until used. Total RNA was extracted using RNeasy Mini Columns and RNase-Free DNase Set (Qiagen, Valencia, CA, USA). RNA integrity and quantification was determined using Agilent's Lab-on-a-Chip total RNA nano biosizing assay (Agilent Technologies, Palo Alto, CA, USA) by the Nucleic Acid and Protein Core (NAPCORE) facility at the Stokes Research Institute at CHOP. The amount of RNA extracted from samples was between 100 and 200 ng.
RNA (50 ng) from each sample was subjected to two rounds of amplification as per the Two-Cycle Target Labeling protocol in the GeneChip Expression Analysis Technical Manual (Affymetrix, Santa Clara, CA, USA). Two rounds of amplification yielded approximately 50–100 μg RNA per sample. Briefly, extracted RNA was reverse transcribed to single-stranded cDNA using an oligo-d(T) primer linked to a T7 RNA polymerase promoter (Affymetrix). Second strand cDNA was synthesized using Escherichia coli DNA polymerase I (New England Biolabs, Ipswich, MA, USA) and RNase H (Amersham Biosciences Corp., Piscataway, NJ, USA). The first round of amplification was performed by in vitro transcription using the MegaScript Kit (Ambion Inc.). A second round of amplification was performed in the same manner except that during the in vitro transcription phase, the cDNA was converted to cRNA and biotinylated using the GeneChip Expression 3′-Amplification Reagents for IVT Labeling (Affymetrix). Biotin-labeled, fragmented cRNA (5.0 μg) was hybridized to each Rat Neurobiology U34 GeneChip Array (Affymetrix) and scanned for visualization by the NAPCORE facility at CHOP. Each array consisted of 1323 genes. RNA from a single sample was sufficient to hybridize to one microarray. Each array represented tissue from an individual subject, and tissue from subjects of different groups were processed in parallel under identical conditions.
Analysis of Microarray Data
Initial processing of raw fluorescent data was performed using the GeneChip Operating System (GCOS) v1.2 in the NAPCORE facility at CHOP. Genes that were designated as absent as per the GCOS were discarded from further analysis. Raw data in the form of CEL files were imported into the `affy program' (http://www.bioconductor.org) and normalized as per the robust multiarray analysis (RMA) (Irizarry et al, 2003). To verify the probe gene product, Affymetrix probe identification numbers were imported into the Probe ID & Reliability database on the Brainarray website from the University of Michigan (http://brainarray.mhri.med.umich.edu/brainarray/). Normalized data were imported in the significance of microarrays (SAM) program (Tusher et al, 2001) and a false discovery rate of 5.0% was used to determine statistical significance between strains. Hierarchical cluster analysis was performed on all genes that were designated as present using Cluster and Treeview (http://rana.lbl.gov/EisenSoftware.htm) (Eisen et al, 1998) to visualize gene expression patterns. Genes were then classified according to biological process using Netaffx (Affymetrix) and the Rat Genome Database (http://www.affymetrix.com/analysis/netaffx/index.affx and http://rgd.mcw.edu/). The Netaffx Gene Ontology Mining Tool was used to statistically determine whether a particular functional category was over- or under-represented in experimental groups.
Real-Time Polymerase Chain Reaction
Quantitative real-time polymerase chain reaction (RT-PCR) was performed on selected genes using RNA from animals other than those used for microarray analysis. Tissue was not pooled from multiple subjects, but rather each determination represented tissue from an individual subject. Gene-specific primers were designed using Primer Express software (Applied Biosystems, Foster City, CA, USA). RNA was extracted and integrity and quantification were determined as stated above. Extracted RNA was reverse transcribed to single-stranded cDNA using an oligo-d(T) primer linked to a T7 RNA polymerase promoter. The single-stranded cDNA was added to the gene-specific primer mix and SYBR® GREEN PCR Master Mix (Applied Biosystems). Gene-specific primers were as follows: Gabrb1: 5′-CGGAAAAGGCCCTCAGAAA (sense) and 5′-GCATCAACCTGGACTTTGTTCA (antisense); Gapdh: 5′-GGCCTACATGGCCTCCAA (sense) and 5′-GCCTCTCTCTTGCTCTCAGTATCC (antisense); Knca1: 5′-GCAATCAAAAGCCCCCAAAC (sense) and 5′-CCACCCCC CAAATTCACAA (antisense); Opkr1: 5′-GCACATGTCCT GGCAACAATAC (sense) and 5′-GATGGAGGTGCAGTA AATCGA (antisense); Slc18a3: 5′-CACCAGTCCTTCTTCT TTTGCG (sense) and 5′-GCGGTTCATCAAGCAACACA (antisense); Sst: 5′-AAGCTGGCTGCAAGAACTTCT (sense) and 5′-AGAGGTCTGGCTGAGACAACAA (antisense). PCR reactions were performed on the Applied Biosystems 7000 system in the Real Time Core Facility at the Stokes Research Institute. PCR was run in triplicate for each gene and the amplified transcripts were visualized and analyzed using the ABI Prism 7000 SDS software. Relative changes in gene expression between strains were determined using the 2−ΔΔCT method as described in the Applied Biosystems User Bulletin No. 2 (P/N 4303859). Briefly, the average CT (cycle threshold) value for a particular gene (CTX) and for the housekeeping gene (CT GAPDH) was determined from all samples from the same strain. A ΔCT(CTX–CT GAPDH for WKY or SD) value was obtained by subtraction. The standard deviation of the difference is calculated from the standard deviations of the averages of the values of the two genes. The values from each strain were normalized with respect to SD using the ΔΔCT calculation, which subtracts ΔCT of the SD group from the ΔCT of each strain, making the ΔΔCT for SD = 0. The SD value is normalized to 1 using the 2−ΔΔCT calculation and WKY values are expressed relative to this. Statistical significance was determined by Student's t-test.
RESULTS
Reproducibility of Gene Expression Profiling of Brain Nuclei
Gene expression profiles were determined in two different microdissected brain nuclei, the LC and DR, from eight different rats, four SD (control) and four WKY (stress sensitive). Because one SD/DR sample could not be processed, there were only three samples in that group. Of 1323 genes analyzed, the number of genes identified as present in LC and DR were 326 and 341, respectively. To quantify the reproducibility of the microdissection technique, RNA extraction, double-amplification and labeling, and microarray hybridizations, the genes expressed from each array from the same region and strain were compared by calculating Pearson's linear correlation coefficient. Calculations were performed on data after normalization by RMA as described in Materials and methods. Pearson's coefficient ranged from 0.89 to 0.99, with a mean value of 0.97, suggesting that the processing of the microdissections of the LC and DR yielded reproducible gene expression profiles.
Expression of Signature Genes for LC and DR is Consistent with Known Expression Profiles
To further validate the microarray data, expression of signature genes for LC and DR were examined. Hierarchical clustering analysis was used to construct a dendrogram or cluster tree, noting similarity in expression patterns (Figure 1). Included in the cluster dominated by genes that are highly expressed in the DR, noting regional specificity, are the genes encoding the serotonin transporter (Slc6a4) and 5-hydroxytryptamine (serotonin) receptor 5B (Htr5b). Interestingly, serotonin receptor 5B mRNA was selectively detected in DR. Serotonin transporter was detected in LC in addition to DR, yet at expression levels six-fold less than that observed in DR. Consistent with the abundance of GABA neurons in the DR (Magoul et al, 1987; Wang and Nakai, 1993; Stamp and Semba, 1995), the gene that encodes for glutamate decarboxylase 1 (Gad1), the enzyme involved in GABA synthesis, was included in the cluster of genes that are highly expressed in the DR. Regardless of strain, tyrosine hydroxylase (Th) mRNA expression was four times greater in LC than DR, yet clustered in the group that included genes highly expressed in WKY LC. Additionally, genes encoding for two neuropeptides that are known to be colocalized with NE in LC neurons, galanin and neuropep-tide Y (Bouna et al, 1994; Holmes et al, 1995; Ryan et al, 1997; Xu et al, 1998; Simpson et al, 1999), were in the cluster of genes that was highly expressed in LC vs DR.
Figure 1.

Heat map depicting expression analysis of genes designated present as per GCOS using hierarchical clustering methods. Each row of colored boxes represents an individual gene and colors indicate relative gene expression levels, with red representing high expression and green representing low expression. Columns represent the different array experimental groups (WKY/DR, SD/DR, WKY/LC, and SD/LC). Clusters of genes that were more highly expressed in the LC (LC/HIGH), DR (DR/HIGH), WKY LC (WKY/LC/HIGH), WKY DR (WKY/DR/HIGH) or exhibited lower expression in the WKY DR (WKY/DR/LOW) are indicated on the right of the cluster by bars. The numbers in parentheses are the cluster correlation coefficients; only those above 0.75 were included. The dendrogram on the left links the different genes that correspond to the cluster coefficient. Branch lengths reflect the degree of similarity between genes (see Eisen et al, 1998).
Statistical Analysis by SAM Reveals Inherent Differences in Gene Expression in LC and DR between WKY and SD Rats
SAM analysis revealed 66 genes that showed increased expression in the LC of WKY rats and none that were relatively decreased in WKY vs SD. In the DR of WKY rats, expression of 19 genes was greater and that of 33 genes less compared to SD rats. Tables 1 and 2 provide a list of genes that were differentially expressed in WKY vs SD by a factor of 1.5-fold or greater grouped according to Gene Ontology (GO) Biological Function categories as per the Affymetrix NetAffx and Rat Genome Database websites (http://www.affymetrix.com/analysis/netaffx/index.affx and http://rgd.mcw.edu/). (Note that the entire list of all genes considered to be differentially expressed in a strain-related manner by SAM is provided in Supplementary Information and will include genes that were differentially expressed by less than 1.5-fold, but were still determined to be statistically different.)
Table 1.
Genes Differentially Expressed in LCa
| Accession no. | Gene description | Fold ind. | Chrom. loc. |
|---|---|---|---|
| Neurotransmitter transport | |||
| U09211 | Solute carrier family 18 (vesicular monoamine/acetylcholine), member 3 (Slc18a3) | 2.78 | 16p16 |
| Neurotransmitter biosynthesis and catabolism | |||
| M23601 | Monoamine oxidase B (Moab) | 1.96 | Xq12 |
| M93257 | Catechol-O-methyltransferase (Comt) | 1.57 | 11q23 |
| Neuropeptide signaling pathway | |||
| M25890 | Somatostatin (Sst) | 1.81 | 11q23 |
| M15191 | Tachykinin 1 (Tac1) | 1.63 | 4q21 |
| M54987 | Corticotropin-releasing hormone (Crh) | 1.81 | 2q24 |
| G-protein coupled receptor protein signaling pathway | |||
| X55812 | Cannabinoid receptor 1 (Cnr1) | 1.76 | 5q21 |
| M61099 | Glutamate receptor, metabotropic 1 (Grm1) | 1.55 | 1p13 |
| Ion transport | |||
| AF078779 | Voltage-gated channel like 1 (Vgcnl1) | 1.63 | 15q25 |
| X57514 | Gamma-aminobutyric acid (GABA) A receptor, gamma 1 (Gabrg1) | 1.58 | 14p11 |
| M22254 | Sodium channel, voltage-gated, type 2, alpha 1 polypeptide (Scn2a1) | 1.56 | 3q24 |
| X62839 | Potassium channel, voltage gated (Kcnc2) | 1.68 | 7q12 |
| Fatty acid and phospholipid metabolism | |||
| E12625 | Sterol-C4-methyl oxidase-like (Sc4mol) | 1.55 | 16p13 |
Genes that were determined to be elevated by at least 1.5-fold in WKY vs SD. Note that other genes were determined to be significantly elevated in the WKY strain by SAM analysis.
Table 2.
Genes Differentially Expressed in DR
| Accession no. | Gene description | Fold ind. | Chrom. loc. |
|---|---|---|---|
| Elevated in WKY a | |||
| Neuropeptide signaling pathway | |||
| M25890 | Somatostatin (Sst) | 2.76 | 11q23 |
| M15880 | Neuropeptide Y (Npy) | 1.60 | 4q24 |
| Ion transport | |||
| J05122 | Benzodiazepine receptor (Bzrp) | 1.64 | 7q34 |
| X15466 | Gamma-aminobutyric acid (GABA) A receptor, beta 1 (Gabrb1) | 1.50 | 14p11 |
| Cytoskeleton organization | |||
| X62952 | Vimentin (Vim) | 1.78 | 17q12.3 |
| AF028784 | Glial fibrillary acidic protein (Gfap) | 1.55 | 10q32.1 |
| Decreased in WKY b | |||
| Neurotransmitter transport | |||
| U09211 | Solute carrier family 18 (vesicular monoamine/acetylcholine), member 3 (Slc18a3) | 0.45 | 16p16 |
| Cytoskeleton organization | |||
| Z12152 | Neurofilament 3, middle (Nef3) | 0.5 | 15p12 |
| AA818677 | Neurofilament, heavy polypeptide (Nefh) | 0.5 | 14q12 |
| Protein processing and folding | |||
| M86389 | Heat shock 27kDa protein 1 (Hspb1) | 0.48 | 12q12 |
| Ion transport | |||
| M26161 | Potassium voltage-gated channel, shaker related subfamily, member 1 (Kcna1) | 0.5 | 4q42 |
Genes that were determined to be elevated by at least 1.5-fold in WKY vs SD.
Genes that were determined to be decreased by at least 0.5-fold. The number is the ratio of WKY: SD.
Note that other genes were determined to be significantly different in the WKY strain by SAM analysis.
Of the functional categories in which gene expression was determined to be significantly different in the LC of WKY vs SD rats, all were elevated in WKY rats, including G-protein-coupled receptor protein signaling pathway, neuropeptide signaling pathway, ion and neurotransmitter transport, neurotransmitter biosynthesis and catabolism, and metabolism (Table 1). Of particular interest is elevated expression of monoamine metabolic enzymes, monoamine oxidase B, and catechol-O-methyl transferase. Consistent with this, dopa decarboxylase was significantly elevated by 1.33-fold. Additionally, genes encoding for receptors (or receptor subunits) for several neurotransmitters that are known to impact on LC activity were also more highly expressed in the WKY strain, including the metabotropic glutamate receptor 1, the GABA Aγ1 subunit, and cannabinoid receptor 1. Likewise, genes encoding for the kappa opiate receptor 1 and hypocretin receptor 2 were significantly elevated in WKY LC by 1.46- and 1.3-fold, respectively. Some of the genes identified as being differentially expressed by SAM were also identified by cluster analysis or real-time PCR (see below).
LC neurons do not synthesize CRF and the CRF gene expression that was detected in LC tissue punches could arise from neurons adjacent to the lateral border of the LC or from nearby Barrington's nucleus (Valentino et al, 1992). It is of interest that CRF expression in these punches was elevated in the WKY strain.
Within the DR, expression of certain genes was increased or decreased in WKY vs SD rats (Table 2). Most of the genes that were differentially expressed in the DR were distinct from those that were differentially expressed in the LC, underscoring regional selectivity in gene expression differences. Genes that were more highly expressed in the DR of WKY rats included those encoding for certain neuropep-tides, chloride ion transport proteins, and structurally related proteins. A greater number of genes had lower expression in the DR of WKY vs SD rats. The vesicular monoamine/acetylcholine carrier, which exhibited the greatest increase of all genes in the LC of WKY rats, also showed the biggest strain difference in the DR, although in contrast to the LC, expression of this gene was lower in the WKY strain. Also noteworthy were decreases in expression of genes encoding the neurofilament proteins.
Hierarchical Clustering
To permit visualization of gene expression patterns, hierarchical clustering was used on all genes that were assessed as present (Figure 1). Using hierarchical clustering, genes were arranged into a functional framework to which GO analysis was applied to ascertain biological functions. Visual inspection of the cluster by TreeView indicated several well-defined clusters that were not only of interest in determining genes responsible for the stress-sensitive phenotype, but also denoted regional specificity. The analysis revealed several distinct expression patterns including (1) genes that were highly expressed in LC of both strains (LC/HIGH, cluster correlation coefficient 0.853), (2) genes highly expressed in DR of both strains (DR/HIGH, cluster correlation coefficient 0.906), (3) genes highly expressed in LC of WKY rats (WKY/LC/HIGH, cluster correlation coefficient 0.765), (4) genes highly expressed in DR of WKY rats (WKY/DR/HIGH, cluster correlation coefficients 0.900), and (5) genes with low expression in DR of WKY rats (WKY/DR/LOW, cluster correlation coefficient 0.883). Noticeably absent is a cluster containing genes with low expression in LC in WKY rats. This, however, is in agreement with results from SAM analysis whereby all genes that were differentially expressed in the LC of WKY rats were increased in this strain.
Hierarchical Clustering Reveals Regional Differences in Gene Expression and Functional Groups between LC and DR
Genes that were highly expressed in the LC (52) fell into several functional categories including ion transport, G-protein-coupled receptor protein signaling pathway, protein phosphorylation, neuropeptide signaling, and nervous system development and neurogenesis (Figure 2). The neuropeptide signaling pathway and central nervous system development categories were statistically over-represented. Genes in the neuropeptide signaling category that were elevated in the LC represented 14% of 21 total genes in this category on the array (χ2 = 5.5, p = 0.026). Genes in the central nervous system development category represented 21% of a total of 38 genes in this category (χ2 = 28, p = 1 × 10⁻⁷). Genes in this GO biological category were exclusively expressed in LC over DR. Although the ion transport category was not statistically over-represented in the LC, many genes that were more highly expressed in the LC encoded for amino-acid neurotransmitter receptor subtypes that fell within this functional group. Several G-protein-coupled receptor genes also distinguished the LC, indicative of the neurochemically diverse input to this region. In contrast to the LC, genes that distinguished the DR (40) were prominently from the neurotransmitter transport group. This category was over-represented, as 18% out of a total of 33 genes in this category on the array had greater expression in the DR (χ2 = 28.7, p = 9 × 10⁻⁸). Interestingly, genes that fell into the categories of protein amino-acid phosphorylation and G-protein-coupled receptor signaling were highly expressed in both the LC and DR.
Figure 2.

Regional differences in gene expression between LC and DR. Genes from the hierarchical clustering (LC/HIGH and DR/HIGH) were grouped according to GO biological function and are represented in pie chart form. 1 = ion transport, 2 = G-protein-coupled receptor protein signaling pathway, 3 = miscellaneous, 4 = regulation of transcription, 5 = transport, 6 = protein amino-acid metabolism, 7 = intracellular signaling cascade, 8 = immune/inflamatory response, 9 = neuropeptide signaling pathway, 10 = proteolysis/peptidolysis, 11 = nervous system development/neurogenesis, 12 = response to hypoxia/oxidative stress, 13 = apoptosis, 14 = cell adhesion, 15 = neurotransmitter transport, 16 = DNA repair, 17 = neurotransmitter biosynthesis and catabolism, 18 = cytoskeleton organization, 19 = protein processing and folding, 20 = energy reserve metabolism, 21 = regulation of cell cycle/cell growth, 22 = RNA processing, 23 = neurotransmitter secretion/synaptic transmission, 24 = metabolism, 25 = myelination. Representative gene products of some functional categories that were differentially expressed are listed in the tables to the right of the pie chart and grouped according to GO biological function.
Expression Patterns Revealed by Hierarchical Clustering Identify Transcripts Highly Expressed in LC of the Stress-Sensitive WKY Rat
The cluster designated as WKY/LC/HIGH had the largest amount (60) of gene transcripts, representing 24 GO biological function categories (Figure 3). The ion transport category contained the majority of these genes (18%), although as a whole, this general category was not over-represented (3.9% of 307 ion transport-related genes on the array). Genes in this category encoded for diverse receptors for the regulatory amino acids, glutamate, and GABA. The functional group of G-protein-coupled receptor signaling pathway also contained a relatively large number of genes (13%) in the cluster that were more highly expressed in the WKY LC. Included in this group were genes encoding receptor proteins such as cannabinoid receptor 1 (Cnbr1), hypocretin receptor 1 (Hcrtr1), and opioid receptor kappa 1 (Oprk1). Similar to the results of SAM analysis, cluster analysis suggested that genes involved in NE synthesis or metabolism are more highly expressed in the WKY LC, seen in the Neurotransmitter Biosynthesis and Catabolism cluster. Interestingly, genes for two transcription factors, POU domain, class 3, transcription factor 3 (Pou3f3) and MAD homolog 4 (Madh4), were elevated (Figure 3).
Figure 3.

Strain differences in gene expression between WKY and SD rats in LC and DR. Genes from the hierarchical clustering (WKY/LC/HIGH, WKY/DR/HIGH, and WKY/DR/LOW) were grouped according to GO biological function and are represented in pie chart form. 1 = ion transport, 2 = G-protein-coupled receptor protein signaling pathway, 3 = miscellaneous, 4 = regulation of transcription, 5 = transport, 6 = protein amino-acid metabolism, 7 = intracellular signaling cascade, 8 = immune/inflammatory response, 9 = neuropeptide signaling pathway, 10 = proteolysis/peptidolysis, 11 = nervous system development/neurogenesis, 12 = response to hypoxia/oxidative stress, 13 = apoptosis, 14 = cell adhesion, 15 = neurotransmitter transport, 16 = DNA repair, 17 = neurotransmitter biosynthesis and catabolism, 18 = cytoskeleton organization, 19 = protein processing and folding, 20 = energy reserve metabolism, 21 = regulation of cell cycle/cell growth, 22 = RNA processing, 23 = neurotransmitter secretion/synaptic transmission, 24 = metabolism, 25 = myelination. Representative gene products are listed in the tables to the right of the pie chart and grouped according to GO biological function. The entire list of genes determined to be differentially expressed by this analysis is provided in Supplementary Information.
Several genes that were identified by SAM analysis as distinguishing the LC of WKY vs SD rats were also identified by cluster analysis. These include genes encoding the GABA A receptor γ1, cannabinoid receptor 1, opioid kappa receptor 1, dopamine receptor 1A, serotonin receptor 7, catechol-O-methyl transferase, tachykinin 1, voltage-gated channel-like 1, brain-derived neurotrophic factor, and calcium calmodulin protein kinase II, δ.
Expression Patterns Revealed by Hierarchical Clustering Identify Transcripts Differentially Expressed in DR of the Stress-Sensitive WKY Rat
Several genes encoding for proteins that are involved in ion transport were differentially expressed in WKY DR (Figure 3). Interestingly, a preponderance of genes encoding potassium channels clustered in the group for WKY/DR/LOW, whereas genes encoding sodium (type 3, α polypeptide (Scn3a)) and calcium (α2/delta subunit 1 (Cacna2d1)) channels clustered in the WKY/DR/HIGH group. Included in the potassium channels were the six transmembrane domain voltage-gated potassium channels, Kv9./3 (Kcns3), Kv4.2 A-type channel (Kcnd2), and Kv1.1 (Kcna1). Also increased were the two-pore-domain K2p1.1 (Kcnk1) and the inward rectifying ATP-sensitive potassium channel Kir6.2 (Kcnj11). Another interesting pattern emerged in the cytoskeleton organization group with genes encoding the three neurofilament subunits (Nfl, Nef3, Nefh), structural components of axons, being clustered in the WKY/DR/LOW cluster. Genes for three transcription factors were decreased in the DR of the WKY strain (Figure 3).
Genes that were determined to be significantly elevated in the DR of WKY subjects in both SAM and cluster analysis included vimentin, benzodiazepine receptor, somatostatin, phospholipase C β1, plasminogen tissue activator, and mitogen-activated protein kinase kinase 1. Genes that were determined to have a significantly lower expression in the DR of WKY vs SD by both SAM and cluster analysis were solute carrier family 18 (vesicular monoamine/acetylcholine), member 3, the three neurofilament polypeptides (light, middle, and heavy), and potassium voltage-gated channel, Kv1.1.
Verification of Microarray Results by Real-Time Polymerase Chain Reaction
Quantitative real-time PCR was used to detect differential expression of certain selected genes in LC and DR tissue from WKY vs SD rats. The animals used for PCR were different from those used for the microarrays. The genes that were selected for PCR confirmation were those that were determined by SAM analysis to show the highest strain-related differential expression or that were of special functional interest. For the LC, this included the solute carrier family 18 (vesicular monoamine/acetylcholine) member 3 (Slc18a3), somatostatin (Sst), cannabinoid receptor 1 (Cnr1), opioid kappa receptor 1 (Oprk1), tyrosine hydroxylase, monoamine oxidase A (Maoa), monoamine oxidase B (Maob), and catechol-O-methyltransferase (Comt). For the DR this included solute carrier family 18 (vesicular monoamine/acetylcholine) member 3 (Slc18a3), somatostatin (Sst), GABA-Aβ1 (Gabrb1), and the potassium voltage-gated channel, Kv1.1 (Kcna1). This approach verified increased expression of somatostatin and the kappa 1 opioid receptor in the LC of WKY rats (Figure 4). Additionally, increased expression of the GABA-Aβ1 in the DR of WKY rats was verified using real-time PCR, as were decreases in expression of the vesicular monoamine/acetylcholine transporter and the potassium voltage-gated channel, Kv1.1 (Figure 4). However, there was substantial variability in PCR quantification of mRNA from these nuclei, and differences in expression of the other genes were not confirmed by this method.
Figure 4.
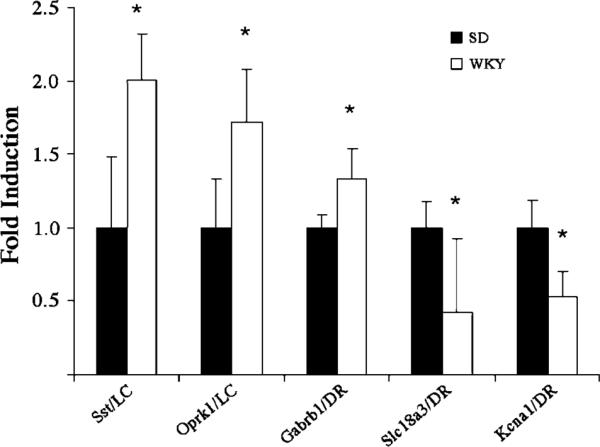
Real-time PCR confirmed differences in expression of certain genes that were identified as being differentially expressed by microarray analysis. The genes that were chosen for validation were significantly different between WKY and SD rats as per SAM analysis (somatostatin, Sst; opiate receptor kappa 1, Oprk1; Gaba receptor b1, Gabrβ1; solute carrier family 18 member 3, Slc18a3; potassium voltage-gated channel Kv1.1, Kcna1). Results are presented as fold induction relative to SD controls using the ΔΔCt method described in Materials and methods. The bars represent the mean of 10–17 samples (one sample per rat) and vertical lines indicate SEM, *p<0.05.
Relationship of Differentially Expressed Genes to Genetic Loci for WKY Depression-Related Behaviors
To determine whether the genes that were differentially expressed in a strain-related manner determined by either SAM or hierarchal cluster analysis were in proximity to genetic loci that have been associated with depressive- or anxiety-like behavior in rat models of depression, the chromosomal locations of the genes were entered into the Rat Genome Database (RGD Web Site, Medical College of Wisconsin, Milwaukee, WI. World Wide Web (URL:http://rgd.mcw.edu/sequenceresources/gbrowse.shtml; 12-15-05)) and quantitative trait loci (QTL) identified as listed in this database. These locations were also compared to genetic loci related to climbing, swimming, and immobility that were identified using QTL analyses of the F2 generation of a cross between WKY and Fisher 344 (Solberg et al, 2004). Of all genes that were differentially expressed in the LC and/or DR of the WKY strain, 15 were in proximity to anxiety-, despair-, or activity-related QTL. Table 3 lists these genes along with the QTL. By comparison, these 15 genes were in proximity with 197 QTL of which 25 were anxiety-, despair-, or activity-related. Interestingly, 73 of the 197 QTL in proximity with these genes were cardiovascular-related (ie related to blood pressure, heart rate, or cardiac mass). It is noteworthy that this list contains genes that were differentially expressed in either the LC or DR.
Table 3.
Genes Detected by Microarray as Being Differentially Expressed in WKY Rats in Proximity to QTL for Anxiety or Despaira
| Protein encoded by gene | Chromosomal location | QTL | Expression |
|---|---|---|---|
| Sodium channel, voltage-gated, type 2 α 1 polypeptide | chr3:47531852-47616843 | Anxiety-related QTL10 | |
| Despair-related QTL 11 | WKY/LC high | ||
| Solute carrier family 18, member 3 | chr16:7970146-7971739 | Despair-related QTL 6 | WKY/LC high |
| WKY/DR low | |||
| Glutamate receptor, metabotropic 1 | chr1:5321454-5742872 | Despair-related QTL 8 | WKY/LC high |
| Sterol-C4-methyl oxidase-like | chr16:26703604-26715501 | Despair-related, QTL 6, 7 | WKY/LC high |
| Glutathione S-transferaseA5b | chr9:20048843-20065889 | Despair-related QTL5 | WKY/LC high |
| Synaptotagmin 3b | chr1:94944917-94958568 | Climbing | WKY/LC high |
| Transferrin signal recognition | chr8:108237230-108263938 | Activity QTL 1, anxiety-related QTL 9 | WKY/LC high |
| Potassium channel, voltage-gated Kv3.2 (Kcnc2) | chr7:51347086-51505868 | Anxiety-related QTL 17, 6 | WKY/LC high |
| Inward rectifying ATP-sensitiveb | |||
| Potassium channel Kir6.2 (Kcnj11) | chr1:96693097-96695945 | Climbing | WKY/DR low |
| Synuclein γb | chr16:10025976-10030511 | Despair related, dimbing QTL6, 7 | WKY/DR low |
| Microtubule-associated protein 1A | chr3:107996094-108010036 | Despair-related QTL 2 | WKY/DR low |
| Potassium channel Kv1.1 (Kcna1) | chr4:163254845-163259290 | Anxiety-related QTL 16 | WKY/DR low |
| Sodium channel, voltage-gated | chr3:47317692-48213557 | Anxiety-related QTL 10 | |
| Type III, α polypeptide | Despair-related QTL11 | WKY/DR high | |
| Cholecystokinin | chr8:126512372-126518951 | Anxiety-related QTL 9, 15 | WKY/DR high |
| Benzodiazepine receptor | chr7:121631313-121633572 | Anxiety-related QTL 17 | |
| Stress-response QTL 8 | WKY/DR high |
The chromosomal location of genes that were detected by either SAM or cluster analysis as being differentially expressed in a strain-related manner was entered into the Rat Genome Database (RGD), Rat Genome Database Web Site, Medical College of Wisconsin, Milwaukee, WI. World Wide Web (URL:http://rgd.mcw.edu/sequenceresources/gbrowse.shtml) and QTL identified as listed (12-15-05).
The chromosomal location of genes that were detected by either SAM or cluster analysis as being differentially expressed in a strain-related manner is compared to loci identified as influencing despair (immobility) or climbing by Solberg et al (2004).
DISCUSSION
This is the first study to examine differential gene expression in monoamine nuclei between stress hyperresponsive and normoresponsive rat strains. Several genes were identified that were differentially expressed in the LC and DR of unstressed WKY vs SD rats using microarray analysis. Many of the same genes were detected by multiple means of analysis, emphasizing the reliability of the results. Notably, strain-related differential gene expression was not identical in the LC and DR, but showed regional selectivity. Within the LC, genes encoding for NE synthesis or metabolism were more highly expressed in WKY rats, suggesting that a dysfunction in NE turnover in this system may underlie the stress-sensitive, passive phenotype. Also noteworthy was an increased expression for genes encoding receptors for many of the neurotransmitters that convey afferent information to the LC, including amino acids, opioids, and hypocretin, suggesting an increased capacity of this system to respond to afferent input. The DR had a distinct pattern of strain-related differential gene expression relative to the LC, as the majority of affected genes exhibited lower expression in the WKY strain. A striking feature in this classification was the preponderance of genes encoding for various potassium channels, suggesting that the excitability and synaptic integration of DR neurons may be altered in WKY rats. Additionally, there was evidence for a decrease in genes for neurofilament proteins, cytoskeletal proteins that are important for structural plasticity. Together, the results indicate that gene expression differences in multiple brain systems can contribute to the WKY phenotype. Importantly, by identifying genes that are differentially expressed in localized brain nuclei of the stress-sensitive WKY strain, the microarray approach suggests potential avenues for elucidating the neurobiological basis for this stress-sensitive phenotype.
Caveats
There are several caveats to this approach that need to be considered in interpreting the data. Tissue punches of small nuclei such as the LC and DR are not homogeneous, but include neurochemically different neurons, possibly some tissue outside of the nucleus of interest, and may vary from dissection to dissection. In spite of this caveat, there was a high correlation for genes that were expressed between individual arrays that each represented tissue from the same region from different subjects. Moreover, the prevalence of the appropriate signature genes for each region verifies the tissue dissections. It should be noted that there is precedent for using similar tissue punches for microarray analysis (McClung et al, 2005).
Variability between tissue punches is a likely contributor to variability in the PCR results and in the inability of PCR to confirm some of the changes detected by microarray analysis. In this regard, it is noteworthy that different samples were used in the microarray and PCR studies and that tissue from multiple subjects was not pooled, but rather each sample derived from an individual subject. Although this protocol may contribute to false negatives, it underscores the power of the positive findings, that is, the genes that were detected in both microarray and PCR as being differentially expressed.
The phenotypic characteristics that distinguish the WKY are mostly based on differences observed in response to stress and, in many cases, acute stress. By identifying strain differences in baseline gene expression, this study focuses on what is inherently different in this strain that may underlie its distinct sensitivity to an acute stressor. Although the WKY strain may also be unique in the profile of genes that are regulated by stress, this is not the particular focus of the present study.
The genes that were identified as being differentially expressed are limited to those that are detected by the specific microarray used. As the intention of this study was to focus on genes that were neurally related, the microarrays used had a relatively limited number of genes and it is possible that other genes may have been identified by other microarrays.
Strain-Related Differential Gene Expression
The unique characteristics of the WKY phenotype include exaggerated hypothalamic–pituitary–adrenal and gastric responses to stress, as well as passive coping behavior. Stress-related behaviors may be either active (eg increased startle response, increased locomotor activity, defensive burying) or passive (eg freezing, decreased social interaction). A characteristic feature of the WKY strain is its bias toward passive behavior, even in models such as defensive burying and startle, where active responses would be considered to be the stress end point (Pare, 1992b, 1994; Pardon et al, 2002). The ability to readily adopt learned helplessness and immobility in the forced swim test, two rodent models of depression, have suggested that the passive WKY phenotype models some aspects of depression (Pare, 1989a; Pare and Redei, 1993). Consistent with this, the WKY rat also shows ambivalence behavior in one-way avoidance, suggestive of paralysis in decision-making that is characteristic in depressed subjects (Pare, 1993). Interestingly, immobility of the WKY rat in the forced swim test is attenuated by NE reuptake inhibitors, but not serotoninreuptake inhibitors (Lopez-Rubalcava and Lucki, 2000; Pollier et al, 2000; Tejani-Butt et al, 2003). This pharmacological profile suggests that the WKY strain may model a specific type of depression that is selectively sensitive to antidepressants that act on noradrenergic targets and is insensitive to serotonin reuptake inhibitors. Differential gene expression in either the LC or DR then may provide leads toward identifying neurobiological substrates that contribute to the phenotype.
Within the LC, one noteworthy strain difference in gene expression was an increase in genes encoding for proteins involved in NE synthesis (tyrosine hydroxylase) and metabolism (COMT and MAO). This suggests a basal increase in NE turnover, perhaps as a result of increased drive or sensitivity to afferents (see below). In situ hybridization studies have not detected elevated tyrosine hydroxylase mRNA in WKY rats (Sands et al, 2000; Pardon et al, 2002). However, decreases in NE terminal release in WKY rats suggested that an NE deficit may underlie the passive WKY phenotype (Pardon et al, 2002). The present microarray findings suggest that increased NE metabolism through greater expression of COMT or MAO could contribute to this deficit. This could also account for the selective efficacy of NE reuptake inhibitors in reversing passivity in this strain. Interestingly, functional polymorphisms in COMT in humans have been linked to schizophrenia, attentional dysfunction, and affective disorders as a result of altered dopamine and/or NE function (Blasi et al, 2005; Weinberger, 2005), although evidence for a direct role of this polymorphism in depression is equivocal (Frisch et al, 1999; Funke et al, 2005; Massat et al, 2005).
The finding that the LC of WKY rats had a greater expression of many ionotropic and G-protein-coupled receptors for neurotransmitters that regulate LC activity was also of interest. For example, excitatory amino acids acting at both NMDA and non-NMDA receptors mediate LC activation by many sensory and visceral stimuli (Ennis and Aston-Jones, 1988; Ennis et al, 1992; Page et al, 1992; Shiekhattar and Aston-Jones, 1992) and this is one means by which these stimuli elicit arousal (Page et al, 1992). Increased sensitivity to these inputs could account for increased expression of enzymes involved in NE turnover.
The LC is densely innervated by hypocretin, an arousal-inducing peptide that acts at two receptor subtypes (1 and 2) to activate the LC (Peyron et al, 1998; Hagan et al, 1999; Bourgin et al, 2000; Espana et al, 2004). LC activation by hypocretin is one mechanism by which hypocretin induces arousal (Bourgin et al, 2000; Espana et al, 2001). The present study revealed an increased expression of genes encoding the hypocretin 1 and hypocretin 2 receptors in the LC of WKY rats using cluster analysis and SAM, respectively. Increased expression of hypocretin receptors could reflect a compensation for decreased hypocretin levels that have been reported in WKY rats (Taheri et al, 2001; Allard et al, 2004). Like many depressed subjects, WKY rats show abnormal sleep patterns with greater fragmented sleep and increased time in REM sleep (Dugovic et al, 2000). The present findings suggest that dysfunctions in the hypocretin system may contribute to sleep disturbances in the WKY rat and potentially in depressed human subjects.
In addition to increased expression of receptors for excitatory neuromodulators of LC activity, the present microarray results demonstrate increases in genes encoding for components of GABA-A receptors. Notably, the GABA-Aγ1 subunit was found to be increased in the LC of WKY rats, using either cluster or SAM analysis. GABA is a primary inhibitory modulator of LC activity contained in LC afferents from the dorsal rostral medulla as well as in the pericoerulear zone (Ennis and Aston-Jones, 1989a, b; Aston-Jones et al, 2004).
Recent studies have linked the kappa opioid receptor with passive behavior in rodent depression models of learned helplessness and the forced swim test (Mague et al, 2003; McLaughlin et al, 2003; Shirayama et al, 2004). Thus, kappa receptor agonists facilitate passive behavior and antagonists have opposing effects that mimic antidepressants. As a characteristic feature of the WKY rat is its bias toward passive coping behavior, the finding that the gene encoding for the kappa opioid receptor is more highly expressed in the LC of the WKY strain is of particular interest. It is possible that the WKY strain, which is insensitive to selective serotonin reuptake inhibitors in rodent models of depression, will be sensitive to kappa opiate antagonists. In this case, the WKY strain may model a specific form of depression that is sensitive only to selective antidepressants.
The finding of increased CRF gene expression in WKY LC punches suggests that neurons in nearby Barrington's nucleus may synthesize more CRF and this may be reflected in alterations in pelvic visceral function, which this nucleus regulates (Valentino et al, 1999). Given the increased stress sensitivity of the WKY strain, it is of interest to determine whether CRF gene expression is increased in other CRF-synthesizing nuclei (eg paraventricular nucleus of the hypothalamus, central nucleus of the amygdala, bed nucleus of the stria terminalis).
Fewer genes in the DR were differentially expressed between strains compared to the LC and more were decreased in the WKY strain compared to SD. Outstanding among these was a group of genes encoding for different potassium channels. Basal differences in expression of these channels should be expressed in the active membrane properties of DR neurons or altered responses to afferent input. Several of these potassium channels (ie Kv4.2, which underlies the voltage-dependent A-type potassium channel, Kv6.2, the ATP-sensitive potassium channel, and Kv1.1) are involved in regulating neuronal firing frequency and/or synaptic integration (Song et al, 1998; Lopantsev et al, 2003; Allen and Brown, 2004; Cai et al, 2004; Kim et al, 2005). In all cases, these potassium channels, when activated, decrease excitability.
An additional consistent finding in the DR of WKY rats was a decrease in expression of genes encoding for the three neurofilament proteins. These were detected by both SAM and cluster analysis, underscoring the reliability of the finding. These proteins control axon caliber as well as the dynamics of other cytoskeletal elements. As such, they are involved in structural neuroplasticity, and downregulation of neurofilament mRNA has been implicated in neurodegenerative disorders (Julien and Mushynski, 1998). Decreased expression of these neurofilament proteins could result in an inability of DR neurons to adapt appropriately at a structural level to repeated challenges.
Comparison with QTL Analysis
It is noteworthy that several of the genes identified in the present microarray study as being differentially expressed by the WKY strain were in proximity to loci that influenced climbing or immobility (despair) in the forced swim test (Solberg et al, 2004) or activity in other anxiety models. That two different approaches (ie QTL and microarray) converge on common potential genetic loci strengthens the idea that genes in these loci are potentially important determinants of the phenotype. Together, these results can serve as a guide for future studies designed to better identify cellular attributes that define the passive phenotype of the WKY rat and humans suffering from depression.
Supplementary Material
ACKNOWLEDGEMENTS
We thank Dr Eric Rappaport and staff of the Nucleic Acid and Protein Core and Dr George Hi of the Real Time PCR Core of the Children's Hospital of Philadelphia for technical support. We also thank Dr James Crowley for advice regarding data analysis. This work was supported by ONR Grants N0014-03-1-0311, MH 40008, MH58250, MH02006, MH14654, and T32 MH14654.
Footnotes
Supplementary Information accompanies the paper on the Neuropsychopharmacology website (http://www.nature.com/npp)
REFERENCES
- Allard JS, Tizabi Y, Shaffery JP, Trouth CO, Manaye K. Stereological analysis of the hypothalamic hypocretin/orexin neurons in an animal model of depression. Neuropeptides. 2004;38:311–315. doi: 10.1016/j.npep.2004.06.004. [DOI] [PubMed] [Google Scholar]
- Allen TG, Brown DA. Modulation of the excitability of cholinergic basal forebrain neurones by KATP channels. J Physiol. 2004;554:353–370. doi: 10.1113/jphysiol.2003.055889. [DOI] [PMC free article] [PubMed] [Google Scholar]
- Aston-Jones G, Zhu Y, Card JP. Numerous GABAergic afferents to locus ceruleus in the pericerulear dendritic zone: possible interneuronal pool. J Neurosci. 2004;24:2313–2321. doi: 10.1523/JNEUROSCI.5339-03.2004. [DOI] [PMC free article] [PubMed] [Google Scholar]
- Blasi G, Mattay VS, Bertolino A, Elvevag B, Callicott JH, Das S, et al. Effect of catechol-O-methyltransferase val158met genotype on attentional control. J Neurosci. 2005;25:5038–5045. doi: 10.1523/JNEUROSCI.0476-05.2005. [DOI] [PMC free article] [PubMed] [Google Scholar]
- Bouna S, Gysling K, Calas A, Araneda S. Some noradrenergic neurons of locus ceruleus-olfactory pathways contain neuropeptide-Y. Brain Res Bull. 1994;34:413–417. doi: 10.1016/0361-9230(94)90038-8. [DOI] [PubMed] [Google Scholar]
- Bourgin P, Huitron-Resendiz S, Spier AD, Fabre V, Morte B, Criado JR, et al. Hypocretin-1 modulates rapid eye movement sleep through activation of locus coeruleus neurons. J Neurosci. 2000;20:7760–7765. doi: 10.1523/JNEUROSCI.20-20-07760.2000. [DOI] [PMC free article] [PubMed] [Google Scholar]
- Cai X, Liang CW, Muralidharan S, Kao JP, Tang CM, Thompson SM. Unique roles of SK and Kv4.2 potassium channels in dendritic integration. Neuron. 2004;44:351–364. doi: 10.1016/j.neuron.2004.09.026. [DOI] [PubMed] [Google Scholar]
- Chrousos GP. Stress, chronic inflammation, and emotional and physical well-being: concurrent effects and chronic sequelae. J Allergy Clin Immunol. 2000;106:S275–S291. doi: 10.1067/mai.2000.110163. [DOI] [PubMed] [Google Scholar]
- Chrousos GP, Gold PW. The concepts of stress and stress system disorders. Overview of physical and behavioral homeostasis. JAMA. 1992;267:1244–1252. [PubMed] [Google Scholar]
- Conti LH, Youngblood KL, Printz MP, Foote SL. Locus coeruleus electrophysiological activity and responsivity to corticotropin-releasing factor in inbred hypertensive and normotensive rats. Brain Res. 1997;774:27–34. doi: 10.1016/s0006-8993(97)81683-6. [DOI] [PubMed] [Google Scholar]
- Dugovic C, Solberg LC, Redei E, Van Reeth O, Turek FW. Sleep in the Wistar–Kyoto rat, a putative genetic animal model for depression. NeuroReport. 2000;11:627–631. doi: 10.1097/00001756-200002280-00038. [DOI] [PubMed] [Google Scholar]
- Eisen MB, Spellman PT, Brown PO, Botstein D. Cluster analysis and display of genome-wide expression patterns. Proc Natl Acad Sci USA. 1998;95:14863–14868. doi: 10.1073/pnas.95.25.14863. [DOI] [PMC free article] [PubMed] [Google Scholar]
- Ennis M, Aston-Jones G. Activation of locus coeruleus from nucleus paragigantocellularis: a new excitatory amino acid pathway in brain. J Neurosci. 1988;8:3644–3657. doi: 10.1523/JNEUROSCI.08-10-03644.1988. [DOI] [PMC free article] [PubMed] [Google Scholar]
- Ennis M, Aston-Jones G. GABA-mediated inhibition of locus coeruleus from the dorsomedial rostral medulla. J Neurosci. 1989a;9:2973–2981. doi: 10.1523/JNEUROSCI.09-08-02973.1989. [DOI] [PMC free article] [PubMed] [Google Scholar]
- Ennis M, Aston-Jones G. Potent inhibitory input to locus coeruleus from the nucleus prepositus hypoglossi. Brain Res Bull. 1989b;22:793–803. doi: 10.1016/0361-9230(89)90022-1. [DOI] [PubMed] [Google Scholar]
- Ennis M, Aston-Jones G, Shiekhattar R. Activation of locus coeruleus neurons by nucleus paragigantocellularis or noxious sensory stimulation is mediated by intracoerulear excitatory amino acid neurotransmission. Brain Res. 1992;598:185–195. doi: 10.1016/0006-8993(92)90182-9. [DOI] [PubMed] [Google Scholar]
- Espana RA, Baldo BA, Kelley AE, Berridge CW. Wake-promoting and sleep-suppressing actions of hypocretin (orexin): basal forebrain sites of action. Neuroscience. 2001;106:699–715. doi: 10.1016/s0306-4522(01)00319-0. [DOI] [PubMed] [Google Scholar]
- Espana RA, Reis KM, Valentino RJ, Berridge CW. Organization of hypocretin/orexin efferents to locus coeruleus and basal forebrain arousal-related structures. J Comp Neurol. 2004;481:160–178. doi: 10.1002/cne.20369. [DOI] [PubMed] [Google Scholar]
- Farook JM, Zhu YZ, Wang H, Moochhala S, Lee L, Wong PT. Strain differences in freezing behavior of PVG hooded and Sprague–Dawley rats: differential cortical expression of cholecystokinin2 receptors. NeuroReport. 2001;12:2717–2720. doi: 10.1097/00001756-200108280-00025. [DOI] [PubMed] [Google Scholar]
- Frisch A, Postilnick D, Rockah R, Michaelovsky E, Postilnick S, Birman E, et al. Association of unipolar major depressive disorder with genes of the serotonergic and dopaminergic pathways. Mol Psychiatry. 1999;4:389–392. doi: 10.1038/sj.mp.4000536. [DOI] [PubMed] [Google Scholar]
- Funke B, Malhotra AK, Finn CT, Plocik AM, Lake SL, Lencz T, et al. COMT genetic variation confers risk for psychotic and affective disorders: a case control study. Behav Brain Funct. 2005;1:19. doi: 10.1186/1744-9081-1-19. [DOI] [PMC free article] [PubMed] [Google Scholar]
- Hagan JJ, Leslie RA, Patel S, Evans ML, Wattam TA, Holmes S, et al. Orexin A activates locus coeruleus cell firing and increases arousal in the rat. Proc Natl Acad Sci USA. 1999;96:10911–10916. doi: 10.1073/pnas.96.19.10911. [DOI] [PMC free article] [PubMed] [Google Scholar]
- Holmes PV, Blanchard DC, Blanchard RJ, Brady LS, Crawley JN. Chronic social stress increases levels of preprogalanin mRNA in the rat locus coeruleus. Pharmacol Biochem Behav. 1995;50:655–660. doi: 10.1016/0091-3057(94)00334-3. [DOI] [PubMed] [Google Scholar]
- Irizarry RA, Hobbs B, Collin F, Beazer-Barclay YD, Antonellis KJ, Scherf U, et al. Exploration, normalization, and summaries of high density oligonucleotide array probe level data. Biostatistics. 2003;4:249–264. doi: 10.1093/biostatistics/4.2.249. [DOI] [PubMed] [Google Scholar]
- Julien JP, Mushynski WE. Neurofilaments in health and disease. Prog Nucleic Acid Res Mol Biol. 1998;61:1–23. doi: 10.1016/s0079-6603(08)60823-5. [DOI] [PubMed] [Google Scholar]
- Kim J, Wei DS, Hoffman DA. Kv4 potassium channel subunits control action potential repolarization and frequency-dependent broadening in rat hippocampal CA1 pyramidal neurones. J Physiol. 2005;569:41–57. doi: 10.1113/jphysiol.2005.095042. [DOI] [PMC free article] [PubMed] [Google Scholar]
- Lopantsev V, Tempel BL, Schwartzkroin PA. Hyperexcitability of CA3 pyramidal cells in mice lacking the potassium channel subunit Kv1.1. Epilepsia. 2003;44:1506–1512. doi: 10.1111/j.0013-9580.2003.44602.x. [DOI] [PubMed] [Google Scholar]
- Lopez-Rubalcava C, Lucki I. Strain differences in the behavioral effects of antidepressant drugs in the rat forced swimming test. Neuropsychopharmacology. 2000;22:191–199. doi: 10.1016/S0893-133X(99)00100-1. [DOI] [PubMed] [Google Scholar]
- Ma S, Morilak DA. Induction of FOS expression by acute immobilization stress is reduced in locus coeruleus and medial amygdala of Wistar–Kyoto rats compared to Sprague–Dawley rats. Neuroscience. 2004;124:963–972. doi: 10.1016/j.neuroscience.2003.12.028. [DOI] [PubMed] [Google Scholar]
- Magoul R, Onteniente B, Geffard M, Calas A. Anatomical distribution and ultrastructural organization of the GABAergic system in the rat spinal cord. An immunocytochemical study using anti-GABA antibodies. Neuroscience. 1987;20:1001–1009. doi: 10.1016/0306-4522(87)90258-2. [DOI] [PubMed] [Google Scholar]
- Mague SD, Pliakas AM, Todtenkopf MS, Tomasiewicz HC, Zhang Y, Stevens WC, Jr, et al. Antidepressant-like effects of kappa-opioid receptor antagonists in the forced swim test in rats. J Pharmacol Exp Ther. 2003;305:323–330. doi: 10.1124/jpet.102.046433. [DOI] [PubMed] [Google Scholar]
- Massat I, Souery D, Del-Favero J, Nothen M, Blackwood D, Muir W, et al. Association between COMT (Val158Met) functional polymorphism and early onset in patients with major depressive disorder in a European multicenter genetic association study. Mol Psychiatry. 2005;10:598–605. doi: 10.1038/sj.mp.4001615. [DOI] [PubMed] [Google Scholar]
- McClung CA, Nestler EJ, Zachariou V. Regulation of gene expression by chronic morphine and morphine withdrawal in the locus ceruleus and ventral tegmental area. J Neurosci. 2005;25:6005–6015. doi: 10.1523/JNEUROSCI.0062-05.2005. [DOI] [PMC free article] [PubMed] [Google Scholar]
- McEwen BS. Stress, adaptation, and disease. Allostasis and allostatic load. Ann NY Acad Sci. 1998;840:33–44. doi: 10.1111/j.1749-6632.1998.tb09546.x. [DOI] [PubMed] [Google Scholar]
- McEwen BS, Stellar E. Stress and the individual. Mechanisms leading to disease. Arch Intern Med. 1993;153:2093–2101. [PubMed] [Google Scholar]
- McLaughlin JP, Marton-Popovici M, Chavkin C. Kappa opioid receptor antagonism and prodynorphin gene disruption block stress-induced behavioral responses. J Neurosci. 2003;23:5674–5683. doi: 10.1523/JNEUROSCI.23-13-05674.2003. [DOI] [PMC free article] [PubMed] [Google Scholar]
- Page ME, Akaoka H, Aston-Jones G, Valentino RJ. Bladder distention activates locus coeruleus neurons by an excitatory amino acid mechanism. Neuroscience. 1992;51:555–563. doi: 10.1016/0306-4522(92)90295-d. [DOI] [PubMed] [Google Scholar]
- Pardon MC, Gould GG, Garcia A, Phillips L, Cook MC, Miller SA, et al. Stress reactivity of the brain noradrenergic system in three rat strains differing in their neuroendocrine and behavioral responses to stress: implications for susceptibility to stress-related neuropsychiatric disorders. Neuroscience. 2002;115:229–242. doi: 10.1016/s0306-4522(02)00364-0. [DOI] [PubMed] [Google Scholar]
- Pardon MC, Ma S, Morilak DA. Chronic cold stress sensitizes brain noradrenergic reactivity and noradrenergic facilitation of the HPA stress response in Wistar Kyoto rats. Brain Res. 2003;971:55–65. doi: 10.1016/s0006-8993(03)02355-2. [DOI] [PubMed] [Google Scholar]
- Pare WP. `Behavioral despair' test predicts ulceration in WKY rats. Physiol Behav. 1989a;46:483–487. doi: 10.1016/0031-9384(89)90025-5. [DOI] [PubMed] [Google Scholar]
- Pare WP. Strain, age, but not gender, influence ulcer severity induced by water-restraint stress. Physiol Behav. 1989b;45:627–632. doi: 10.1016/0031-9384(89)90083-8. [DOI] [PubMed] [Google Scholar]
- Pare WP. Learning behavior, escape behavior and depression in an ulcer susceptible rat strain. Integr Physiol Behav Sci. 1992a;27:130–141. doi: 10.1007/BF02698502. [DOI] [PubMed] [Google Scholar]
- Pare WP. The performance of WKY rats on three tests of emotional behavior. Physiol Behav. 1992b;51:1051–1056. doi: 10.1016/0031-9384(92)90091-f. [DOI] [PubMed] [Google Scholar]
- Pare WP. Passive-avoidance behavior in Wistar–Kyoto (WKY), Wistar, and Fischer-344 rats. Physiol Behav. 1993;54:845–852. doi: 10.1016/0031-9384(93)90291-m. [DOI] [PubMed] [Google Scholar]
- Pare WP. Open field, learned helplessness, conditioned defensive burying and forced-swim tests in WKY rats. Physiol Behav. 1994;55:433–439. doi: 10.1016/0031-9384(94)90097-3. [DOI] [PubMed] [Google Scholar]
- Pare WP, Redei E. Depressive behavior and stress ulcer in Wistar Kyoto rats. J Physiol (Paris) 1993;87:229–238. doi: 10.1016/0928-4257(93)90010-q. [DOI] [PubMed] [Google Scholar]
- Pare WP, Schimmel GT. Stress ulcer in normotensive and spontaneously hypertensive rats. Physiol Behav. 1986;36:699–705. doi: 10.1016/0031-9384(86)90357-4. [DOI] [PubMed] [Google Scholar]
- Pare WP, Tejani-Butt SM. Effect of stress on the behavior and 5-HT system in Sprague–Dawley and Wistar Kyoto rat strains. Integr Physiol Behav Sci. 1996;31:112–121. doi: 10.1007/BF02699783. [DOI] [PubMed] [Google Scholar]
- Peyron C, Tighe DK, van den Pol AN, de Lecea L, Heller HC, Sutcliffe JG, et al. Neurons containing hypocretin (orexin) project to multiple neuronal systems. J Neurosci. 1998;18:9996–10015. doi: 10.1523/JNEUROSCI.18-23-09996.1998. [DOI] [PMC free article] [PubMed] [Google Scholar]
- Pollier F, Sarre S, Aguerre S, Ebinger G, Mormede P, Michotte Y, et al. Serotonin reuptake inhibition by citalopram in rat strains differing for their emotionality. Neuropsychopharmacology. 2000;22:64–76. doi: 10.1016/S0893-133X(99)00092-5. [DOI] [PubMed] [Google Scholar]
- Redei E, Pare WP, Fraser A, Kluczynski J. Strain differences in hypothalamic–pituitary–adrenal activity and stress ulcer. Am J Physiol. 1994;266:R353–R360. doi: 10.1152/ajpregu.1994.266.2.R353. [DOI] [PubMed] [Google Scholar]
- Rittenhouse PA, Lopez-Rubalcava C, Stanwood GD, Lucki I. Amplified behavioral and endocrine responses to forced swim stress in the Wistar–Kyoto rat. Psychoneuroendocrinology. 2002;27:303–318. doi: 10.1016/s0306-4530(01)00052-x. [DOI] [PubMed] [Google Scholar]
- Ryan MC, Loiacono RE, Gundlach AL. Galanin messenger RNA during postnatal development of the rat brain: expression patterns in Purkinje cells differentiate anterior and posterior lobes of cerebellum. Neuroscience. 1997;78:1113–1127. doi: 10.1016/s0306-4522(96)00652-5. [DOI] [PubMed] [Google Scholar]
- Sands SA, Strong R, Corbitt J, Morilak DA. Effects of acute restraint stress on tyrosine hydroxylase mRNA expression in locus coeruleus of Wistar and Wistar–Kyoto rats. Brain Res Mol Brain Res. 2000;75:1–7. doi: 10.1016/s0169-328x(99)00255-7. [DOI] [PubMed] [Google Scholar]
- Shiekhattar R, Aston-Jones G. NMDA-receptor-mediated sensory responses of brain noradrenergic neurons are suppressed by in vivo concentrations of extracellular magnesium. Synapse. 1992;10:103–109. doi: 10.1002/syn.890100204. [DOI] [PubMed] [Google Scholar]
- Shirayama Y, Ishida H, Iwata M, Hazama GI, Kawahara R, Duman RS. Stress increases dynorphin immunoreactivity in limbic brain regions and dynorphin antagonism produces antidepressant-like effects. J Neurochem. 2004;90:1258–1268. doi: 10.1111/j.1471-4159.2004.02589.x. [DOI] [PubMed] [Google Scholar]
- Simpson KL, Waterhouse BD, Lin RC. Origin, distribution, and morphology of galaninergic fibers in the rodent trigeminal system. J Comp Neurol. 1999;411:524–534. doi: 10.1002/(sici)1096-9861(19990830)411:3<524::aid-cne13>3.0.co;2-x. [DOI] [PubMed] [Google Scholar]
- Solberg LC, Baum AE, Ahmadiyeh N, Shimomura K, Li R, Turek FW, et al. Sex- and lineage-specific inheritance of depression-like behavior in the rat. Mamm Genome. 2004;15:648–662. doi: 10.1007/s00335-004-2326-z. [DOI] [PMC free article] [PubMed] [Google Scholar]
- Song WJ, Tkatch T, Baranauskas G, Ichinohe N, Kitai ST, Surmeier DJ. Somatodendritic depolarization-activated potassium currents in rat neostriatal cholinergic interneurons are predominantly of the A type and attributable to coexpression of Kv4.2 and Kv4.1 subunits. J Neurosci. 1998;18:3124–3137. doi: 10.1523/JNEUROSCI.18-09-03124.1998. [DOI] [PMC free article] [PubMed] [Google Scholar]
- Stamp JA, Semba K. Extent of colocalization of serotonin and GABA in the neurons of the rat raphe nuclei. Brain Res. 1995;677:39–49. doi: 10.1016/0006-8993(95)00119-b. [DOI] [PubMed] [Google Scholar]
- Taheri S, Gardiner J, Hafizi S, Murphy K, Dakin C, Seal L, et al. Orexin A immunoreactivity and preproorexin mRNA in the brain of Zucker and WKY rats. NeuroReport. 2001;12:459–464. doi: 10.1097/00001756-200103050-00008. [DOI] [PubMed] [Google Scholar]
- Tejani-Butt S, Kluczynski J, Pare WP. Strain-dependent modification of behavior following antidepressant treatment. Prog Neuropsychopharmacol Biol Psychiatry. 2003;27:7–14. doi: 10.1016/s0278-5846(02)00308-1. [DOI] [PubMed] [Google Scholar]
- Tejani-Butt SM, Pare WP, Yang J. Effect of repeated novel stressors on depressive behavior and brain norepinephrine receptor system in Sprague–Dawley and Wistar Kyoto (WKY) rats. Brain Res. 1994;649:27–35. doi: 10.1016/0006-8993(94)91045-6. [DOI] [PubMed] [Google Scholar]
- Tusher VG, Tibshirani R, Chu G. Significance analysis of microarrays applied to the ionizing radiation response. Proc Natl Acad Sci USA. 2001;98:5116–5121. doi: 10.1073/pnas.091062498. [DOI] [PMC free article] [PubMed] [Google Scholar]
- Valentino RJ, Miselis RR, Pavcovich LA. Pontine regulation of pelvic viscera: pharmacological target for pelvic visceral dysfunctions. Trends Pharmacol Sci. 1999;20:253–266. doi: 10.1016/s0165-6147(99)01332-2. [DOI] [PubMed] [Google Scholar]
- Valentino RJ, Page ME, Van Bockstaele E, Aston-Jones G. Corticotropin-releasing factor innervation of the locus coeruleus region: distribution of fibers and sources of input. Neuroscience. 1992;48:689–705. doi: 10.1016/0306-4522(92)90412-u. [DOI] [PubMed] [Google Scholar]
- Wang H, Zhu YZ, Wong PT, Farook JM, Teo AL, Lee LK, et al. cDNA microarray analysis of gene expression in anxious PVG and SD rats after cat-freezing test. Exp Brain Res. 2003;149:413–421. doi: 10.1007/s00221-002-1369-1. [DOI] [PubMed] [Google Scholar]
- Wang QP, Nakai Y. Enkephalinergic innervation of GABAergic neurons in the dorsal raphe nucleus of the rat. Brain Res Bull. 1993;32:315–320. doi: 10.1016/0361-9230(93)90193-f. [DOI] [PubMed] [Google Scholar]
- Weinberger DR. Genetic mechanisms of psychosis: in vivo and postmortem genomics. Clin Ther. 2005;27(Suppl A):S8–S15. doi: 10.1016/j.clinthera.2005.07.016. [DOI] [PubMed] [Google Scholar]
- Xu ZQ, Shi TJ, Hokfelt T. Galanin/GMAP- and NPY-like immunoreactivities in locus coeruleus and noradrenergic nerve terminals in the hippocampal formation and cortex with notes on the galanin-R1 and -R2 receptors. J Comp Neurol. 1998;392:227–251. doi: 10.1002/(sici)1096-9861(19980309)392:2<227::aid-cne6>3.0.co;2-4. [DOI] [PubMed] [Google Scholar]
- Zafar HM, Pare WP, Tejani-Butt SM. Effect of acute or repeated stress on behavior and brain norepinephrine system in Wistar-Kyoto (WKY) rats. Brain Res Bull. 1997;44:289–295. doi: 10.1016/s0361-9230(97)00140-8. [DOI] [PubMed] [Google Scholar]
Associated Data
This section collects any data citations, data availability statements, or supplementary materials included in this article.