

Abstract
Controlled delivery of therapeutic agents from medical devices can improve their safety and effectiveness in vivo, by ameliorating the surrounding tissue responses and thus maintaining the functional integrity of the devices. Previously, we presented a new method for providing simultaneous controlled delivery from medical devices, by surface assembly of biodegradable polymer nanoparticles (NPs) encapsulating fluorescent dyes. Here, we continue our investigation with NPs loaded with therapeutic agents, dexamethasone (DEX) or plasmid DNA, and evaluated the bioactivity of the released molecules with macrophage cells associated with inflammation. Over a period of one week, NPs encapsulating DEX released 24.9 ± 0.8 ng from the probe surface and was successful at suppressing macrophage cell growth by 40 ± 10%. This percentage of suppression corresponded to ∼100% drug delivery efficiency, in comparison with the unencapsulated drug. DNA NP coatings, in contrast, released ∼1 ng of plasmid DNA and were effective at transfecting macrophage cells to express the luciferase gene at 300 ± 200 relative luminescence/mg total protein. This amount of luciferase activity corresponded to 100% gene delivery efficiency. Thus, NP coatings were capable of providing continuous release of bioactive agents in sufficient quantities to induce relevant biological effects in cell culture studies. These coatings also remained intact, even after 14 days of incubation with phosphate buffered saline. Although the maximum loading for NP coatings is inherently lower than the more established matrix coating, our study suggests that the NP coatings are a more versatile and efficient approach toward drug delivery or gene delivery from a medical device surface and are perhaps best suited for continuous release of highly potent therapeutic agents.
Keywords: nanoparticle, self-assembly, biocompatibility, dexamethasone, plasmid DNA
1. Introduction
Coatings that provide continuous release of biomolecules from medical devices have been studied in recent years because of their potential to improve the effectiveness of the devices, by enhancing their interaction with cells or by providing local delivery of therapeutic agents. Coating parameters that have been investigated include development of polymers that are inherently less inflammatory [1-3], surface modification of polymers [4-6], and controlled delivery capabilities from polymers [7-9]. For the last parameter, thin film polymer matrix coatings are still the predominant form for providing local delivery of treatment drug. Although such polymer matrix coatings are reliable in providing continuous release of biomolecules, they are not always appropriate because their thickness and poor conductivity limit the capacity of the medical device to communicate with neighboring cells. We, therefore, present here our new coating method: a self-assembled monolayer of polymer nanoparticles (NPs) on the medical device surface, to provide continuous release of bioactive agents from the device surface.
The principle of our coating technique is similar to the polyelectrolyte multilayering method used in colloid sciences, in which thin films are built by assembling alternating layers of oppositely charged polymers [10, 11]. We utilized NPs fabricated from negatively charged surfactant, poly(ethylene-alt-maleic acid) (PEMA), and adhered them electrostatically to a device surface modified with cationic poly(-L-lysine) (PLL). Having a layer of PLL on the device surface is important for controlling the NP-device surface interaction, in order to achieve a controlled and reproducible assembly of NPs. We can tune the extent of NP assembly, simply by altering the charge properties of the NPs (e.g. altering the pH or the salt concentration of the suspension buffer solution). Although a couple of papers in recent years have investigated NPs embedded in hydrogel as device coatings [8, 12], our controlled coating technique has advantages in that NP aggregation is suppressed and highly reliable release profiles may be achieved.
From our previous work [13], we demonstrated that batches of NPs encapsulating various fluorescent dye molecules could be mixed prior to NP assembly on the probe surface. The resulting NP coating, therefore, was capable of providing predictable, simultaneous release of multiple fluorescent molecules from the same surface. We also found that the distinct release profile of each molecule was preserved upon attachment to the same surface. In this work, we show that NP coatings can provide predictable releases of bioactive agents, and that the released molecules are able to induce relevant biological responses. This knowledge is particularly valuable to our hypothesis that NP coatings have the potential to provide simultaneous release of cocktailed therapeutic agents. For polymer matrix coatings, if multiple molecules are loaded into the same system, each molecule is not isolated from the others but is in a larger mixed pool of molecules. The release of one molecule can alter the release kinetics of another molecule, thereby rendering the prediction of each individual molecule invalid. Thus, our NP coating system is considered more versatile than the polymer matrix coatings.
The objectives of this study were the following: (1) to characterize the NP coatings in both drug delivery and gene delivery studies, (2) to evaluate the bioactivity of the released molecules in cell culture studies, and (3) to compare the delivery efficiencies of this new coating system to the more established polymer matrix system. Poly(lactide-co-glycolide) (PLGA) was selected for use in this study, because it is a FDA-approved, biodegradable polymer commonly used for particle fabrication [14-16]. Ethylene-vinyl acetate copolymer (EVAc) was chosen as a common polymer used for matrix fabrication; it is also FDA-approved for clinical use [17-19]. We expect the matrix coatings to have an inherently higher loading capability, because their fabrication process does not require an emulsion of two immiscible liquid phases. Therefore, molecules do not have a preferred soluble phase, which can affect their encapsulation efficiency. However, in cases involving potent therapeutic agents, the higher loading capability becomes less crucial compared with the ability to maintain the bioactivity of the encapsulated agents. To illustrate the differences between the two coating techniques, we modified a planar silicon oxide material, although we anticipate that our methods can be used on other surfaces as well, such as metals and polymers.
Dexamethasone (DEX), a synthetic glucocorticoid, and luciferase-encoding plasmid DNA were used as test molecules for controlled delivery from a device surface. DEX has been demonstrated to alter the healing responses after device implantation, by decreasing the number of infiltrating macrophage cells associated with inflammation [20, 21]. One mechanism of DEX induced macrophage cell number reduction is associated with the glucocorticoid receptor binding and the subsequent suppression of macrophage cell growth [22-24]. Administration of plasmid DNA, in contrast, can lead to production of proteins needed to enhance cell survival or cell function around the implant site. For this study, luciferase-encoding plasmid DNA was chosen as a representative reporter gene because its transfection effects can be readily detected by a luminometer with high sensitivity. All coatings were evaluated over a period of two weeks, which is the critical time frame for providing therapeutic treatment to the implant site before tissue fibrosis occurs [25-27]. Our results indicate that local controlled delivery of DEX and plasmid DNA may be obtained from NP coatings, although there are distinct advantages and limitations associated with our new method.
2. Materials and Methods
2.1 Materials
PLGA 50/50 MW 40,000-70,000 was purchased from Birmingham Polymers (Birmingham, AL). PLGA conjugated to PLL, via dicyclohexyl carbodiimide coupling technique, was provided by Dr. Jeremy Blum; see [28] for description of synthesis and properties. PEMA MW 400,000 was purchased from Polysciences (Warrington, PA). EVAc with 40% vinyl acetate was a gift from DuPont (Wilmington, DE).
DEX, dichloromethane (DCM), dimethyl sulfoxide (DMSO), N-[2-hydroxyethyl] piperazine-N′-ethanesulfonic acid (HEPES), tris-EDTA (TE), phosphate buffered saline (PBS), sodium chloride (NaCl), PLL MW 70,000-150,000 and all other chemicals were purchased from Sigma (St. Louis, MO). All buffer solutions were prepared with deionized water (18 MΩ) from an Ultrapure Water System (Millipore, Milford, MA). Plasmid DNA encoding firefly luciferase enzyme (pGL3, with CMV promoter) was purchased from Promega (Madison, WI), amplified and purified in-house using a plasmid DNA purification kit (Qiagen, Valencia, CA).
Silicon test probes were used to simulate medical devices in all of the coating experiments. The probes were made by depositing a 1 μm thick silicon dioxide layer onto a silicon wafer using plasma-enhanced chemical vapor deposition, then dicing the wafer into 1 mm×10 mm probes.
RAW 264.7 macrophage cells were purchased from ATCC (Manassas, VA) and cultured at 37 °C in a 5% CO2 humidified atmosphere. The culture medium was RPMI 1640 medium + L-glutamine (Invitrogen, Carlsbad, CA), supplemented with 10% fetal bovine serum from Invitrogen and 2% penicillin/streptomycin (Sigma, St. Louis, MO).
2.2 Fabrication of NPs
Drug encapsulating NPs were fabricated by the bulk emulsion technique. 100 mg of PLGA was dissolved in 2 ml of DCM overnight at room temperature. DEX dissolved in methanol (10 mg in 200 μl) was then added to the polymer solution. The entire mixture was added dropwise to 4 ml of 1% PEMA while vortexing and quickly sonicated at 38% amplitude for 3×10 s with a TMX 400 probe tip sonicator (Tekmar, Cincinnati, OH). The resulting single emulsion was poured into 100 ml of 0.3% PEMA bath and stirred for 3 h at room temperature to evaporate off the organic solvent. To retrieve the NPs, the disperse system was centrifuged at 10,000 RPM and washed with deionized water for 3 times. The cleaned NP sample was then flash frozen in deionized water at -80 °C and lyophilized at room temperature for 3 days. Dried NPs were collected and stored at -20 °C for future coating experiments.
For plasmid DNA encapsulating NPs, plasmid DNA dissolved in Tris-EDTA (600 mg in 200 μl) was added to the polymer solution, containing 100 mg of PLGA and 2 ml of DCM. The entire mixture was sonicated on ice with the probe tip sonicator for 2×10 s at 38% amplitude to form a primary emulsion. This emulsion was then added dropwise to 4 ml of 1% PEMA while vortexing and sonicated on ice for 10 s. The resulting secondary emulsion was poured into 100 ml of 0.3% PEMA bath and stirred for 3 h at room temperature to evaporate off the organic solvent. The DNA NPs were collected using the same methods as described for DEX NPs and stored at -20 °C. A different batch of DNA NPs was also fabricated using 75 mg of PLGA + 25 mg of PLGA-PLL copolymer. The copolymer was used for better control of the plasmid DNA encapsulation and release kinetics from NPs.
Blank NPs of each type were fabricated for controls in the coating experiments. Plasmid DNA encapsulating PLGA-PLL NPs were later used in all subsequent DNA NP coating experiments, because plasmid DNA encapsulation in non-conjugated PLGA NPs was highly inefficient.
Theoretical wt% loading = (Total mass of added molecules/100 mg of polymer) × 100
2.3 Particle Sizing
The mean sizes and size distributions of the NPs were determined by scanning electron microscopy (SEM). Samples were mounted onto an aluminum plate and sputter coated with Au by a Cressington Sputter Coater 108 auto (Ted Pella, Redding, CA) at 40 mA for 30 s, before being examined by an XL-30 Environmental SEM (FEI Company, Hillsboro, OR). Images of the NPs were taken at 5 kV acceleration voltage and 20,000× magnification. The diameters of all NPs were measured from the images by using Image J software (NIH, Bethesda, MD). At least 500 particles were counted for each batch of NPs to obtain an accurate size estimate.
2.4 Zeta Potentials
NPs were evaluated by a ZetaPALS analyzer (Brookhaven Instruments, Holtsville, NY). Samples were suspended in HEPES buffered saline (HBS: 10 mM HEPES, 100 mM NaCl, pH 7.4) at diluted concentrations. Zeta potential values were calculated from the measured mobility values using the Smoluchowski equation and the software provided by the manufacturer. All measurements were performed 30 times or more for each sample.
2.5 Encapsulation Efficiency
The amount of drug entrapped within the NPs was determined by a Spectra Max M5 microplate reader (Molecular Devices, Sunnyvale, CA). 5 mg of DEX NPs were dissolved in 1 ml of DMSO at room temperature overnight, diluted in PBS (10 mM phosphate, 100 mM NaCl, pH 7.4), and quantified by measuring the fluorescence absorbance at 650 nm from ELISA analysis (Neogen, Lexington, KY). The total mass of extracted drug molecules encapsulated in 5 mg of NPs was converted to an experimental wt% loading.
Experimental wt% loading of DNA NPs was determined by dissolving 5 mg of the NPs in 1 ml of 0.1 N NaOH + 1% SDS at room temperature overnight. The dissolved sample was then diluted with TE (10 mM Tris-HCl, 1 mM EDTA, pH 8.0), and the amount of plasmid DNA present was quantified by measuring the fluorescence intensities at 480 nm excitation/530 nm emission from PicoGreen assay analysis (Invitrogen, Carlsbad, CA).
% Encapsulation efficiency = (Experimental wt% loading/Theoretical wt% loading) × 100
2.6 Assembly of NP Coatings
Nanoparticle assembly on silicon oxide probe surfaces was optimized in our previous work (13). Briefly, silicon oxide probes were cleaned in a sequence of acetone, ethanol, and deionized water. A PLL layer was then deposited by incubating the probes in 0.4 mg/ml of PLL dissolved in HBS for 30 min at room temperature. PLL coated probes were rinsed with buffer for 10 min to remove unattached excess polymer and further incubated with 0.5 mg/ml of NPs in HBS suspension. A second buffer wash step removed any unattached NPs from the probe surface. Coated samples were vacuum dried overnight before the start of in vitro release experiments.
2.7 Total Mass in NP Coatings
To measure the total mass in DEX NP coatings, coated probes were incubated in 200 μl of DMSO to dissolve the coatings at room temperature overnight. The samples were further diluted in PBS. The amount of total DEX removed from the surface was then evaluated by ELISA analysis at 650 nm absorbance.
For DNA NPs, coated probes were incubated in 200 μl of 0.1 N NaOH + 1% SDS at room temperature overnight. The dissolved coatings were then diluted with TE, and the amount of plasmid DNA in the coatings was measured by PicoGreen assay at 480 nm excitation/530 nm emission.
2.8 In Vitro Release from NP Coatings
Release of drug from NP coated probes was conducted in 200 μl of PBS, at 37 °C, over a period of 14 days. At each time point, half of the sample solution was removed for ELISA analysis at 650 nm absorbance. Fresh PBS was then added back to refill the sample volume for the next time point. 10 mg of DEX NPs in 10 ml of PBS were also incubated in parallel to check if the release pattern of particles attached to the surface was similar to that of particles in bulk buffer suspension. NPs in bulk PBS suspension were pelleted during sample retrieval and resuspended in fresh buffer for the next time point.
Since the total extracted amount of plasmid DNA in NP coatings was low, only DNA NPs in bulk PBS suspension were evaluated for release kinetics. 10 mg of DNA NPs in 1 ml of PBS was evaluated for 14 days at 37 °C. At each time point, half of the release sample was removed and analyzed with PicoGreen assay at 480 nm excitation/530 nm emission. The sample volume was replenished with fresh PBS for the next time point. All samples in the release studies were under sink conditions to ensure complete dissolution of the released molecules.
2.9 Surface Morphology of NP Coatings
Surfaces of the coated probes were examined by SEM before and after 14 days of in vitro release. After the incubation period, samples were removed and washed with buffer, vacuum dried overnight, and prepared for SEM inspection. Samples were mounted onto an aluminum plate and sputter coated with Au for SEM analysis. Images of the surfaces were taken at 5 kV voltage and 2,500× magnification. The total area of NPs on the probe surface was estimated by Image J software analysis (NIH, Bethesda, MD), by summing up the areas of all spherical objects on surface.
% Surface area coverage = (Total area of NPs on surface/Surface area of the probe) × 100
2.10 Bioactivity of Released Molecules
To evaluate the bioactivity of drugs released from DEX NP coatings, coated probes were directly cultured with RAW 264.7 macrophage cells for 7 days. The cells were seeded at a density of 1×10⁴ cells/well. The culture medium consisted of 1 ml of RPMI 1640, supplemented with 10% fetal bovine serum and 2% penicillin/streptomycin. Cells in untreated wells were compared to cells in wells with blank NP and DEX NP coated probes. All wells were evaluated with MTS cell proliferation assay (Promega, Madison, WI) at 490 nm absorbance after 3 and 7 days of cell incubation (37 °C, 5% CO2, without removing the culture medium). A dose response curve for the unencapsulated DEX was also evaluated in cell culture, with various dilutions of DEX for 7 days. The dose response curve was used to test whether the observed cell responses from DEX NP coated probes were consistent with anticipated cell responses from the same amount of unencapsulated drug, to determine the drug delivery efficiency of DEX NP coatings.
% Drug delivery efficiency = (% Observed cell response/% Anticipated cell response) × 100
Bioactivity of the released plasmid DNA from NP coatings was evaluated by cell transfection experiments. Cells were seeded at a density of 5×10⁴ cells/well. Supernatants from DNA NP coated probes, after 3 days of incubation, were complexed with Lipofectamine™ (Invitrogen, Carlsbad, CA) at a ratio of 1 μg DNA: 3 μg Lipofectamine™. This complex was added to the culture wells with 400 μl of antibiotic-free RPMI 1640 culture medium and incubated for 5 h at 37 °C, 5% CO2. The transfection medium was then removed and replaced with 1 ml of full RPMI 1640 medium, supplemented with 10% fetal bovine serum and 2% penicillin/streptomycin.
Luciferase activity was determined 24 h after the start of transfection using a luciferase assay and a Glomax 20/20 luminometer (Promega, Madison, WI). The activity was normalized to the total protein content, as detected by Micro BCA protein assay (Pierce, Rockford, IL) at 562 nm absorbance. Stock plasmid DNA was used as positive control to determine if the bioactivity of plasmid DNA released from NP coatings differed from that of unencapsulated plasmid DNA. Two plasmid DNA standards in the estimated range of release were also included in the transfection studies to demonstrate the efficiency of cell transfection with plasmid DNA at low quantities. Cells alone, plasmid DNA without Lipofectamine™ and blank NP coated probes were used as negative controls. The gene delivery efficiency of DNA NP coatings was also calculated.
% Gene delivery efficiency = (Observed luciferase activity/Anticipated luciferase activity) × 100
2.11 Comparisons with Matrix Coatings
i. Fabrication of Matrix Coatings
A desired amount of the drug was vortexed into a polymer solution containing 100 mg of EVAc and 1 ml of DCM. Silicon oxide probes were dipped 3×1 min into the polymer/drug solution by using a WPI M3301 micromanipulator (World Precision Instruments, Sarasota, FL). Coated probes were dried overnight under vacuum conditions to remove the solvent to form the solid polymer coatings. Blank, 10 wt%, 30 wt% and 50 wt% DEX matrix coatings were formulated. The theoretical wt% loading of matrix coatings was calculated in the same manner as NP coatings.
For DNA matrix coatings, 5 mg of the stock plasmid DNA was initially mixed with 95 mg of Ficoll 400 (a co-dispersant for DNA) and lyophilized overnight to a dry powder. A desired amount of the DNA mixture powder was then vortexed into a polymer solution containing 100 mg of EVAc in 1 ml of DCM and used in the dip coating method as described for DEX matrix coatings. Coated probes were vacuum dried overnight to solidify the coatings. Blank, 20 wt% and 50 wt% DNA matrix coatings were formulated. Coatings with Ficoll 400 only were used as blank controls.
ii. Total Mass in Matrix Coatings
Because EVAc is only soluble in DCM, which is incompatible with ELISA, the amount of drug encapsulated in matrix coatings was estimated from the average thickness, density, and the theoretical wt% loadings of the coatings. Thickness of the matrix coatings was measured from SEM images by Image J software analysis.
The total mass of plasmid DNA in matrix coatings was determined by an extraction method. Specifically, coated probes were incubated in 0.5 ml of DCM for 3 h at room temperature to dissolve the coatings and then vortexed with 1 ml of TE. The solution was allowed to phase separate for an additional 3 h. The extracted plasmid DNA in aqueous phase was measured by PicoGreen assay at 480 nm excitation/530 nm emission.
iii. In Vitro Release from Matrix Coatings
Matrix coated probes were incubated in PBS, at 37 °C, for 14 days. At each time point, a portion of the sample solution was removed for quantitation analysis of released molecules. DEX samples were evaluated at 242 nm absorbance, while plasmid DNA samples were measured at 480 nm excitation/530 nm emission. Fresh PBS was added to refill the sample volume for the next time point. All samples in the release studies were under sink conditions to ensure complete dissolution of the released molecules.
iv. Bioactivity of Released Molecules
Bioactivity experiments for matrix coatings were conducted in the exact manner as NP coatings (as described in section 2.10). Cells in untreated wells were compared to cells in wells with blank, 10 wt% and 50 wt% DEX matrix coated probes. All wells were evaluated with MTS cell proliferation assay at 490 nm absorbance, after 3 and 7 days of cell incubation. Drug delivery efficiency of matrix coatings was calculated in the same manner as NP coatings.
Correspondingly, supernatants from 50 wt% DNA matrix coated probes on day 3 were tested for cell transfection. The luminescence activity was measured by a luminometer and normalized to the total protein content, as determined by Micro BCA assay at 562 nm absorbance. Stock plasmid DNA and lyophilized plasmid DNA were used as positive controls. Cells alone, plasmid DNA without Lipofectamine™ and Ficoll 400 coated blank probes were used as negative controls. Gene delivery efficiency of matrix coatings was also calculated in the same manner as NP coatings.
2.12 Statistical Analysis
All samples were prepared and tested in triplicates or more. Sample data is presented as mean ± standard deviation of the mean. The statistical significance of differences between the control and test groups was also determined by Student's t-Test. P values < 0.05 were considered as significant.
3. Results
3.1 Preparation and Characterization of NPs
The properties of DEX NPs and DNA NPs are summarized in Table 1. The encapsulation efficiency of DNA in 100 mg PLGA was extremely low (0.01 wt%), and thus only DNA NPs made with 75 mg PLGA + 25 mg PLGA-PLL copolymer were utilized in the coating experiments. Although both DEX NPs and DNA NPs were made mainly from the same polymer concentration and type of solvent, DNA NPs were slightly larger in mean size due to the shorter sonication times and the double emulsion required for their fabrication (Figure 1). The mean particle size was 180 ± 60 nm for DEX NPs and 230 ± 90 nm for DNA NPs; the zeta potential values were -14 ± 2 mV and -16 ± 1 mV respectively.
Table 1.
Properties of Nanoparticles Loaded with Biomolecules.
| Type of NPs | Particle Sizea (nm) | Zeta Potentialb (mV) | Experimental Loading (wt%) | Encapsulation Efficiency (%) |
|---|---|---|---|---|
| Blank | 190 ± 30 | -15 ± 2 | N/A | N/A |
| DEX loaded | 180 ± 60 | -14 ± 2 | 7 | 70 |
| DNA loaded | 230 ± 90 | -16 ± 1 | 0.2 | 33 |
n=500
n=30
Buffer solution was 10 mM HEPES, 100 mM NaCl, pH 7.4
Figure 1. Nanoparticles Loaded with Biomolecules.
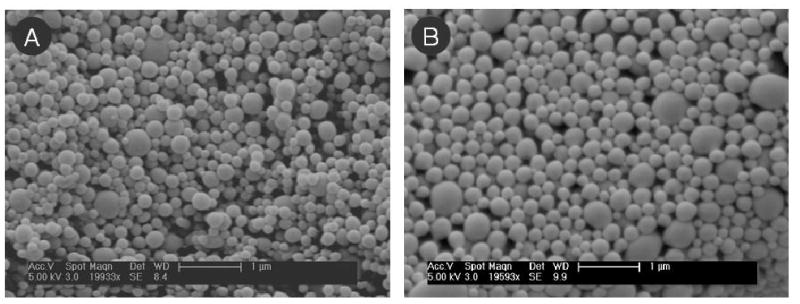
NPs encapsulating (A) DEX and (B) plasmid DNA were examined under SEM. Both types of NPs had the normal spherical morphology. NPs encapsulating plasmid DNA had larger mean particle diameter, but both types of NPs had similar magnitude in their zeta potentials. The mean particle size was 180 ± 60 nm for DEX NPs and 230 ± 90 nm for DNA NPs; the zeta potential values were -14 ± 2 mV and -16 ± 1 mV respectively. (Scale bar = 1 μm)
The two types of NPs differed in their experimental loading and encapsulation efficiency. For DEX NPs, the measured experimental loading was 7 wt%, which led to an encapsulation efficiency of 70%. This loading value is consistent with other literature reports of DEX encapsulation into PLGA particles by emulsion technique. Although alternative co-solvents or polymer ratios can potentially be used to improve DEX encapsulation, the reported range of DEX loadings from those formulations is still nevertheless between 2-10 wt% [8, 12, 29]. For DNA NPs, the measured loading for plasmid DNA made from 100 mg PLGA polymer was 0.01 wt%. This value was significantly improved by 20-fold by using a PLGA-PLL copolymer to electrostatically attract and encapsulate more plasmid DNA in the NPs produced. The measured loading value for the new formulation was 0.2 wt%, which was consistent with the loading values reported in Blum et al. [28]. The encapsulation efficiency for this new formulation was 33%.
3.2 Surface Evaluation of NP Coatings
No significant changes in morphology were observed with DEX NPs coated on surface, before and after 14 days of PBS release study at 37 °C (Figure 2). Image J analysis determined that the percentage of surface area covered by DEX NPs was maintained at ∼13% or 5.5 mm2, despite the continuous exposure to buffer solution. Similarly, no significant changes in surface morphology were visible for DNA NPs, although they had a lower overall surface density compared to DEX NPs. The calculated surface area covered by DNA NPs was ∼4% or 1.7 mm2 throughout the entire two weeks of buffer incubation. DNA NPs on surface also appeared slightly larger than DEX NPs, which was consistent with their mean size differences. Both NP coatings had the same assembly buffer conditions: 10 mM HEPES, 100 mM NaCl, pH 7.4. The difference in DEX NP and DNA NP surface density will be addressed in the discussion section.
Figure 2. Surface Morphology of Nanoparticle Coatings.
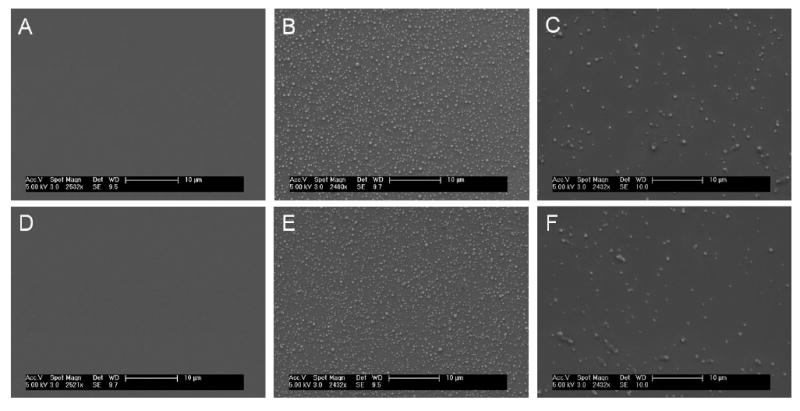
Before PBS exposure: (A) bare silicon oxide surface, (B) DEX NP coated surface, and (C) DNA NP coated surface. After 14 days of PBS exposure at 37 °C: (D) bare silicon oxide surface, (E) DEX NP coated surface, and (F) DNA NP coated surface. Surface morphology of NP coatings remained intact before and after two weeks of PBS exposure, demonstrating that the NPs were stable on probe surface. Surface coverage also remained the same throughout the two-week period, ∼13% for DEX NPs and ∼4% for DNA NPs. (Scale bar = 10 μm)
3.3 In Vitro Release from NP Coatings
The cumulative mass of DEX released from NP coating is presented in Figure 3A. The extracted total mass of DEX in the NP coating was 30 ng. Figure 3B compares the release of DEX from NP coatings to NPs in bulk PBS suspension and confirmed that NPs on surface maintained the same release kinetics as NPs in bulk PBS suspension. The extracted mass of plasmid DNA from the NP coating was ∼1 ng. Because of the low loading of plasmid DNA in NPs and the low number of DNA NPs attached to the probe surface, it was not possible to measure the plasmid DNA release directly from DNA NP coatings. However, plasmid DNA release kinetics from particles on surface should be similar to release kinetics from particles in bulk PBS suspension, which was measured and presented in Figure 3C.
Figure 3. Biomolecule Release Profiles from Nanoparticle Coatings.
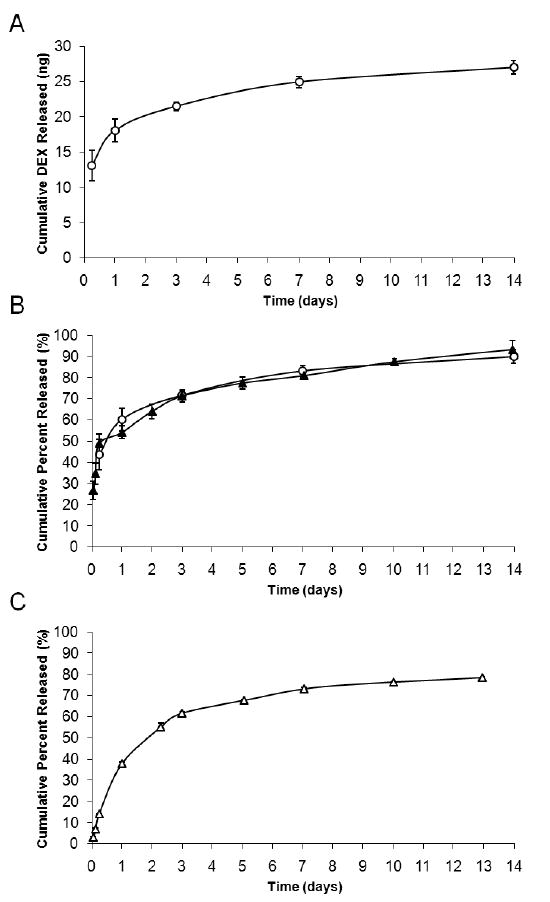
Both DEX and plasmid DNA were continuously released from NPs for up to 14 days in PBS at 37 °C. Release kinetics of DEX NPs on surface (A) was identical to 10 mg of DEX NPs in 10 ml bulk PBS suspension (B). Due to the low density of DNA NPs on surface, plasmid DNA release kinetics from DNA NP coating was not directly measured. Plasmid DNA release was investigated only in bulk PBS suspension (C). (-○- 7 wt% DEX NP coatings, -▲- 7 wt% DEX NPs in bulk PBS suspension, -△- 0.2 wt% DNA NPs in bulk PBS suspension, n=3) For symbols without error bars, the standard deviation of the measurements was smaller than the size of the symbol.
Both DEX NP and DNA NP coatings exhibited the biphasic release profile: an initial burst release phase (<3 days), followed by a continuous and slow release phase (>3 days). The continuous release was successfully maintained for a period of two-weeks in PBS at 37 °C. For the hydrophobic DEX, the cumulative percent released during the initial burst phase was approximately 70%. For the hydrophilic plasmid DNA, the cumulative percent released from pure PLGA NPs, for the first 3 days, was fairly high at 80% (Supp. 1). Plasmid DNA encapsulated into PLGA-PLL copolymer had slower release kinetics and a reduced cumulative percent of 60%.
3.4 Drug Delivery vs. Gene Delivery
DEX added to cell culture medium was effective at suppressing RAW 264.7 macrophage cell growth, with 50% suppression at ∼200 ng of DEX treatment after 7 days of cell culture (Figure 4A insert). The observed cell responses to DEX NP coated probes were compared with the anticipated cell responses for unencapsulated drug, to determine the drug delivery efficiency of the NP coating system. When the cells were cultured with DEX NP coated probes after 3 days (Figure 4A), no difference in cell growth was observed compared to cells in untreated wells and in wells with blank NP coated probes. On day 7, however, the cell culture exhibited a cell response: 40 ± 10% cell growth suppression from exposure to 24.9 ± 0.8 ng of released DEX. This observed cell response was greater than the anticipated 30% cell growth suppression from single dose of the same amount of unencapsulated drug. The drug delivery efficiency of DEX NP coatings was calculated to be >100%. Cells only and cells with blank NP coated probes exhibited minimal responses after 7 days of culture.
Figure 4. Macrophage Cell Responses to Nanoparticle Coatings.
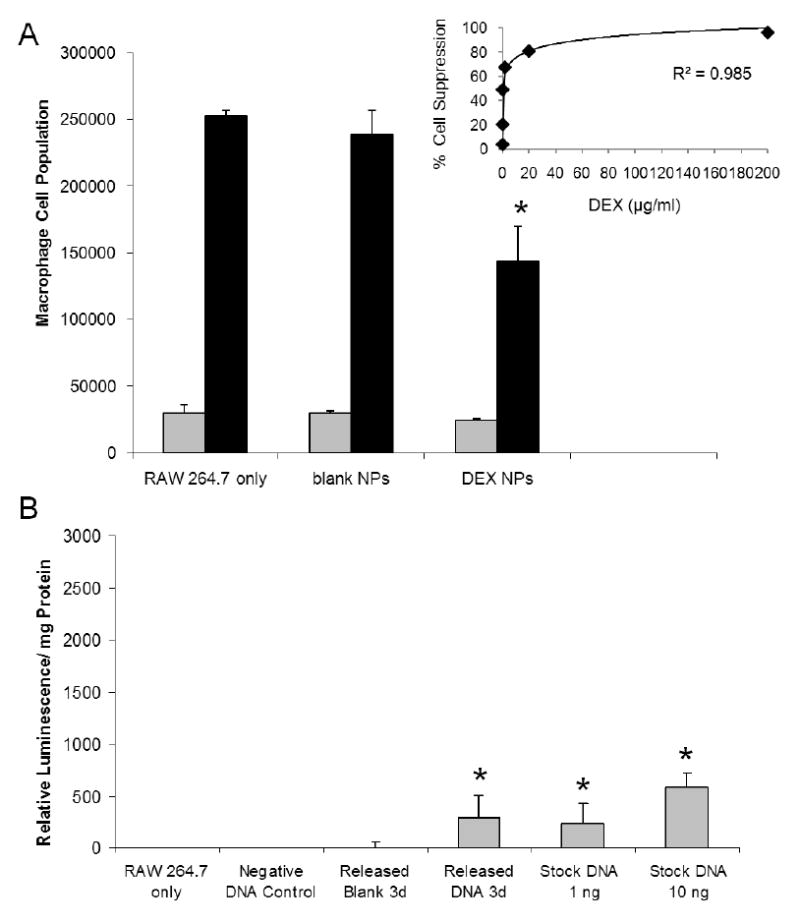
(A) The anti-inflammatory drug was released directly into cell culture for 7 days from DEX NP coated probes. A dose response curve of the unencapsulated DEX (insert) was also performed for 7 days, to determine the drug delivery efficiency of the DEX NP coatings. 24.9 ± 0.8 ng of DEX was released from NP coatings, which corresponded to >100% delivery efficiency in comparison with unencapsulated DEX of same amount. (B) ∼1 ng of plasmid DNA was released from NP coatings on day 3 and complexed with Lipofectamine™ before introduction to cell culture. The transfection result from DNA NP coatings (300 ± 200 relative luminescence/ mg total protein) was equivalent to 100% gene delivery efficiency, in comparison with unencapsulated plasmid DNA of same amount. (Grey bars = 3 days, black bars = 7 days, n = 3) *denotes statistical difference between the test groups and the untreated RAW 264.7
Cell transfection results after exposure to plasmid DNA released from DNA NP coatings are presented in Figure 4B. Plasmid DNA release samples were collected on day 3 and introduced to the cells without dilution, to conserve the total mass of plasmid DNA in DNA NP coatings (∼1 ng). Luciferase activity was visible in cells that were exposed to the plasmid DNA release samples. The measured relative luminescence/mg total protein for DNA NP coatings was 300 ± 200. Stock plasmid DNA controls, treated with only 1 ng and 10 ng per well doses, confirmed the biological activity of plasmid DNA molecules at such low concentrations. The luciferase activity from both the plasmid DNA release samples and the 1 ng stock plasmid DNA control were in good agreement, leading to 100% gene delivery efficiency for the DNA NP coatings. Cells only, plasmid DNA without transfection agent, and blank NP coatings showed minimal background luminescence.
3.5 Comparisons to Matrix Coatings: In Vitro Release Profiles
The cumulative mass of DEX released from matrix coating is presented in Figure 5A. The total surface area of the matrix coating was 31 mm2. Three loadings for the 10 μm thick DEX matrix coatings were varied systematically from 10 wt% to 50 wt%. The calculated total mass of DEX in the matrix coating was 200 μg for 50 wt% loading, 48 μg for 30 wt% loading, and 16 μg for 10 wt% loading (compared to 30 ng in DEX NP coating). It was noted that the 50 wt% loading solution had greater viscosity and resulted in a coating thickness that was twice as thick as the lower loadings, and thus the total mass released from 50 wt% loading would need to be scaled down if one wants to compare the release profiles among the three loadings. The loadings affected the DEX release profiles from the coatings. The highest loading (50 wt%) produced a more continuous release of the drug over 14 days of incubation with PBS at 37 °C, while the low loadings plateaued after the initial burst phase (<3 days). Figure 5B demonstrates the difference in drug delivery kinetics between the 50 wt% DEX matrix and DEX NP coating systems. DEX NP coatings had higher cumulative percent released during the initial first 3 days (70% from NPs compared to 55% from matrix), although both coating systems released up to nearly 90% at the end of 14 days.
Figure 5. Comparison of Biomolecule Release Profiles with Matrix Coatings.
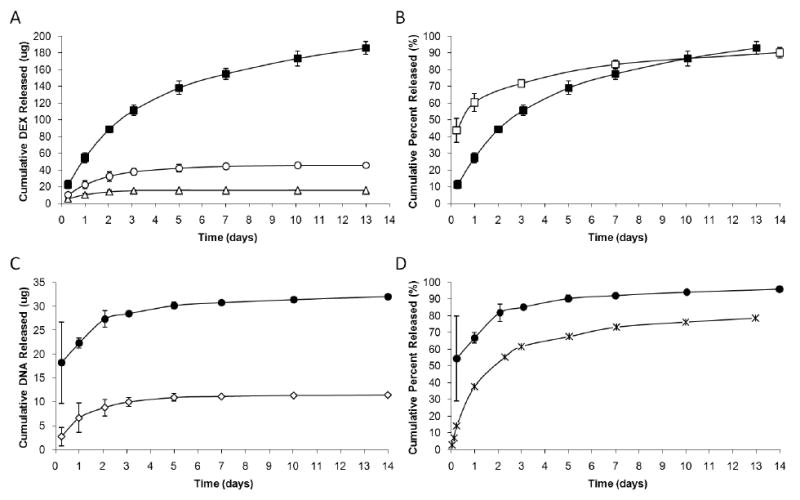
Continuous release studies were conducted for 14 days at 37 °C in PBS buffer. (A) Three loadings were investigated with the DEX matrix coatings: 10 wt%, 30 wt%, and 50 wt%. Note that the 50 wt% coating thickness was twice that of the lower loadings, and that the total mass released has not yet been adjusted. (B) The highest 50 wt% matrix coating was compared to DEX NP coating in their release kinetics. (C) Only 20 wt% and 50 wt% loadings were tested for DNA matrix coatings. (D) Due to the low density of DNA NPs on surface, release from DNA NP coatings was not measured and was substituted with release profile from DNA NPs in bulk PBS suspension. In general, matrix coatings had higher loading capabilities than NP coatings. (-■- 50 wt% DEX matrix, -○- 30 wt% DEX matrix, -△- 10 wt% DEX matrix, n=6; -□- 7 wt% DEX NPs, n=3; -●- 50 wt% DNA matrix, -◇- 20 wt% DNA matrix, n=6; -X-0.2 wt% DNA NPs, n=3) For symbols without error bars, the standard deviation of the measurements was smaller than the size of the symbol.
Release of plasmid DNA was evaluated with 20 wt% and 50 wt% DNA matrix coatings of 60 μm in thickness (Figure 5C). The extracted total mass of plasmid DNA was 33 μg for 50 wt% loading and 14 μg for 20 wt% loading (compared to ∼1 ng in DNA NP coating). The release profiles did not vary significantly between the two loadings over the two-week period. The higher 50 wt% loading did have a higher initial burst release due to more plasmid DNA mass; however, the kinetics of the slow release phase was similar to the lower loading. When compared to DNA NP coatings (Figure 5D), 50 wt% DNA matrix coatings provided greater cumulative percent released during the initial first 3 day (85% from DNA matrix compared to 60% from DNA NPs) and the subsequent slow release for up to 14 days (>90% from DNA matrix compared to 70% from DNA NPs). This result was attributed to the PLGA-PLL copolymer used in DNA NP fabrication to electrostatically attract and retain more plasmid DNA to improve release kinetics (Supp. 1).
3.6 Comparisons to Matrix Coatings: Bioactivity of Released Molecules
Similar to DEX NP coatings, cell responses to DEX matrix coatings were also investigated. Cell responses after 7 days of exposure to DEX matrix coated probes exhibited 70 ± 4% of growth suppression for 10 wt% DEX matrix coatings and 90 ± 5% suppression for 50 wt% coatings (Figure 6A). The cumulative amount of DEX released up to day 7 was 15.3 ± 0.1 μg and 154.6 ± 6.3 μg respectively. Note that the 50 wt% matrix coatings released much higher amounts of DEX, due to its greater coating thickness. The observed cell responses were less than the anticipated 80-95% cell growth suppression from the same amount of unencapsulated drug. The drug delivery efficiencies for both matrix coatings were calculated to be near 90% for both loadings. Cells only and cells with blank NP coated probes exhibited minimal responses after 7 days of culture. These results indicated that DEX matrix coatings were less efficient than DEX NP coatings in inducing relevant biological responses, despite the higher quantity of biomolecules released (Figure 6B).
Figure 6. Comparison of Macrophage Cell Response with Matrix Coatings.
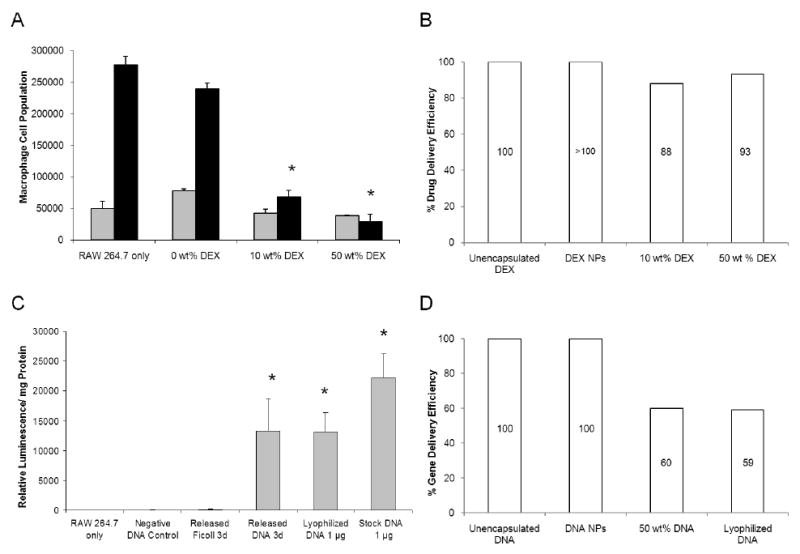
(A) The anti-inflammatory drug was released directly into cell culture for 7 days from DEX matrix coated probes. 15.3 ± 0.1 μg and 154.6 ± 6.3 μg of DEX was released from 10 wt% and 50 wt% matrix coatings respectively, which corresponded to near 90% drug delivery efficiency for both in comparison with unencapsulated DEX of same amount. (B) This value was compared with the % drug delivery efficiency obtained by DEX NP coating. (C) 28.5 ± 0.3 μg of plasmid DNA released from 50 wt% DNA matrix coatings on day 3 was diluted to 1 μg per well and was complexed with Lipofectamine™ before introduction to cell culture. The transfection result of DNA matrix coatings (13,000 ± 5,000 relative luminescence/mg total protein) was equivalent to 60% gene delivery efficiency, in comparison with unencapsulated, stock plasmid DNA of same amount. (D) This value was compared with the % gene delivery efficiency obtained by DNA NP coating. (Grey bars = 3 days, black bars = 7 days, n = 3) *denotes statistical difference between the test groups and the untreated RAW 264.7
Cell transfection results for plasmid DNA released from 50 wt% DNA matrix coatings were also investigated. Plasmid DNA released was collected on day 3, measured at 28.5 ± 0.3 μg, and introduced to cells at 1 μg of plasmid DNA per well for standard transfection procedures (Figure 6C). The luciferase activity of plasmid DNA released from matrix coatings (13,000 ± 5,000 relative luminescence/mg total protein) was lower than the anticipated activity from unencapsulated, stock plasmid DNA (22,000 ± 4,000 relative luminescence/mg total protein). However, it was consistent with the anticipated activity from the unencapsulated, lyophilized plasmid DNA, demonstrating that lyophilization affected plasmid DNA functional integrity. The gene delivery efficiency of DNA matrix coatings was calculated to be 60%, in comparison with the unencapsulated, stock plasmid DNA. Cells only, plasmid DNA without transfection agent, and Ficoll 400 blank coatings showed minimal background luminescence. Overall, although matrix coatings could achieve higher wt% loadings and greater quantity of mass released, their delivery efficiencies were lower than those obtained by NP coatings (Figures 6B and 6D).
4. Discussion
4.1 Assembly of NPs Loaded with Biomolecules
From our previous work with NP assembly on silicon oxide probe surface [13], we found that the zeta potential of a particle was an indicator of particle attachment to surface (i.e. particle density on surface). NP assembly was ideal at less negative zeta potential, because at more negative zeta potential the particle-to-particle repulsion would limit surface coverage. Particles would exert more repellent forces on their neighbors, thus preventing a tight packing of the particles [30-32]. We were able to lower the magnitude of a particle's zeta potential by increasing the salt concentration or adjusting the pH of the suspension buffer. In both cases, more cations were introduced into the system to adsorb onto the particle surface, thereby shielding the negative charges of the NPs. We were thus able to tune the extent of negatively charged NP attachment to a positively charged PLL modified probe surface. The optimal coating conditions from that study (10 mM HEPES, 100 mM NaCl, pH 7.4, at 0.5 mg/ml particle concentration for 30 min) was utilized in this study with NPs encapsulating biomolecules.
However in this current work, something in the DNA NP formulation decreased particle assembly on probe surface, despite the fact that both DEX NPs and DNA NPs had similar magnitudes of zeta potentials in the same buffer conditions. It is possible that differences in particle surface chemistry – not captured by the net zeta potential measurements – are at play here for the lower surface attraction of DNA NPs. When a surfactant is used for particle fabrication, the functional groups from the surfactant become associated on the particle surface and particles became charged accordingly [33-35]. NPs in this study were negatively charged, because the PEMA surfactant used for particle fabrication contained carboxyl groups (pKa = 2). However, when PLGA-PLL was utilized in DNA NP fabrication, PLL was also introduced to the particle surface. The chemical structure of PLL included an amine group, which at neutral pH would be positively charged (pKa = 10.5). Therefore, although the net zeta potential of DEX NPs and DNA NPs were similar in magnitudes, the actual surface chemistry was different between the two types of particles.
In order to attach the negatively charged NPs to the negatively charged silicon oxide probes, we modified the probe surface with positively charged PLL. PLL was previously demonstrated by Wittmer et al. [36, 37] to adsorb strongly on oxide surfaces for multilayering experiments and non-cytotoxic for cell culture studies. However, PLL on the DNA NP surface could potentially interact unfavorably with PLL on the probe surface, causing limited DNA NP adsorption. We utilized 25% of PLGA-PLL in our formulation, because it was the optimal percentage previously reported in Blum et al. [28] that had the highest plasmid DNA loading. We can potentially incorporate less percentage of PLGA-PLL copolymer in the DNA NP formulation to try to improve NP assembly on probe surface, but the trade-off is that will also decrease the plasmid DNA loading. Therefore, a balance between optimizing particle loading and particle assembly requires careful consideration. In short, although the net zeta potential is an important indicator of particle attachment to surface, it does not reveal the actual surface chemistry of a particle (i.e. types of functional groups), which might be a more accurate indicator of particle interaction with probe surface.
4.2 Properties of NP Coatings
For our NP coating system, the total mass of loaded molecules in the NP coatings depended mainly on the NP density on probe surface. Our optimized conditions are ideal for the assembly of NPs encapsulating hydrophobic molecules, because encapsulation of these molecules requires minimal changes to the existing formulation (i.e. they are soluble in the hydrophobic polymer/DCM solution) and will not affect the surface chemistry of the NP produced. DEX NPs in this study, for example, utilized methanol as a co-solvent during fabrication yet maintained the optimal NP density. Hydrophilic molecules, in contrast, may require additional polymers or chemicals to improve their encapsulation (i.e. they are mostly insoluble in the polymer/DCM solution), which can alter the surface chemistry of the NP produced. DNA NPs in this study, for example, utilized a mixture of 75% PLGA and 25% PLGA-PLL to improve encapsulation, which introduced PLL to the particle surface and reduced NP interaction with the PLL-coated probe surface. NP density on probe surface is therefore indirectly correlated to the hydrophobicity/ hydrophilicity property of the biomolecules, and individual optimization for each hydrophilic molecule is necessary.
Regardless of the amount of NPs attached to the probe surface, the fidelity of NP release kinetics was maintained in both NPs in bulk buffer suspension and NPs assembled on surface for 14 days. Figure 3B demonstrated that the cumulative percent release profiles of the NPs were identical, proving that NPs were not altered during the surface assembly and that there was no leakage of the encapsulated molecule during the assembly process. This fidelity of NP release kinetics is an important piece of information, when predicting the release profiles of other molecules from NP coatings (i.e. other drugs, proteins, and DNA). For example, other non-steroidal drugs such as ibuprofen and naproxen with similar anti-inflammatory effects could also be encapsulated into PLGA particles [38-40] and assembled onto the device surface. Their release kinetics are well-documented in literature, so their releases from NP coatings can be easily predicted. Therefore, our new NP coating system is a reliable and controllable delivery system.
The difference between our new NP coating system and the more established matrix coating system is in their release mechanisms [41-43]. Transport through the polymer phase is the route of release for hydrophobic molecules in matrix coatings, such as DEX release in this study. For hydrophilic molecules, transport through fluid-filled pores is the route of release from matrix coatings. Fluid-filled pores are created by the influx of water molecules and dissolution of the loaded molecules. At low loadings, the pores would be spread widely apart and disconnected, and hydrophilic molecules would not be releasable. Therefore, a co-dispersant is typically added to the matrix formulation to increase the molecule/pore density to facilitate the release though interconnected pores. In this study, Ficoll 400 was added as a co-dispersant for DNA release from matrix coatings. NPs do not require additional co-dispersants for release of encapsulated molecules. Their release kinetics is governed by the diffusion through the polymer and biodegradation of the polymer [14, 44],1 which in turn can be tailored by changing the polymer properties.
Lastly, SEM images demonstrated that NPs were stable on the probe surface up to 14 days at 37 °C in PBS incubation, at both high particle density (DEX NPs) and low density (DNA NPs). Since “bulk erosion” of PLGA polymer begins only after two months after start of buffer incubation [45]1, the minimal biodegradation of the NP coating during the two-week period was not detectable under SEM. This observation is consistent with other literature references that cited work with pre-degraded PLGA particles [46, 47]. In our previous work [13], we also determined that transport of particles within a distance from surface on the order of the particle diameter was largely diffusive, and thus not strongly influenced by flow. (Please refer to our previous work for explanations of the calculation and equation used).
4.3 Advantages and Limitations of NP Coatings
In comparison with the matrix coatings, our NP coatings have advantages and disadvantages over the more established method (Table 2). One limitation in our new method is the inherent lower loading capability for NP coatings, which is dependent on the loading of the NPs and the NP density on probe surface. As previously discussed in section 4.2, both parameters are dependent on the hydrophobicity/ hydrophilicity property of the loaded molecule during the emulsion process, which involves two immiscible liquid phases. Matrix coatings, in contrast, utilize only one solvent phase to dissolve the polymer and the loaded molecule. Once the solvent is removed and the matrix is hardened, the molecule remains encapsulated in the solid polymer matrix, regardless of its initial solubility in the solvent. The encapsulation efficiency for matrix coatings is therefore near 100%. Due to this inherent fabrication difference, matrix coatings can be loaded in different wt% up to 50 wt% with ease. They can also be loaded with higher total mass than NP coatings, as demonstrated by Figures 3A and 5A.
Table 2.
Advantages and Limitations of Nanoparticle Coatings.
| Type of Coating | Loading | Release Rate | Delivery Efficiencyb |
|---|---|---|---|
| Nanoparticle Assembly |
|
|
|
| Matrix Thin-Film |
|
|
|
from Lo, et al. Biomaterials 30(28), 2009
from current work, in comparison with unencapsulated molecules
Despite the lower mass release capability, NP coatings in this study were more efficient in inducing biological responses from macrophage cell cultures than matrix coatings. NP coatings released 4.6 ± 0.1 ng/mm2 of DEX after 7 days of incubation with cells, which corresponded to >100% drug delivery efficiency (Figure 6B). Matrix coatings, in contrast, released 493.5 ± 3.2 ng/mm2 (10 μm thick 10 wt% loading) and 2,493.5 ± 101.6 ng/mm2 (10 μm thick 50 wt% loading) of DEX respectively but were only 90% efficient in inducing the expected biological responses from the macrophage cells. The high drug delivery efficiency observed for the DEX NP coatings was expected for a typical controlled delivery system, when compared to a single dose of the unencapsulated drug. Given that the biological half-life of DEX is about 48 h [48, 49] and in the case of the unencapsulated drug, only ∼3 ng of the initial 25 ng/ml dose remained bioactive after 7 days of cell culture exposure. In contrast, the polymer in DEX NPs protected the encapsulated drug and provided a continuous release of the drug over the 7 day period, leading to a higher net accumulation of bioactive drugs in the cell culture (∼5 ng). Therefore, it is not surprising that DEX NPs outperformed a single dose of the unencapsulated drug in inducing a greater macrophage cell response. This result is also consistent with other literature reports on the greater bioactivity of molecules encapsulated into NPs compared to unencapsulated molecules [50-52].
However, cell responses can become slower when cells are overexposed to an extremely high dosage of a potent drug, such as the case with DEX matrix coatings. One mechanism of DEX induced macrophage cell number reduction is associated with the glucocorticoid receptor binding and the subsequent suppression of macrophage cell growth [22-24]. Therefore, when the macrophage cells were exposed to high dosage of DEX, it is possible that the glucocorticoid receptors on the cell surface were saturated and thus limited the cell responses [53, 54], despite the large quantity of the drug available in the cell culture. This case of slower cell response is also dependent on the rate of receptor internalization, recycling, and regulation [55, 56]. According to the supplier (Sigma-Aldrich), the potent range of unencapsulated DEX in most cell cultures is 4-500 ng/ml. In our dose response curve (Figure 5A insert), we observed a decrease in cell culture response rate when cells were exposed to DEX in ≥ 1,000 ng/ml, which was also the range of DEX released from matrix coatings. This reduction of cell response rate is maintained when cells are continuously exposed to high dosage of the potent drug, without given the proper amount of time to recover. For the 10 wt% DEX matrix coatings, for example, ∼2,300 ng of bioactive DEX remained in cell culture after 7 days (from initial dose of 15,000 ng/ml), compared to ∼1,900 ng from single dose of unencapsulated DEX. Therefore, although matrix coatings can provide controlled delivery of biomolecules in high dosages, this trait might not be desirable in the case of potent DEX molecules. We believe that the NP coatings are more suitable than matrix coatings in low-dose delivery of potent therapeutic agents.
Our belief is further strengthened by the transfection results obtained for DNA NP coatings. For highly potent therapeutic agents such as plasmid DNA, a minimal amount can be highly effective and is often desired to minimize unwanted side effects. Our NP coating was capable of inducing a visible biological effect with transfection of the luciferase gene, with only ∼0.6 ng/mm2 of plasmid DNA released. The encapsulated plasmid DNA also retained 100% of its transfection ability, in comparison with the unencapsulated, stock plasmid DNA (Figure 6D). DNA matrix coating (10 μm thick 50 wt% loading), in contrast, was highly loaded and released up to 153.2 ± 1.6 ng/mm2 of plasmid DNA during the same incubation period. However, the encapsulation of plasmid DNA in the matrix system required lyophilization of the liquid stock plasmid DNA before incorporation into the matrix coating. The released plasmid DNA from matrix coating was tested and found to retain only 60% of its transfection ability, in comparison with the unencapsulated, stock plasmid DNA. This 60% transfection was identical to the results obtained from using unencapsulated, lyophilized plasmid DNA. It appeared that the lyophilization process in DNA matrix fabrication compromised plasmid DNA functional integrity, which is consistent with previous reports that lyophilization decreased plasmid DNA transfection efficiency [57, 58]. Therefore, despite the lower mass released, our new NP coatings were more efficient than the established matrix coatings in maintaining the bioactivity of the encapsulated molecules and more advantageous for delivery of potent therapeutic agents.
We realize that it is possible that NPs on the probe surface are phagocytized by adherent macrophages. In many cases, macrophage phagocytosis is undesirable for delivery systems, because it removes the delivery vehicles and prevents the therapeutic agents from reaching the target site. However, when blockade of inflammation is the goal, phagocytosis could be beneficial for the NP coating system, as it targets the macrophage cells associated with tissue inflammation [59]. In gene delivery in particular, we anticipate that macrophage phagocytosis of DNA NPs will facilitate plasmid DNA uptake, without the additional need of transfection agents that are often inflammatory themselves [60]. The transfected macrophage cells can then produce proteins that are needed to reduce inflammation or to enhance cell survival around the implant site. Therefore, macrophage phagocytosis could be beneficial to delivery systems designed for regulation of local inflammatory or immune responses.
5. Conclusion
In this study, we demonstrated that DEX and plasmid DNA can be released from NPs assembled onto a material surface, and that the amount released was sufficient to induce relevant biological responses. We observed that the loading of NP coating was determined by the particle density on a probe surface, which was dependent on the solubility of the biomolecules in the emulsion and the surface chemistry of the NPs produced. Regardless of particle density, the release kinetics from NPs on surface was identical to NPs in bulk PBS suspension, making the NP coating system highly reliable and easily predictable. NPs were also stable and remained attached to probe surface, even after 14 days of PBS incubation at 37 °C. Therefore, our newly proposed coating system is well-controlled, stable, and reproducible. Additionally, we evaluated the advantages and limitations of our NP delivery system in comparison with a more established matrix system. Although the total mass released from the NP coatings was lower than matrix coatings, our system is more versatile and efficient in delivery of biomolecules and better suited for continuous release of potent therapeutic agents.
Supplementary Material
DNA NPs fabricated with pure PLGA had a high burst release phase (∼80% for the initial 3 days), while NPs fabricated with 75% PLGA + 25% PLGA-PLL copolymer was better at retaining the DNA for a longer continuous release (∼50% for initial 3 days). Plasmid DNA encapsulated was GFP-encoding plasmid DNA. (-■- PLGA NPs, -○-PLGA-PLL NPs, n=3) For symbols without error bars, the standard deviation of the measurements was smaller than the size of the symbol.
Acknowledgments
This work was supported by grant #NS45236 from the National Institutes of Health and the NIH Neuroengineering Pre-Doctoral Training Grant. CTL thanks Dr. Yen Cu for her technical advice on plasmid DNA encapsulation and cell transfection studies. The authors would also like to acknowledge Dr. Amarilys Sanchez-Santos for her helpful discussions on NP formulations, as well as Dr. Keith Neeves and Dr. Jian Tan for providing the silicon oxide probes.
Footnotes
Website of polymer properties and technical information for Birmingham Polymers: www.birminghampolymers.com/tech.html.
Publisher's Disclaimer: This is a PDF file of an unedited manuscript that has been accepted for publication. As a service to our customers we are providing this early version of the manuscript. The manuscript will undergo copyediting, typesetting, and review of the resulting proof before it is published in its final citable form. Please note that during the production process errors may be discovered which could affect the content, and all legal disclaimers that apply to the journal pertain.
References
- 1.Cui XY, Wiler J, Dzaman M, Altschuler RA, Martin DC. In vivo studies of polypyrrole/peptide coated neural probes. Biomaterials. 2003;24(5):777–87. doi: 10.1016/s0142-9612(02)00415-5. [DOI] [PubMed] [Google Scholar]
- 2.Zhong Y, Yu X, Gilbert R, Bellamkonda RV. Stabilizing electrode-host interfaces: a tissue engineering approach. J Rehabil Res Dev. 2001;38(6):627–32. [PubMed] [Google Scholar]
- 3.Seymour JP, Kipke DR. Neural probe design for reduced tissue encapsulation in CNS. Biomaterials. 2007;28(25):3594–607. doi: 10.1016/j.biomaterials.2007.03.024. [DOI] [PubMed] [Google Scholar]
- 4.Cui XY, Lee VA, Raphael Y, Wiler JA, Hetke JF, Anderson DJ, et al. Surface modification of neural recording electrodes with conducting polymer/biomolecule blends. J Biomed Mater Res. 2001;56(2):261–72. doi: 10.1002/1097-4636(200108)56:2<261::aid-jbm1094>3.0.co;2-i. [DOI] [PubMed] [Google Scholar]
- 5.Kam L, Shain W, Turner JN, Bizios R. Selective adhesion of astrocytes to surfaces modified with immobilized peptides. Biomaterials. 2002;23(2):511–5. doi: 10.1016/s0142-9612(01)00133-8. [DOI] [PubMed] [Google Scholar]
- 6.Xiao YH, Martin DC, Cui XY, Shenai M. Surface modification of neural probes with conducting polymer poly(hydroxymethylated-3,4-ethylenedioxythiophene) and its biocompatibility. Appl Biochem Biotechnol. 2006;128(2):117–29. doi: 10.1385/abab:128:2:117. [DOI] [PubMed] [Google Scholar]
- 7.Shain W, Spataro L, Dilgen J, Haverstick K, Retterer S, Isaacson M, et al. Controlling cellular reactive responses around neural prosthetic devices using peripheral and local intervention strategies. IEEE Trans Neural Syst Rehabil Eng. 2003;11(2):186–8. doi: 10.1109/TNSRE.2003.814800. [DOI] [PubMed] [Google Scholar]
- 8.Kim DH, Martin DC. Sustained release of dexamethasone from hydrophilic matrices using PLGA nanoparticles for neural drug delivery. Biomaterials. 2006;27(15):3031–7. doi: 10.1016/j.biomaterials.2005.12.021. [DOI] [PubMed] [Google Scholar]
- 9.Wadhwa R, Lagenaur CF, Cui XT. Electrochemically controlled release of dexamethasone from conducting polymer polypyrrole coated electrode. J Control Release. 2006;110(3):531–41. doi: 10.1016/j.jconrel.2005.10.027. [DOI] [PubMed] [Google Scholar]
- 10.Decher G, Lvov Y, Schmitt J. Proof of multilayer structural organization in self-assembled polycation polyanion molecular films. Thin Solid Films. 1994;244(12):772–7. [Google Scholar]
- 11.Decher G. Fuzzy nanoassemblies: toward layered polymeric multicomposites. Science. 1997;277(5330):1232–7. [Google Scholar]
- 12.Norton LW, Tegnell E, Toporek SS, Reichert WM. In vitro characterization of vascular endothelial growth factor and dexamethasone releasing hydrogels for implantable probe coatings. Biomaterials. 2005;26(16):3285–97. doi: 10.1016/j.biomaterials.2004.07.069. [DOI] [PubMed] [Google Scholar]
- 13.Lo CT, Van Tassel PR, Saltzman WM. Simultaneous release of multiple molecules from poly(lactide-co-glycolide) nanoparticles assembled onto medical devices. Biomaterials. 2009;30(28):4889–97. doi: 10.1016/j.biomaterials.2009.05.074. [DOI] [PMC free article] [PubMed] [Google Scholar]
- 14.Anderson JM, Shive MS. Biodegradation and biocompatibility of PLA and PLGA microspheres. Adv Drug Deliv Rev. 1997;28(1):5–24. doi: 10.1016/s0169-409x(97)00048-3. [DOI] [PubMed] [Google Scholar]
- 15.Athanasiou KA, Niederauer GG, Agrawal CM. Sterilization, toxicity, biocompatibility and clinical applications of polylactic acid polyglycolic acid copolymers. Biomaterials. 1996;17(2):93–102. doi: 10.1016/0142-9612(96)85754-1. [DOI] [PubMed] [Google Scholar]
- 16.Emerich DF, Tracy MA, Ward KL, Figueiredo M, Qian RL, Henschel C, et al. Biocompatibility of poly (DL-lactide-co-glycolide) microspheres implanted into the brain. Cell Transplant. 1999;8(1):47–58. doi: 10.1177/096368979900800114. [DOI] [PubMed] [Google Scholar]
- 17.Pharriss BB, Erickson R, Bashaw J, Hoff S, Place VA, Zaffaroni A. Progestasert: a uterine therapeutic system for long-term contraception: I. philosophy and clinical efficacy. Fertil Steril. 1974;25(11):915–21. doi: 10.1016/s0015-0282(16)40748-x. [DOI] [PubMed] [Google Scholar]
- 18.Langer R, Brem H, Tapper D. Biocompatibility of polymeric delivery systems for macromolecules. J Biomed Mater Res. 1981;15(2):267–77. doi: 10.1002/jbm.820150212. [DOI] [PubMed] [Google Scholar]
- 19.Peng ZH, Imai Y, Nakabayashi N, Watanabe A. Evaluation of the biocompatibility of polymeric materials. Tokyo Ika Shika Daigaku Iyo Kizai Kenkyusho Hokoku. 1982;16:49–53. [PubMed] [Google Scholar]
- 20.Beer HD, Fassler R, Werner S. Glucocorticoid-regulated gene expression during cutaneous wound repair. Vitam Horm. 2000;59:217–39. doi: 10.1016/s0083-6729(00)59008-6. [DOI] [PubMed] [Google Scholar]
- 21.Goulding N, Flower R. Glucocorticoids. Boston: Birkhauser Verlag; 2001. [Google Scholar]
- 22.Zhu XY, Liu YJ, Lu J, Xu RB. Knockdown of glucocorticoid receptor expression by RNA interference promotes cell proliferation in murine macrophage RAW264.7 cells. J Steroid Biochem Mol Biol. 2004;92(5):375–82. doi: 10.1016/j.jsbmb.2004.07.010. [DOI] [PubMed] [Google Scholar]
- 23.Wang X, Li Y, Zhu X, Wang Y, Diao F, Lu J. Signal regulatory protein alpha1 is involved in the inhibitory effect of glucocorticoid receptor on the proliferation of murine macrophage RAW264.7 cell and mouse peritoneal macrophage. J Mol Endocrinol. 2008;41(5):393–403. doi: 10.1677/JME-08-0021. [DOI] [PubMed] [Google Scholar]
- 24.Wang X, Chen Y, Wang Y, Zhu X, Ma Y, Zhang S, et al. Role of RHOB in the antiproliferative effect of glucocorticoid receptor on macrophage RAW264.7 cells. J Endocrinol. 2009;200(1):35–43. doi: 10.1677/JOE-08-0340. [DOI] [PubMed] [Google Scholar]
- 25.Sharkawy AA, Klitzman B, Truskey GA, Reichert WM. Engineering the tissue which encapsulates subcutaneous implants. I. diffusion properties. J Biomed Mater Res. 1997;37(3):401–12. doi: 10.1002/(sici)1097-4636(19971205)37:3<401::aid-jbm11>3.0.co;2-e. [DOI] [PubMed] [Google Scholar]
- 26.Sharkawy AA, Klitzman B, Truskey GA, Reichert WM. Engineering the tissue which encapsulates subcutaneous implants. II. plasma-tissue exchange properties. J Biomed Mater Res. 1998;40(4):586–97. doi: 10.1002/(sici)1097-4636(19980615)40:4<586::aid-jbm10>3.0.co;2-e. [DOI] [PubMed] [Google Scholar]
- 27.Sharkawy AA, Klitzman B, Truskey GA, Reichert WM. Engineering the tissue which encapsulates subcutaneous implants. III. effective tissue response times. J Biomed Mater Res. 1998;40(4):598–605. doi: 10.1002/(sici)1097-4636(19980615)40:4<598::aid-jbm11>3.0.co;2-c. [DOI] [PubMed] [Google Scholar]
- 28.Blum JS, Saltzman WM. High loading efficiency and tunable release of plasmid DNA encapsulated in submicron particles fabricated from PLGA conjugated with poly-L-lysine. J Control Release. 2008;129(1):66–72. doi: 10.1016/j.jconrel.2008.04.002. [DOI] [PMC free article] [PubMed] [Google Scholar]
- 29.Gomez-Gaete C, Tsapis N, Besnard M, Bochot A, Fattal E. Encapsulation of dexamethasone into biodegradable polymeric nanoparticles. Int J Pharm. 2007;331(2):153–9. doi: 10.1016/j.ijpharm.2006.11.028. [DOI] [PubMed] [Google Scholar]
- 30.Grabar KC, Smith PC, Musick MD, Davis JA, Walter DG, Jackson MA, et al. Kinetic control of interparticle spacing in Au colloid-based surfaces: rational nanometer-scale architecture. J Am Chem Soc. 1996;118(5):1148–53. [Google Scholar]
- 31.Thill A, Spalla O. Capillary against adhesion forces during drying of particle submonolayers on a solid substrate. Langmuir. 2002;18(12):4783–9. [Google Scholar]
- 32.Vakarelski IU, McNamee CE, Higashitani K. Deposition of silica nanoparticles on a gold surface via a self-assembled monolayer of (3-mercaptopropyl)trimethoxysilane. Colloids Surf A. 2007;295(13):16–20. [Google Scholar]
- 33.Shakesheff KM, Evora C, Soriano I, Langer R. The adsorption of poly(vinyl alcohol) to biodegradable microparticles studied by x-ray photoelectron spectroscopy (XPS) J Colloid Interface Sci. 1997;185(2):538–47. doi: 10.1006/jcis.1996.4637. [DOI] [PubMed] [Google Scholar]
- 34.Lee SC, Oh JT, Jang MH, Chung SI. Quantitative analysis of polyvinyl alcohol on the surface of poly(D,L-lactide-co-glycolide) microparticles prepared by solvent evaporation method: effect of particle size and PVA concentration. J Control Release. 1999;59(2):123–32. doi: 10.1016/s0168-3659(98)00185-0. [DOI] [PubMed] [Google Scholar]
- 35.Keegan ME, Falcone JL, Leung TC, Saltzman WM. Biodegradable microspheres with enhanced capacity for covalently bound surface ligands. Macromolecules. 2004;37(26):9779–84. [Google Scholar]
- 36.Wittmer CR, Van Tassel PR. Probing adsorbed fibronectin layer structure by kinetic analysis of monoclonal antibody binding. Colloids Surf B Biointerfaces. 2005;41(23):103–9. doi: 10.1016/j.colsurfb.2004.10.030. [DOI] [PubMed] [Google Scholar]
- 37.Wittmer CR, Phelps JA, Saltzman WM, Van Tassel PR. Fibronectin terminated multilayer films: protein adsorption and cell attachment studies. Biomaterials. 2007;28(5):851–60. doi: 10.1016/j.biomaterials.2006.09.037. [DOI] [PMC free article] [PubMed] [Google Scholar]
- 38.Bozdag S, Calis S, Kas HS, Ercan MT, Peksoy I, Hincal AA. In vitro evaluation and intra-articular administration of biodegradable microspheres containing naproxen sodium. J Microencapsul. 2001;18(4):443–56. doi: 10.1080/02652040010018641. [DOI] [PubMed] [Google Scholar]
- 39.Calis S, Bozdag S, Kas HS, Tuncay M, Hincal AA. Influence of irradiation sterilization on poly(lactide-co-glycolide) microspheres containing anti-inflammatory drugs. Farmaco. 2002;57(1):55–62. doi: 10.1016/s0014-827x(01)01171-5. [DOI] [PubMed] [Google Scholar]
- 40.Fernandez-Carballido A, Herrero-Vanrell R, Molina-Martinez IT, Pastoriza P. Biodegradable ibuprofen-loaded PLGA microspheres for intraarticular administration: effect of Labrafil addition on release in vitro. Int J Pharm. 2004;279(12):33–41. doi: 10.1016/j.ijpharm.2004.04.003. [DOI] [PubMed] [Google Scholar]
- 41.Paul DR, Mcspadden SK. Diffusional release of a solute from a polymer matrix. J Membr Sci. 1976;1(1):33–48. [Google Scholar]
- 42.Rhine WD, Hsieh DS, Langer R. Polymers for sustained macromolecule release: procedures to fabricate reproducible delivery systems and control release kinetics. J Pharm Sci. 1980;69(3):265–70. doi: 10.1002/jps.2600690305. [DOI] [PubMed] [Google Scholar]
- 43.Saltzman WM. Drug delivery. New York: Oxford University Press; 2001. [Google Scholar]
- 44.Chasin M, Langer R. Biodegradable polymers as drug delivery systems. 1st. Informa HealthCare; 1990. [Google Scholar]
- 45.Lewis DH. Controlled release of bioactive agents from lactide/glycolide polymers. In: Chasin M, Langer R, editors. Biodegradable polymers as drug delivery systems. New York: Marcel Dekker, Inc.; 1990. [Google Scholar]
- 46.Hickey T, Kreutzer D, Burgess DJ, Moussy F. Dexamethasone/PLGA microspheres for continuous delivery of an anti-inflammatory drug for implantable medical devices. Biomaterials. 2002;23(7):1649–56. doi: 10.1016/s0142-9612(01)00291-5. [DOI] [PubMed] [Google Scholar]
- 47.Hickey T, Kreutzer D, Burgess DJ, Moussy F. In vivo evaluation of a dexamethasone/PLGA microsphere system designed to suppress the inflammatory tissue response to implantable medical devices. J Biomed Mater Res. 2002;61(2):180–7. doi: 10.1002/jbm.10016. [DOI] [PubMed] [Google Scholar]
- 48.Goodman, Gilman . The pharmacological basis of therapeutics. 8th. McGraw-Hill; 1992. [Google Scholar]
- 49.van Boxtel CJ, Santoso B, Edwards IR. Drug benefits and risks: international textbook of clinical pharmacology. 2nd. New York: John Wiley & Sons, Inc.; 2008. [Google Scholar]
- 50.Shen H, Ackerman AL, Cody V, Giodini A, Hinson ER, Cresswell P, et al. Enhanced and prolonged cross-presentation following endosomal escape of exogenous antigens encapsulated in biodegradable nanoparticles. Immunology. 2006;117(1):78–88. doi: 10.1111/j.1365-2567.2005.02268.x. [DOI] [PMC free article] [PubMed] [Google Scholar]
- 51.Sawyer AJ, Piepmeier JM, Saltzman WM. New methods for direct delivery of chemotherapy for treating brain tumors. Yale J Biol Med. 2006;79(34):141–52. [PMC free article] [PubMed] [Google Scholar]
- 52.Liu J, Jiang Z, Zhang S, Saltzman WM. Poly(omega-pentadecalactone-co-butylene-co-succinate) nanoparticles as biodegradable carriers for camptothecin delivery. Biomaterials. 2009;30(29):5707–19. doi: 10.1016/j.biomaterials.2009.06.061. [DOI] [PMC free article] [PubMed] [Google Scholar]
- 53.Peper A. A theory of drug tolerance and dependence I: a conceptual analysis. J Theor Biol. 2004;229(4):477–90. doi: 10.1016/j.jtbi.2004.04.010. [DOI] [PubMed] [Google Scholar]
- 54.Peper A. A theory of drug tolerance and dependence II: the mathematical model. J Theor Biol. 2004;229(4):491–500. doi: 10.1016/j.jtbi.2004.04.009. [DOI] [PubMed] [Google Scholar]
- 55.Wang Y, Ghezzi A, Yin JC, Atkinson NS. CREB regulation of BK channel gene expression underlies rapid drug tolerance. Genes Brain Behav. 2009;8(4):369–76. doi: 10.1111/j.1601-183X.2009.00479.x. [DOI] [PMC free article] [PubMed] [Google Scholar]
- 56.Kitanaka N, Kitanaka J, Hall FS, Tatsuta T, Morita Y, Takemura M, et al. Alterations in the levels of heterotrimeric G protein subunits induced by psychostimulants, opiates, barbiturates, and ethanol: Implications for drug dependence, tolerance, and withdrawal. Synapse. 2008;62(9):689–99. doi: 10.1002/syn.20543. [DOI] [PMC free article] [PubMed] [Google Scholar]
- 57.Poxon SW, Hughes JA. The effect of lyophilization on plasmid DNA activity. Pharm Dev Technol. 2000;5(1):115–22. doi: 10.1081/pdt-100100526. [DOI] [PubMed] [Google Scholar]
- 58.Costantino HR, Pikal MJ. Lyophilization of biopharmaceuticals. American Association of Pharmaceuticals Scientists; 2005. [Google Scholar]
- 59.Chellat F, Merhi Y, Moreau A, Yahia L. Therapeutic potential of nanoparticulate systems for macrophage targeting. Biomaterials. 2005;26(35):7260–75. doi: 10.1016/j.biomaterials.2005.05.044. [DOI] [PubMed] [Google Scholar]
- 60.Massich MD, Giljohann DA, Seferos DS, Ludlow LE, Horvath CM, Mirkin CA. Regulating immune response using polyvalent nucleic acid-gold nanoparticle conjugates. Mol Pharm. 2009;6(6):1934–40. doi: 10.1021/mp900172m. [DOI] [PMC free article] [PubMed] [Google Scholar]
Associated Data
This section collects any data citations, data availability statements, or supplementary materials included in this article.
Supplementary Materials
DNA NPs fabricated with pure PLGA had a high burst release phase (∼80% for the initial 3 days), while NPs fabricated with 75% PLGA + 25% PLGA-PLL copolymer was better at retaining the DNA for a longer continuous release (∼50% for initial 3 days). Plasmid DNA encapsulated was GFP-encoding plasmid DNA. (-■- PLGA NPs, -○-PLGA-PLL NPs, n=3) For symbols without error bars, the standard deviation of the measurements was smaller than the size of the symbol.