

Abstract
The subclass Theria of Mammalia includes marsupials (infraclass Metatheria) and placentals (infraclass Eutheria). Within each group, interordinal relationships remain unclear. One limitation of many studies is incomplete ordinal representation. Here, we analyze DNA sequences for part of exon 1 of the interphotoreceptor retinoid binding protein gene, including 10 that are newly reported, for representatives of all therian orders. Among placentals, the most robust clades are Cetartiodactyla, Paenungulata, and an expanded African clade that includes paenungulates, tubulidentates, and macroscelideans. Anagalida, Archonta, Altungulata, Hyracoidea + Perissodactyla, Ungulata, and the “flying primate” hypothesis are rejected by statistical tests. Among marsupials, the most robust clade includes all orders except Didelphimorphia. The phylogenetic placement of the monito del monte and the marsupial mole remains unclear. However, the marsupial mole sequence contains three frameshift indels and numerous stop codons in all three reading frames. Given that the interphotoreceptor retinoid binding protein gene is a single-copy gene that functions in the visual cycle and that the marsupial mole is blind with degenerate eyes, this finding suggests that phenotypic degeneration of the eyes is accompanied by parallel changes at the molecular level as a result of relaxed selective constraints.
Keywords: mammalian phylogenetics, Notoryctes, pseudogene
Marsupials (infraclass Metatheria) and placentals (infraclass Eutheria) together compose the subclass Theria of Mammalia. Among extant taxa, there are five to seven marsupial orders (1–3) and 18 placental orders (4) (Table 1). Within each subclass, it has proven difficult to resolve higher level relationships. Nevertheless, numerous phylogenies have been hypothesized and serve as a framework for examining questions in higher level mammal phylogeny.
Table 1.
Classification of therian mammals
| Subclass Theria |
| Infraclass Metatheria (marsupials) |
| Order Dasyuromorphia (Phascogale = phascogale) |
| Order Didelphimorphia (Didelphis = opossum) |
| Order Diprotodontia (Pseudochirops = ringtail possum; Vombatus = wombat) |
| Order Microbiotheria (Dromiciops = monito del monte) |
| Order Notoryctemorphia (Notoryctes = marsupial mole) |
| Order Paucituberculata (Caenolestes = shrew opossum) |
| Order Peramelina (Echymipera = bandicoot) |
| Infraclass Eutheria (placentals) |
| Order Artiodactyla (Bos = cow; Sus = pig) |
| Order Carnivora (Felis = cat) |
| Order Cetacea (Balaenoptera = whale; Steno = rough-toothed dolphin) |
| Order Chiroptera (Cynopterus = dog-faced bat; Megaderma = false vampire bat; Pteropus = flying fox; Tonatia = round-eared bat) |
| Order Dermoptera (Cynocephalus = flying lemur) |
| Order Hyracoidea (Procavia = hyrax) |
| Order Insectivora (Erinaceus = hedgehogs; Sorex = shrew) |
| Order Lagomorpha (Oryctolagus = rabbit) |
| Order Macroscelidea (Elephantulus = elephant shrew) |
| Order Perissodactyla (Equus = horse) |
| Order Pholidota (Manis = pangolin) |
| Order Primates (Galago = galago; Homo = human; Tarsius = tarsier) |
| Order Proboscidea (Loxodonta = elephant) |
| Order Rodentia (Mus = mouse; Spalax = blind mole rat) |
| Order Scandentia (Tupaia = tree-shrew) |
| Order Sirenia (Dugong = dugong; Trichechus = manatee) |
| Order Tubulidentata (Orycteropus = aardvark) |
| Order Xenarthra (Bradypus = sloth) |
Among living marsupials, there is uncertainty centering on the earliest cladogenic events. Most workers (1, 2, 5) advocate a fundamental division between American marsupials, excepting the South American microbiothere Dromiciops gliroides (monito del monte) and Australasian marsupials plus Dromiciops. The American taxa (Ameridelphia) are united by the presumed shared derived character of epididymal sperm-pairing (6). Australasian taxa and Dromiciops (Australidelphia), in turn, exhibit a derived morphology of the tarsus that facilitates improved grasping (3, 7). Other hypotheses reject this fundamental split between ameridelphians and australidelphians and postulate Dromiciops (8), caenolestids (3), and didelphids (9), respectively, as the sister taxon to other living marsupials.
Relationships among Australidelphia, assuming monophyly of this group, also are unclear. Dromiciops has been hypothesized as a sister taxon to (i) all other australidelphians (2, 7), (ii) dasyuromorphs (3, 10), and (iii) diprotodontians (11, 12). The latter hypothesis derives from single-copy DNA hybridization experiments, which also place bandicoots outside of a clade that includes diprotodontians, Dromiciops, and dasyuromorphs (11, 12). The association of Dromiciops with diprotodontians is inconsistent with the conventional view that diprotodontians and bandicoots are sister taxa based on the occurrence of syndactyly in these taxa (13, 14). Syndactyly is a condition in which the second and third digits of the hind foot are variably reduced and always are joined together by a common integument (13, 14). One implication of the single-copy DNA results is that syndactyly may not be homologous in diprotodontians and bandicoots and that it evolved independently in these two groups or else was lost in other taxa (e.g., Dromiciops and dasyuromorphs) after evolving in a more basal common ancestor (12, 15).
Another enigmatic taxon is the marsupial mole, Notoryctes typhlops, which is the only living representative of the order Notoryctemorphia. Notoryctes possesses numerous autapomorphic features related to its fossorial lifestyle and has been hypothesized to be a relative of diprotodontians (2, 16, 17), dasyurids (18, 19), and bandicoots (3).
Relationships among placental orders are equally controversial. At the base of the placental radiation, several studies suggest that xenarthrans or xenarthrans plus pholidotans are the sister group to other placental mammals, collectively termed the “Epitheria” (20–26).
Among the epitherian superorders, Archonta, Glires, Paenungulata, and Cetartiodactyla have received considerable attention. Archonta (27) includes the orders Chiroptera, Primates, Scandentia, and Dermoptera. Only a few anatomical features (e.g., pendulous penis, tarsal specializations) support the monophyly of this superorder (21, 28). Within this group, Novacek (29) and Simmons (30) suggest an association of chiropterans and dermopterans (=Volitantia) based on morphological data, and Pettigrew (31) has proposed a “flying primate” hypothesis in which Old World fruitbats (suborder Megachiroptera) are more closely related to dermopterans and primates than to microchiropterans. Molecular data provide some support for the association of Primates, Scandentia, and Dermoptera together but argue against the inclusion of chiropterans with this group (32–35).
The superorder Glires, which encompasses rodents and lagomorphs, is supported by craniodental and fetal membrane characters (22, 36). Morphological data also suggest an association of macroscelideans (elephant shrews) with Glires in the superorder Anagalida (37). Glires has been challenged based on an analysis of 91 orthologous protein sequences (38). Furthermore, Anagalida is contradicted by both nuclear and mitochondrial gene studies (35, 39–40). Even the seemingly secure monophyly of Rodentia is inconsistent by some molecular studies (42, 43) wherein myomorphs and caviomorphs do not cluster together.
Paenungulata (44) includes Proboscidea, Sirenia, and Hyracoidea. Although most workers agree that proboscideans and sirenians are closely related, the association of hyracoids with these orders is controversial, and a competing hypothesis unites hyraxes with perissodactyls. Morphological evidence for these competing hypotheses is divided (20, 23, 37, 45–49) whereas molecular evidence supports Paenungulata (35, 39, 41, 50, 51).
One of the strongest supported associations of placental orders is Cetartiodactyla (=Cetacea + Artiodactyla). Molecular evidence supports this association (35, 52) and further suggests that artiodactyls are paraphyletic with hippopotamids as a possible sister taxon to cetaceans (53–54). Ferungulata [sensu Krettek et al. (55)] is a more inclusive group that contains Cetartiodactyla, Perissodactyla, and Carnivora. Ungulata, as advocated by McKenna (20), includes cetartiodactyls, perissodactyls, and paenungulates. Archibald (56) suggested a more expansive Ungulata that also embraces tubulidentates. Presumed evidence for Ungulata includes the rectangular shape of the upper molars (56).
Among the gene sequences that have figured in testing and developing interordinal phylogenetic hypotheses is exon 1 of the interphotoreceptor retinoid binding protein (IRBP) gene (34, 35). IRBP is a single-copy gene that functions in the regeneration of rhodopsin in the visual cycle (57). Stanhope et al. (35) reported on a data set that included representatives of 17 of the 18 placental orders. By using xenarthrans as an outgroup, Stanhope et al. (35) found strong support for Cetartiodactyla, Paenungulata, and an expanded clade containing paenungulates, macroscelideans, and tubulidentates. However, it is questionable whether or not xenarthrans are an outgroup to other placental mammals (26, 58, 59). Here, we report 10 IRBP sequences and expand the data set of Stanhope et al. (35). The sequences include a hedgehog, a manatee, a pangolin, and seven marsupials. The present collection of sequences is a data set for a nuclear gene that includes representatives of every placental and marsupial order. This allows us to examine higher level questions in mammalian evolution in the context of a broad phylogenetic framework in which numerous marsupials and placentals serve as reciprocal outgroups to each other. The inclusion of multiple representatives from each mammalian infraclass also allows for subdivision of long branches to minimize the effects of homoplasy. In addition to the phylogenetic implications of the IRBP data, we report on the evolution of the IRBP gene in the marsupial mole, which is blind and has eyes that lack an iris and a lens. Specifically, indels and stop codons suggest that the Notoryctes IRBP gene is no longer evolving under purifying selection.
METHODS
DNA was extracted from seven marsupials (Caenolestes fuliginosus, Dromiciops gliroides, Echymipera kalubu, Phascogale tapoatafa, Notoryctes typhlops, Vombatus ursinus, and Pseudochirops cupreus) and three placentals (Manis sp., Erinaceus europaeus, and Trichechus manatus) as described elsewhere (34, 60). Part of exon 1 of the IRBP gene was amplified by using the primers +IRBP217 and −IRBP1531 (34) except for Caenolestes and Phascogale for which the primers IR-H (5′- aacctaatggggatgcaagaag-3′) and IR-I (5′-tccgayccccaaatgctggcca-3′), respectively, were substituted for IR-A. Marsupial PCR products were cloned into PCR II (Invitrogen) and sequenced (at least three clones) or sequenced directly by using the PCR Product Sequencing Kit (United States Biochemical). Placental PCR products were sequenced as described in Stanhope et al. (35). In all cases, both strands were sequenced. Accession numbers for the sequences are AF025381-AF025390. Additional sequences derive from previous analyses (34, 35). Table 1 lists the ordinal representation of taxa included in our study. Sequences were aligned by using clustal w (61) with minor adjustments by eye.
All phylogenetic analyses and tests were performed with paup 4.0d54, test version written by David L. Swofford. We retained third positions of codons in our analyses because they retain phylogenetic signal (62) at the interordinal level, i.e., by using a single representative from each of the 25 orders, g1 = −0.818 (significant at P = 0.01). Full heuristic searches were used with maximum parsimony and maximum likelihood (ML) under the Hasegawa et al. (63) model of sequence evolution. Previous hypotheses (Table 2) were evaluated by using Templeton (64), Kishino–Hasegawa (65), and winning sites (66) tests. In cases in which hypothesized clades were supported on the best tree(s), we made comparisons with the best trees that constrained against the monophyly of these clades. When hypothesized clades did not occur on the best tree(s), we made comparisons with the best trees that constrained the monophyly of these clades.
Table 2.
Results of Kishino–Hasegawa, Templeton, and winning-sites tests
| Clade | Shortest tree with clade | Shortest tree without clade | KH-P | Templeton | Winning sites | -Ln likelihood with clade | -Ln likelihood without clade | KH-ML |
|---|---|---|---|---|---|---|---|---|
| Marsupial clades | ||||||||
| All except Didelphis | 3724 (2) | 3732 | 0.5737 | 0.6158 | 0.7078 | 18921.9577 | 18943.7639 | 0.3597 |
| All except Dromiciops | 3742 | 3724 (2) | 0.0605 | 0.1000 | 0.0405* | 18943.5070 | 18921.9577 | 0.1998 |
| Ameridelphia | 3732 | 3724 (2) | 0.5737 | 0.6158 | 0.7078 | 18937.6790 | 18921.9577 | 0.3862 |
| Australidelphia | 3724 (2) | 3727 | 0.6311 | 0.6714 | 0.8676 | 18921.9577 | 18926.6137 | 0.7369 |
| Notoryctes + Diprotodontia | 3730 (2) | 3724 (2) | 0.0488* | 0.0769 | 0.0886 | 18923.3736 | 18921.9577 | 0.8575 |
| Diprotodontia + Peramelina | 3731 (3) | 3724 (2) | 0.2543 | 0.3161 | 0.3179 | 18932.0427 | 18921.9577 | 0.5595 |
| Peramelina + Dasyuromorphia | 3724 (2) | 3728 (2) | 0.4725 | 0.5305 | 0.5903 | 18921.9577 | 18931.3186 | 0.5900 |
| Notoryctes + Dasyuromorphia | 3729 (4) | 3724 (2) | 0.3654 | 0.4292 | 0.4690 | 18931.3186 | 18921.9577 | 0.5900 |
| Placental clades | ||||||||
| Africana | 3724 (2) | 3753 (6) | 0.0204* | 0.0429* | 0.0248* | 18921.9577 | 19003.3833 | 0.0004* |
| Altungulata | 3778 (2) | 3724 (2) | <0.0001* | <0.0001* | <0.0001* | 19086.8585 | 18921.9577 | <0.0001* |
| Anagalida | 3775 (2) | 3724 (2) | <0.0001* | <0.0001* | <0.0001* | 19045.6117 | 18921.9577 | <0.0001* |
| Archonta | 3754 (2) | 3724 (2) | 0.0317* | 0.0614 | 0.0290* | 18996.6624 | 18921.9577 | 0.0084* |
| Archonta (-bats) | 3728 (10) | 3724 (2) | 0.4656 | 0.5200 | 0.5993 | 18922.8399 | 18921.9577 | 0.9063 |
| Cetartiodactyla | 3724 (2) | 3744 (10) | 0.0709 | 0.0995 | 0.0969 | 18921.9577 | 18962.4634 | 0.0791 |
| Edentata | 3740 (4) | 3724 (2) | 0.2232 | 0.2579 | 0.3283 | 18939.9958 | 18921.9577 | 0.3295 |
| Epitheria I | 3731 (12) | 3724 (2) | 0.5135 | 0.5622 | 0.6662 | 18937.9144 | 18921.9577 | 0.1871 |
| Epitheria II | 3753 (4) | 3724 (2) | 0.0116* | 0.0239* | 0.0235* | 18944.7378 | 18921.9577 | 0.1507 |
| Ferungulata | 3728 (2) | 3724 (2) | 0.5147 | 0.5676 | 0.6752 | 18921.9577 | 18926.9409 | 0.7198 |
| “Flying primate” | 3763 (1) | 3724 (2) | 0.0075* | 0.0137* | 0.0236* | 19045.1750 | 18921.9577 | 0.0003* |
| Glires | 3724 (2) | 3727 (6) | 0.7633 | 0.7992 | 0.6617 | 18921.9577 | 18932.9675 | 0.5426 |
| Hyracoidea + Perissodactyla | 3800 (2) | 3724 (2) | <0.0001* | <0.0001* | <0.0001* | 19155.6222 | 18921.9577 | <0.0001* |
| Paenungulata | 3724 (2) | 3735 (6) | 0.1689 | 0.2275 | 0.2229 | 18921.9577 | 18943.0474 | 0.0602 |
| Tethytheria | 3730 (2) | 3724 (2) | 0.1393 | 0.1883 | 0.2085 | 18930.8171 | 18921.9577 | 0.5398 |
| Ungulata I | 3785 (2) | 3724 (2) | <0.0001* | <0.0001* | <0.0001* | 19072.9924 | 18921.9577 | <0.0001* |
| Ungulata II | 3787 (2) | 3724 (2) | <0.0001* | <0.0001* | <0.0001* | 19118.4440 | 18921.9577 | <0.0001* |
| Volitantia | 3785 (50) | 3724 (2) | 0.0538 | 0.0879 | 0.1790 | 19002.5185 | 18921.9577 | 0.0208* |
Composition of superordinal clades is as follows: Ameridelphia = Didelphimorphia + Paucituberculata; Australidelphia = Dasyuromorphia + Diprotodontia + Microbiotheria + Notoryctemorphia + Peramelina; Africana = Macroscelidea + Paenungulata + Tubulidentata; Altungulata = Paenungulata + Perissodactyla; Anagalida = Glires + Macroscelidea; Archonta = Chiroptera + Dermoptera + Primates + Scandentia; Cetartiodactyla = Artiodactyla + Cetacea; Epitheria I = all placentals except Xenarthra; Epitheria II = Pholidota + Xenarthra as sister-group to other placentals; Ferungulata = Carnivora + Cetartiodactyls + Perissodactyla; “Flying Primate” = Dermoptera + Megachiroptera + Primates; Glires = Lagomorpha + Rodentia; Paenungulata = Hyracoidea + Proboscidea + Sirenia; Tethytheria = Proboscidea + Sirenia; Ungulata I = Cetartiodactyla + Paenungulata + Perissodactyla + Tubulidentata; Ungulata II = Cetartiodactyla + Paenungulata + Perissodactyla; Volitantia = Chiroptera + Dermoptera. Additional placental clades that could not be accepted or rejected based on statistical tests include Insectivora, Artiodactyla, and Chiroptera. Among marsupials, Dromiciops + Diprotodontia and Notoryctes + Peramelina were evaluated but could not be accepted or rejected. Asterisks indicate significant at P = 0.05. KH-P, Kishino–Hasegawa test for parsimony; KH-ML, Kishino–Hasegawa test for maximum likelihood.
RESULTS
Alignment.
Fig. 1 shows portions of the 1302-nt multiple alignment for four marsupials (Echymipera, Dromiciops, Vombatus, and Notoryctes). With the exception of Notoryctes, all sequences in the alignment were from ORFs without stop codons. Notoryctes shows four indels, three of which are not in multiples of three nucleotides. The first is an 11-nt deletion extending from position 38 to position 48, second is a 1-nt insertion at position 477, and, finally, a 1-nt deletion at position 1120. These indels do not complement each other to restore a correct reading frame; translation of the Notoryctes sequence in all three reading frames indicates the occurrence of nine, 15, and 10 stop codons, respectively.
Figure 1.
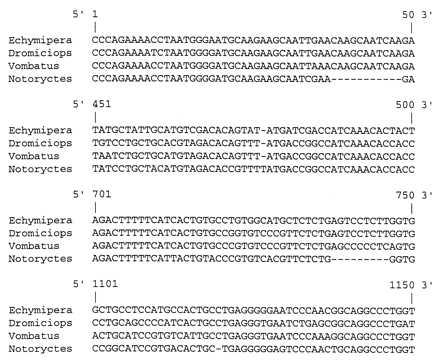
Selected regions of the IRBP alignment for four marsupials to illustrate the location of three deletions and one insertion in the Notoryctes sequence relative to other marsupials.
Phylogenetic Analyses.
The best ML tree is illustrated in Fig. 2. Two minimum length parsimony trees (not shown) were discovered at 3724 steps (consistency index = 0.436). A majority rule bootstrap consensus tree based on parsimony is depicted in Fig. 3. Among marsupials, Didelphis is excluded from a clade that includes representatives of all other marsupial orders on both the ML and maximum parsimony trees. Bootstrap support uniting all marsupials to the exclusion of Didelphis was 80%. None of the other interordinal associations among marsupials was this well supported. Several placental clades were supported above the 95% bootstrap level including Paenungulata (99%), the African clade (i.e., Paenungulata + Macroscelidea + Tubulidentata; 100%), and Cetacea + Artiodactyla (100%).
Figure 2.
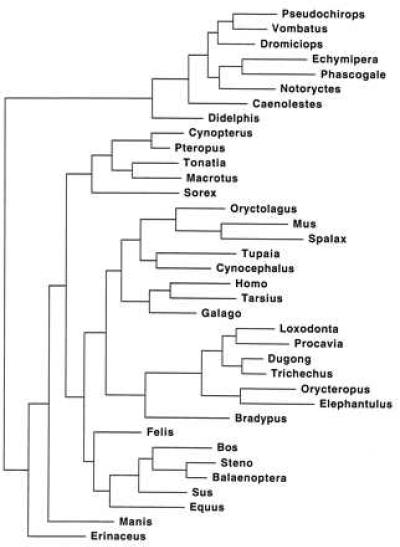
ML tree (-ln likelihood = 18921.95773) under the HKY85 model of sequence evolution. For scale, the terminal branch leading to Erinaceus represents 11.6% nucleotide substitution.
Figure 3.
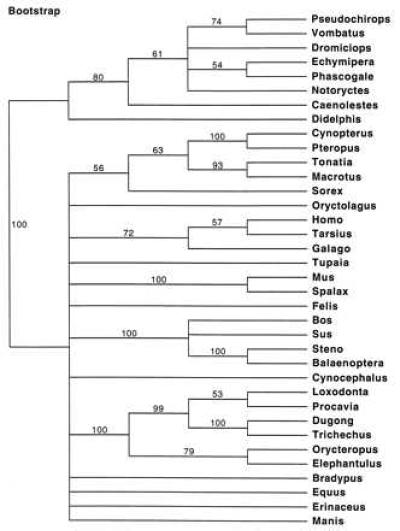
Majority rule bootstrap parsimony tree showing clades supported at or above the 50% level.
Templeton, Kishino–Hasegawa, and winning sites tests indicated that the African clade was significantly better than the best trees that constrained against the monophyly of these groups. Other clades, including Paenungulata and Cetartiodactyl, were not significantly better than the best trees that constrained against these groups. Clades that were rejected at the P = 0.05 level included (i) Anagalida, (ii) Archonta, (iii) Dermoptera + Megachiroptera + Primates, (iv) Hyracoidea + Perissodactyla, and (v) Ungulata, with or without the inclusion of tubulidentates. Epitheria was rejected by all of the parsimony tests if xenarthrans and pholidotans were the sister group to other placentals but not if Xenarthra alone was the sister group to other placentals. Other hypotheses, including Archonta (excepting chiropterans), Edentata, Ferungulata, Glires, and Tethytheria, could not be accepted or rejected based on statistical tests.
Most of the marsupial hypotheses were either not supported or could not be rejected at the P = 0.05 level. Exceptions included rejection of the Hershkovitz hypothesis (i.e., Dromiciops as a sister group to all other marsupials) based on the winning sites test and rejection of the diprotodontian–Notoryctes alliance based on the Kishino–Hasegawa test (parsimony).
DISCUSSION
Mammalian Phylogeny.
Stanhope et al. (35) found strong support for Paenungulata, a more inclusive African clade (Paenungulata + Macroscelidea + Tubulidentata), and Cetartiodactyla in an IRBP study that included representatives of 17 of 18 placental orders and that used a xenarthran (sloth) as an outgroup to other placentals. With the addition of the remaining placental order (pangolins) as well as a subdivided marsupial outgroup, these associations remain robust and are all supported at or above the 99% bootstrap level. These clades also are supported by other molecular data sets and are emerging as the most secure associations of placental orders (39–41). In the case of Paenungulata, several independent data sets now provide strong support in favor of this hypothesis and against the competing hypotheses that associates perissodactyls with hyracoids (39, 41, 51, 67). An analysis of morphological characters that includes fossil data (68) also favors Paenungulata. Likewise, molecular support for Cetartiodactyla corroborates recent fossil discoveries that document that cetaceans are derived from an ancestral stock with a paraxonic arrangement of the digits, as in artiodactyls (69). In contrast to whole mitochondrial genome studies (43, 55), IRBP does not provide strong support for Ferungulata. It remains to be seen whether this clade is robust in the mitochondrial genome studies when additional placental orders are represented.
At the base of the placental radiation, IRBP data do not make a convincing case for the basal split. Epitheria is not supported on the best trees but cannot be rejected based on statistical tests unless xenarthrans and pholidotans are the sister group to other placental mammals. The maximum parsimony and ML trees both associate the representative xenarthran with the African clade; this arrangement is not robust but raises the intriguing possibility of an expanded Gondwanan clade that may include the endemic African groups plus the South American xenarthrans. Arnason et al. (59) suggested a ferungulate association for xenarthrans based on mitochondrial protein coding gene sequences; however, that study did not include representatives of the African clade and does not allow for direct comparisons with the IRBP results.
Archonta is rejected by statistical tests, but we cannot reject an association that includes primates, dermopterans, and scandentians. Bats are monophyletic on both the ML and maximum parsimony trees, but support for bat monophyly is weak in the context of taxa included in our study. Stanhope et al. (34) found strong support for bat monophyly based on IRBP sequences but with less diverse ordinal representation. Even with weak support for bat monophyly, there remains strong support against Pettigrew’s (31) flying primate hypothesis.
All statistical tests reject Hyracoidea + Perissodactyla, Altungulata, Ungulata, and Anagalida at P < 0.0001. None of the other superordinal hypotheses is rejected so convincingly. This is not surprising because all of these superorders conflict with the African clade that includes paenungulates, aardvarks, and elephant shrews. Exon 28 of the von Willebrand factor and mitochondrial rRNA sequences also support the African clade and contradict the alternative hypotheses (39, 41). Here, morphological and molecular data are in striking contrast. Archibald’s (56) cladistic analyses support Ungulata and Anagalida. Furthermore, Archibald (56) proposed Ungulatomorpha as a superorder for ungulates and the extinct zhelestids (70) and suggested that zhelestids are a paraphyletic group that is near the base of the ungulate radiation. In this scheme, rectangular upper molars and other characters are synapomorphies for these superorders. Anagalida, which includes the Late Cretaceous Asian genera Zalambdalestes and Barunlestes, is not closely related to Ungulata in Archibald’s (56) scheme. However, the inclusion of elephant shrews in the African clade [also golden moles (41)] dissociates paenungulates from ferungulates. This either implies the independent evolution of ungulate characters in these two ungulate groups or alternatively the loss of such features in elephant shrews and golden moles (at least) after evolving in a more basal common ancestor.
The most robust marsupial clade is an association of all australidelphian orders plus caenolestids to the exclusion of Didelphimorphia. Separation of didelphids and caenolestids suggests independent evolution of sperm-pairing in these taxa. Recent evidence (71) corroborates this view because the style of pairing is different in these two groups. The phylogenetic position of bandicoots, which is controversial and has implications for the evolution of syndactyly, is not resolved by IRBP data. The association of a bandicoot (Echymipera) and a dasyurid (Phascogale) based on IRBP sequences is consistent with serological results (15), but we cannot reject the competing Eometatheria hypothesis of Kirsch et al. (12), according to which dasyurids are more closely related to diprotodontians, Dromiciops, and Notoryctes than to peramelinans. The phylogenetic position of bandicoots, which has implications for the evolution of syndactyly, remains one of the most problematic questions in marsupial systematics. Likewise, the position of the highly derived marsupial mole remains enigmatic based on IRBP data although at least one test argues against the Notoryctes–Diprotodontia hypothesis.
Several interordinal associations of mammals are emerging as robust including Cetartiodactyla, Paenungulata, and an even larger endemic African clade. Other hypotheses, including Archonta, Ungulata, and Anagalida, are rejected. Additional advances in our understanding of higher level relationships will require concatenation of multiple data sets. It is also important to increase taxonomic representation, especially where taxonomic diversity is great and there are questions about monophyly, e.g., Rodentia, Artiodactyla, and Insectivora.
IRBP Evolution in the Marsupial Mole.
The finding that exon 1 of the IRBP gene in the Notoryctes contains frameshift indels and stop codons in all three reading frames indicates that this sequence is from a pseudogene. Given this finding, we accounted for indel regions to restore the Notoryctes sequence into the correct reading frame and used mega 1.01 (72) to calculate uncorrected synonymous/nonsynonymous ratios. The average synonymous/nonsynonymous ratio in pairwise comparisons involving Notoryctes (4.02) is lower than in comparisons for other pairs of marsupials (5.18), but in all cases these ratios provide evidence of purifying selection. This is expected because, even in comparisons involving the Notoryctes pseudogene, the second sequence is from a functional IRBP gene. Also, Notoryctes diverged from other marsupials 66–81 million years ago (12), and most of the evolutionary history along the Notoryctes branch (see below) may have occurred under purifying selection.
Conceivably, the Notoryctes IRBP sequence is from a processed pseudogene that is not orthologous to the other IRBP sequences. We cannot reject this hypothesis. However, the marsupial mole is blind and has vestigial eyes that are hidden under the skin. Furthermore, the lens and pupil are absent, and the optic nerve is reduced (73). Given this degeneration and loss of function of the eyes, it might be expected that genes for proteins that function solely in vision should evolve as pseudogenes if functional copies no longer confer a fitness advantage. Evidence indicates that IRBP is a single-copy gene in mammals, and among taxa that have been investigated, there is no evidence for processed pseudogenes (35, 57). This finding suggests that the Notoryctes IRBP PCR product derives from the same locus that codes for a functional gene in other mammals but that in Notoryctes indels has accumulated because of the relaxation of purifying selection. Indeed, DNA sequencing of PCR products in seven other marsupials has yielded only intact sequences within each species; variation within a species, when it occurs, is limited to one to two nucleotide substitutions per species and can be attributed to PCR error and/or allelic variation. In the case of Notoryctes, both direct sequencing and sequencing of cloned PCR products result in the same sequence, including the indels. If a functional copy and a processed pseudogene are both present, we might expect to amplify and sequence both the functional and nonfunctional copies rather than just the single PCR product that we detected.
In a second blind mammal (Spalax), we do not find evidence for loss of function in the IRBP gene such as indels or stop codons. However, the branch leading to Spalax is longer than the branch leading to its sister lineage (Mus) (Fig. 1), and the ratio of changes at first + second positions to third positions is higher in Spalax (42:59) than Mus (29:55).
Saitou and Ueda (74) estimated the rate at which indels occur in primate pseudogenes at 0.17/kb/million years. Based on this rate, we estimate that Notoryctes IRBP has been nonfunctional since the late Oligocene-early Miocene, i.e., 18.5–24.7 million years ago based on the occurrence of three to four indels. Aplin and Archer (1) argued that Notoryctes is one of the most arid-adapted Australian mammals. Our estimate for the time frame over which Notoryctes IRBP became nonfunctional corresponds to a period of aridification in Australia (75). Possibly this is the time period when Notoryctes adapted to its fossorial lifestyle with relaxed selection pressures on vision.
Darwin (76) noted that the eyes of moles and some burrowing rodents are rudimentary in size and in some cases are covered by skin and fur. He attributed this to disuse, perhaps aided by natural selection. In the case of Notoryctes, the lack of functional eyes ostensibly eliminates any selective advantages associated with a functional IRBP gene product because there is no need to regenerate rhodopsin. The Notoryctes sequence that we report is consistent with this view and suggests that phenotypic degeneration of the eyes may be accompanied by parallel changes at the molecular level. In contrast, Crandall and Hillis (77) investigated the evolution of rhodopsin genes in blind, cave-dwelling crayfish relative to surface-dwelling forms and did not find evidence for loss of functional constraint. In this case, they suggest an additional, previously unrecognized function that is unrelated to light absorption—perhaps a role in circadian rhythms (77).
Acknowledgments
We thank Michael Woodburne and two anonymous reviewers for helpful comments, John Kirsch, Carey Krajewski, and Michael Westerman for DNA samples, and David Swofford for permission to use paup 4.0d52-57. This work was supported by the National Science Foundation (DEB-9419617), an Alfred P. Sloan Young Investigator’s Award in Molecular Evolution, and an intramural grant from the Academic Senate at the University of California, Riverside to M.S.S. and grants from the Nuffield Foundation and the Royal Society to M.J.S.
Footnotes
This paper was submitted directly (Track II) to the Proceedings Office.
Abbreviations: IRBP, interphotoreceptor retinoid binding protein; ML, maximum likelihood.
References
- 1.Aplin K, Archer M. In: Possums and Opossums: Studies in Evolution. Archer M, editor. Australia: Surrey Beatty and Sons; 1987. pp. xv–lxxii. [Google Scholar]
- 2.Marshall L G, Case J A, Woodburne M O. In: Current Mammalogy. Genoways H H, editor. Vol. 2. New York: Plenum; 1990. pp. 433–505. [Google Scholar]
- 3.Szalay F S. Evolutionary History of the Marsupials and an Analysis of Osteological Characters. New York: Cambridge Univ. Press; 1994. [Google Scholar]
- 4.Novacek M J. Nature (London) 1992;356:121–125. doi: 10.1038/356121a0. [DOI] [PubMed] [Google Scholar]
- 5.Luckett W P. J Mamm Evol. 1994;2:255–283. [Google Scholar]
- 6.Biggers J D, DeLamater E D. Nature (London) 1965;208:1602–1603. doi: 10.1038/208402b0. [DOI] [PubMed] [Google Scholar]
- 7.Szalay F S. In: Carnivorous Marsupials. Archer M, editor. New South Wales, Sydney, Australia: R. Zool. Soc.; 1982. pp. 621–640. [Google Scholar]
- 8.Hershkovitz P. Bonn Zool Beitr. 1992;43:181–213. [Google Scholar]
- 9.Springer M S, Westerman M, Kirsch J A W. J Mamm Evol. 1994;2:85–115. [Google Scholar]
- 10.Szalay F S. In: Mammal Phylogeny. I. Mesozoic Differentiation, Multituberculates, Monotremes, Early Therians, and Marsupials. Szalay F S, Novacek M J, McKenna M C, editors. New York: Springer; 1993. pp. 216–242. [Google Scholar]
- 11.Kirsch J A W, Dickerman A W, Reig O A, Springer M S. Proc Natl Acad Sci USA. 1991;88:10465–10469. doi: 10.1073/pnas.88.23.10465. [DOI] [PMC free article] [PubMed] [Google Scholar]
- 12.Kirsch J A W, Lapointe F-J, Springer M S. Aust J Zool. 1997;45:211–280. [Google Scholar]
- 13.Bensley B A. Trans Linn Soc London 2nd Ser (Zoology) 1903;9:83–217. [Google Scholar]
- 14.Marshall L G. Proc R Soc Vic. 1972;85:51–60. [Google Scholar]
- 15.Baverstock P R, Krieg M, Birrell J. In: Mammals from Pouches and Eggs: Genetics, Breeding and Evolution of Marsupials and Monotremes. Marshall Graves J A, Hope R M, Cooper D W, editors. Melbourne, Australia: Commonwealth Scientific and Industrial Research Organization; 1990. pp. 131–145. [Google Scholar]
- 16.van der Klaauw C J. Bull Am Mus Nat Hist. 1931;62:1–352. [Google Scholar]
- 17.Calaby J H, Corbett L H, Sharman G B, Johnston P G. Aust J Biol Sci. 1974;27:529–532. doi: 10.1071/bi9740529. [DOI] [PubMed] [Google Scholar]
- 18.Retief J D, Krajewski C, Westerman M, Winkfein R J, Dixon G H. Proc R Soc London Ser B. 1995;259:7–14. doi: 10.1098/rspb.1995.0002. [DOI] [PubMed] [Google Scholar]
- 19.Krajewski C, Buckley L, Westerman M. Proc R Soc London Ser B. 1997;264:911–917. doi: 10.1098/rspb.1997.0126. [DOI] [PMC free article] [PubMed] [Google Scholar]
- 20.McKenna M C. In: Phylogeny of the Primates: An Interdisciplinary Approach. Luckett W P, Szalay F S, editors. New York: Plenum; 1975. pp. 21–46. [Google Scholar]
- 21.Novacek M J, Wyss A R. Cladistics. 1986;2:257–287. doi: 10.1111/j.1096-0031.1986.tb00463.x. [DOI] [PubMed] [Google Scholar]
- 22.Novacek M J, Wyss A R, McKenna M C. In: The Phylogeny and Classification of Tetrapods. II. Mammals. Benton M J, editor. 35B. Clarendon, Oxford: Systematics Association; 1988. pp. 31–72. [Google Scholar]
- 23.Novacek M J. In: Current Mammalogy. Genoways H H, editor. Vol. 2. New York: Plenum; 1990. pp. 507–543. [Google Scholar]
- 24.Novacek M J. J Mamm Evol. 1993;1:3–30. [Google Scholar]
- 25.Zeller U, Wible J R, Elsner M. J Mamm Evol. 1993;1:31–46. [Google Scholar]
- 26.Gaudin T J, Wible J R, Hopson J A, Turnbull W D. J Mamm Evol. 1996;3:31–79. [Google Scholar]
- 27.Gregory W K. Bull Am Mus Nat Hist. 1910;27:1–524. [Google Scholar]
- 28.Szalay F S. In: Major Patterns of Vertebrate Evolution. Hecht M K, Goody P C, Hecht B M, editors. New York: Plenum; 1977. pp. 315–374. [Google Scholar]
- 29.Novacek M J. In: Proceedings of the Chicago Field Museum 1992 Spring Symposium in Systematics. Rieppel O, Grande L, editors. New York: Academic; 1994. pp. 85–113. [Google Scholar]
- 30.Simmons N B. In: Ecology, Evolution, and Behavior of Bats. Racey P A, Swift S M, editors. Vol. 67. London: Oxford Univ. Press; 1995. pp. 27–43. [Google Scholar]
- 31.Pettigrew J D. Science. 1986;231:1304–1306. doi: 10.1126/science.3945827. [DOI] [PubMed] [Google Scholar]
- 32.Adkins R M, Honeycutt R L. Proc Natl Acad Sci USA. 1991;88:10317–10321. doi: 10.1073/pnas.88.22.10317. [DOI] [PMC free article] [PubMed] [Google Scholar]
- 33.Bailey W J, Slightom J L, Goodman M. Science. 1992;256:86–89. doi: 10.1126/science.1301735. [DOI] [PubMed] [Google Scholar]
- 34.Stanhope M J, Czelusniak J, Si J-S, Nickerson J, Goodman M. Mol Phylogenet Evol. 1992;1:148–160. doi: 10.1016/1055-7903(92)90026-d. [DOI] [PubMed] [Google Scholar]
- 35.Stanhope M J, Smith M R, Waddell V G, Porter C A, Shivji M S, Goodman M. J Mol Evol. 1996;43:83–92. doi: 10.1007/BF02337352. [DOI] [PubMed] [Google Scholar]
- 36.Luckett W P, Hartenberger J-L. J Mamm Evol. 1993;1:127–147. [Google Scholar]
- 37.Novacek M J. In: Macromolecular Sequences in Systematic and Evolutionary Biology. Goodman M, editor. New York: Plenum; 1982. pp. 3–41. [Google Scholar]
- 38.Graur D, Duret L, Gouy M. Nature (London) 1996;379:333–335. doi: 10.1038/379333a0. [DOI] [PubMed] [Google Scholar]
- 39.Porter C A, Goodman M, Stanhope M J. Mol Phylogenet Evol. 1996;5:89–101. doi: 10.1006/mpev.1996.0008. [DOI] [PubMed] [Google Scholar]
- 40.Madsen O, Deen P M T, Pesole G, Saccone C, de Jong W W. Mol Biol Evol. 1997;14:363–371. doi: 10.1093/oxfordjournals.molbev.a025772. [DOI] [PubMed] [Google Scholar]
- 41.Springer M S, Cleven G C, Madsen O, de Jong W W, Waddell V G, Amrine H M, Stanhope M J. Nature (London) 1997;388:61–64. doi: 10.1038/40386. [DOI] [PubMed] [Google Scholar]
- 42.Graur D, Hide W A, Li W-H. Nature (London) 1991;351:649–652. doi: 10.1038/351649a0. [DOI] [PubMed] [Google Scholar]
- 43.D’Erchia A M, Gissi C, Pesole G, Saccone C, Arnason U. Nature (London) 1996;381:597–600. doi: 10.1038/381597a0. [DOI] [PubMed] [Google Scholar]
- 44.Simpson G G. Bull Am Mus Nat Hist. 1945;85:1–350. [Google Scholar]
- 45.Wyss A R, Novacek M J, McKenna M C. Mol Biol Evol. 1987;4:99–116. doi: 10.1093/oxfordjournals.molbev.a040435. [DOI] [PubMed] [Google Scholar]
- 46.Fischer M S. In: The Evolution of Perissodactyls. Prothero D R, Schoch R M, editors. New York: Oxford Univ. Press; 1989. pp. 37–56. [Google Scholar]
- 47.Prothero D R, Schoch R M. In: The Evolution of Perissodactyls. Prothero D R, Schoch R M, editors. New York: Oxford Univ. Press; 1989. pp. 504–529. [Google Scholar]
- 48.Fischer M S, Tassy P. In: Mammal Phylogeny. II. Placentals. Szalay F S, Novacek M J, McKenna M C, editors. New York: Springer; 1993. pp. 217–234. [Google Scholar]
- 49.Shoshani J. In: Mammal Phylogeny. II. Placentals. Szalay F S, Novacek M J, McKenna M C, editors. New York: Springer; 1993. pp. 235–256. [Google Scholar]
- 50.Springer M S, Kirsch J A W. J Mamm Evol. 1993;1:149–166. [Google Scholar]
- 51.Lavergne A, Douzery E, Stichler T, Catzeflis F M, Springer M S. Mol Phylogenet Evol. 1996;6:245–258. doi: 10.1006/mpev.1996.0074. [DOI] [PubMed] [Google Scholar]
- 52.Graur D, Higgins D G. Mol Biol Evol. 1994;11:357–364. doi: 10.1093/oxfordjournals.molbev.a040118. [DOI] [PubMed] [Google Scholar]
- 53.Gatesy J, Hayashi C, Cronin M A, Arctander P. Mol Biol Evol. 1996;13:954–963. doi: 10.1093/oxfordjournals.molbev.a025663. [DOI] [PubMed] [Google Scholar]
- 54.Randi E, Lucchini V, Diong C H. J Mamm Evol. 1996;3:163–194. [Google Scholar]
- 55.Krettek A, Gullberg A, Arnason U. J Mol Evol. 1995;42:952–957. doi: 10.1007/BF00173175. [DOI] [PubMed] [Google Scholar]
- 56.Archibald J D. Science. 1996;272:1150–1153. doi: 10.1126/science.272.5265.1150. [DOI] [PubMed] [Google Scholar]
- 57.Pepperberg D R, Okajima T-I L, Wiggert B, Ripps H, Crouch R K, Chader G J. Mol Neurobiol. 1993;7:61–84. doi: 10.1007/BF02780609. [DOI] [PubMed] [Google Scholar]
- 58.Rose K D, Emry R J. In: Mammal Phylogeny. II. Placentals. Szalay F S, Novacek M J, McKenna M C, editors. New York: Springer; 1993. pp. 81–102. [Google Scholar]
- 59.Arnason U, Gullberg A, Janke A. Mol Biol Evol. 1997;14:762–768. doi: 10.1093/oxfordjournals.molbev.a025816. [DOI] [PubMed] [Google Scholar]
- 60.Kirsch J A W, Springer M S, Krajewski C, Archer M, Aplin K, Dickerman A W. J Mol Evol. 1990;30:434–448. doi: 10.1007/BF02101115. [DOI] [PubMed] [Google Scholar]
- 61.Thompson J D, Higgins D G, Gibson T J. Nucleic Acids Res. 1994;22:4673–4780. doi: 10.1093/nar/22.22.4673. [DOI] [PMC free article] [PubMed] [Google Scholar]
- 62.Hillis D M, Huelsenbeck J Hered. 1992;83:189–195. doi: 10.1093/oxfordjournals.jhered.a111190. [DOI] [PubMed] [Google Scholar]
- 63.Hasegawa M, Kishino H, Yano T. J Mol Evol. 1985;22:160–174. doi: 10.1007/BF02101694. [DOI] [PubMed] [Google Scholar]
- 64.Templeton A R. Evolution. 1983;37:221–244. doi: 10.1111/j.1558-5646.1983.tb05533.x. [DOI] [PubMed] [Google Scholar]
- 65.Kishino H, Hasegawa M. J Mol Evol. 1989;29:170–179. doi: 10.1007/BF02100115. [DOI] [PubMed] [Google Scholar]
- 66.Prager E M, Wilson A C. J Mol Evol. 1988;27:326–335. doi: 10.1007/BF02101195. [DOI] [PubMed] [Google Scholar]
- 67.Graur D, Gouy M, Duret L. Mol Phylogenet Evol. 1997;7:195–200. doi: 10.1006/mpev.1996.0391. [DOI] [PubMed] [Google Scholar]
- 68.Novacek M J. Syst Biol. 1992;41:58–73. [Google Scholar]
- 69.Gingerich P D, Smith B H, Simons E L. Science. 1990;249:154–157. doi: 10.1126/science.249.4965.154. [DOI] [PubMed] [Google Scholar]
- 70.Butler P M. Biol Rev. 1990;65:529. [Google Scholar]
- 71.Temple-Smith P. In: Possums and Opossums: Studies in Evolution. Archer M, editor. Chipping Norton, Australia: Surrey Beatty & Sons; 1987. pp. 171–193. [Google Scholar]
- 72.Kumar S, Tamura K, Nei M. mega, Molcular Evolutionary Genetics Analysis. University Park, PA: Pennsylvania State Univ. Press; 1993. , Ver. 1.01. [Google Scholar]
- 73.Nowak R M, Paradiso J L. Walker’s Mammals of the World. Baltimore: Johns Hopkins Univ. Press; 1983. [Google Scholar]
- 74.Saitou N, Ueda S. Mol Biol Evol. 1994;11:504–512. doi: 10.1093/oxfordjournals.molbev.a040130. [DOI] [PubMed] [Google Scholar]
- 75.Case J A. Geol Soc Spec Publ. 1989;47:217–226. [Google Scholar]
- 76.Darwin C R. On the Origin of Species. London: John Murray; 1859. [Google Scholar]
- 77.Crandall K A, Hillis D M. Nature (London) 1997;387:667–668. doi: 10.1038/42628. [DOI] [PubMed] [Google Scholar]